
Crypto Market Overview: Bulls resurface amid US-Iran peace talks – AI tokens lead the rally
Bởi Vishal Dixit
Ngày xuất bản: 25 Mar 2026 | Ngày chỉnh sửa: 25 Mar 2026


BÀI VIẾT PHỔ BIẾN

Bitcoin (BTC) holds ground above $70,000 at press time on Wednesday as the US attempts to de-escalate tensions in the Middle East. The restriction on passive rewards for holding stablecoins in the latest draft of the CLARITY Act negatively impacts crypto stocks like Circle (CRCL).
- Bitcoin holds above $70,000 amid one-month ceasefire talks between the US and Iran.
- Banks and crypto companies compromise in the latest CLARITY Act draft, rewarding stablecoin activity rather than holding, plunging stocks like Circle.
- AI tokens such as TAO and FET lead the rally, with HYPE following suit.
Bitcoin (BTC) holds ground above $70,000 at press time on Wednesday as the US attempts to de-escalate tensions in the Middle East. The restriction on passive rewards for holding stablecoins in the latest draft of the CLARITY Act negatively impacts crypto stocks like Circle (CRCL).
Meanwhile, Artificial Intelligence (AI) crypto tokens such as Bittensor and the Artificial Superintelligence Alliance (FET) remain top performers over the last 24 hours, followed by Hyperliquid (HYPE).
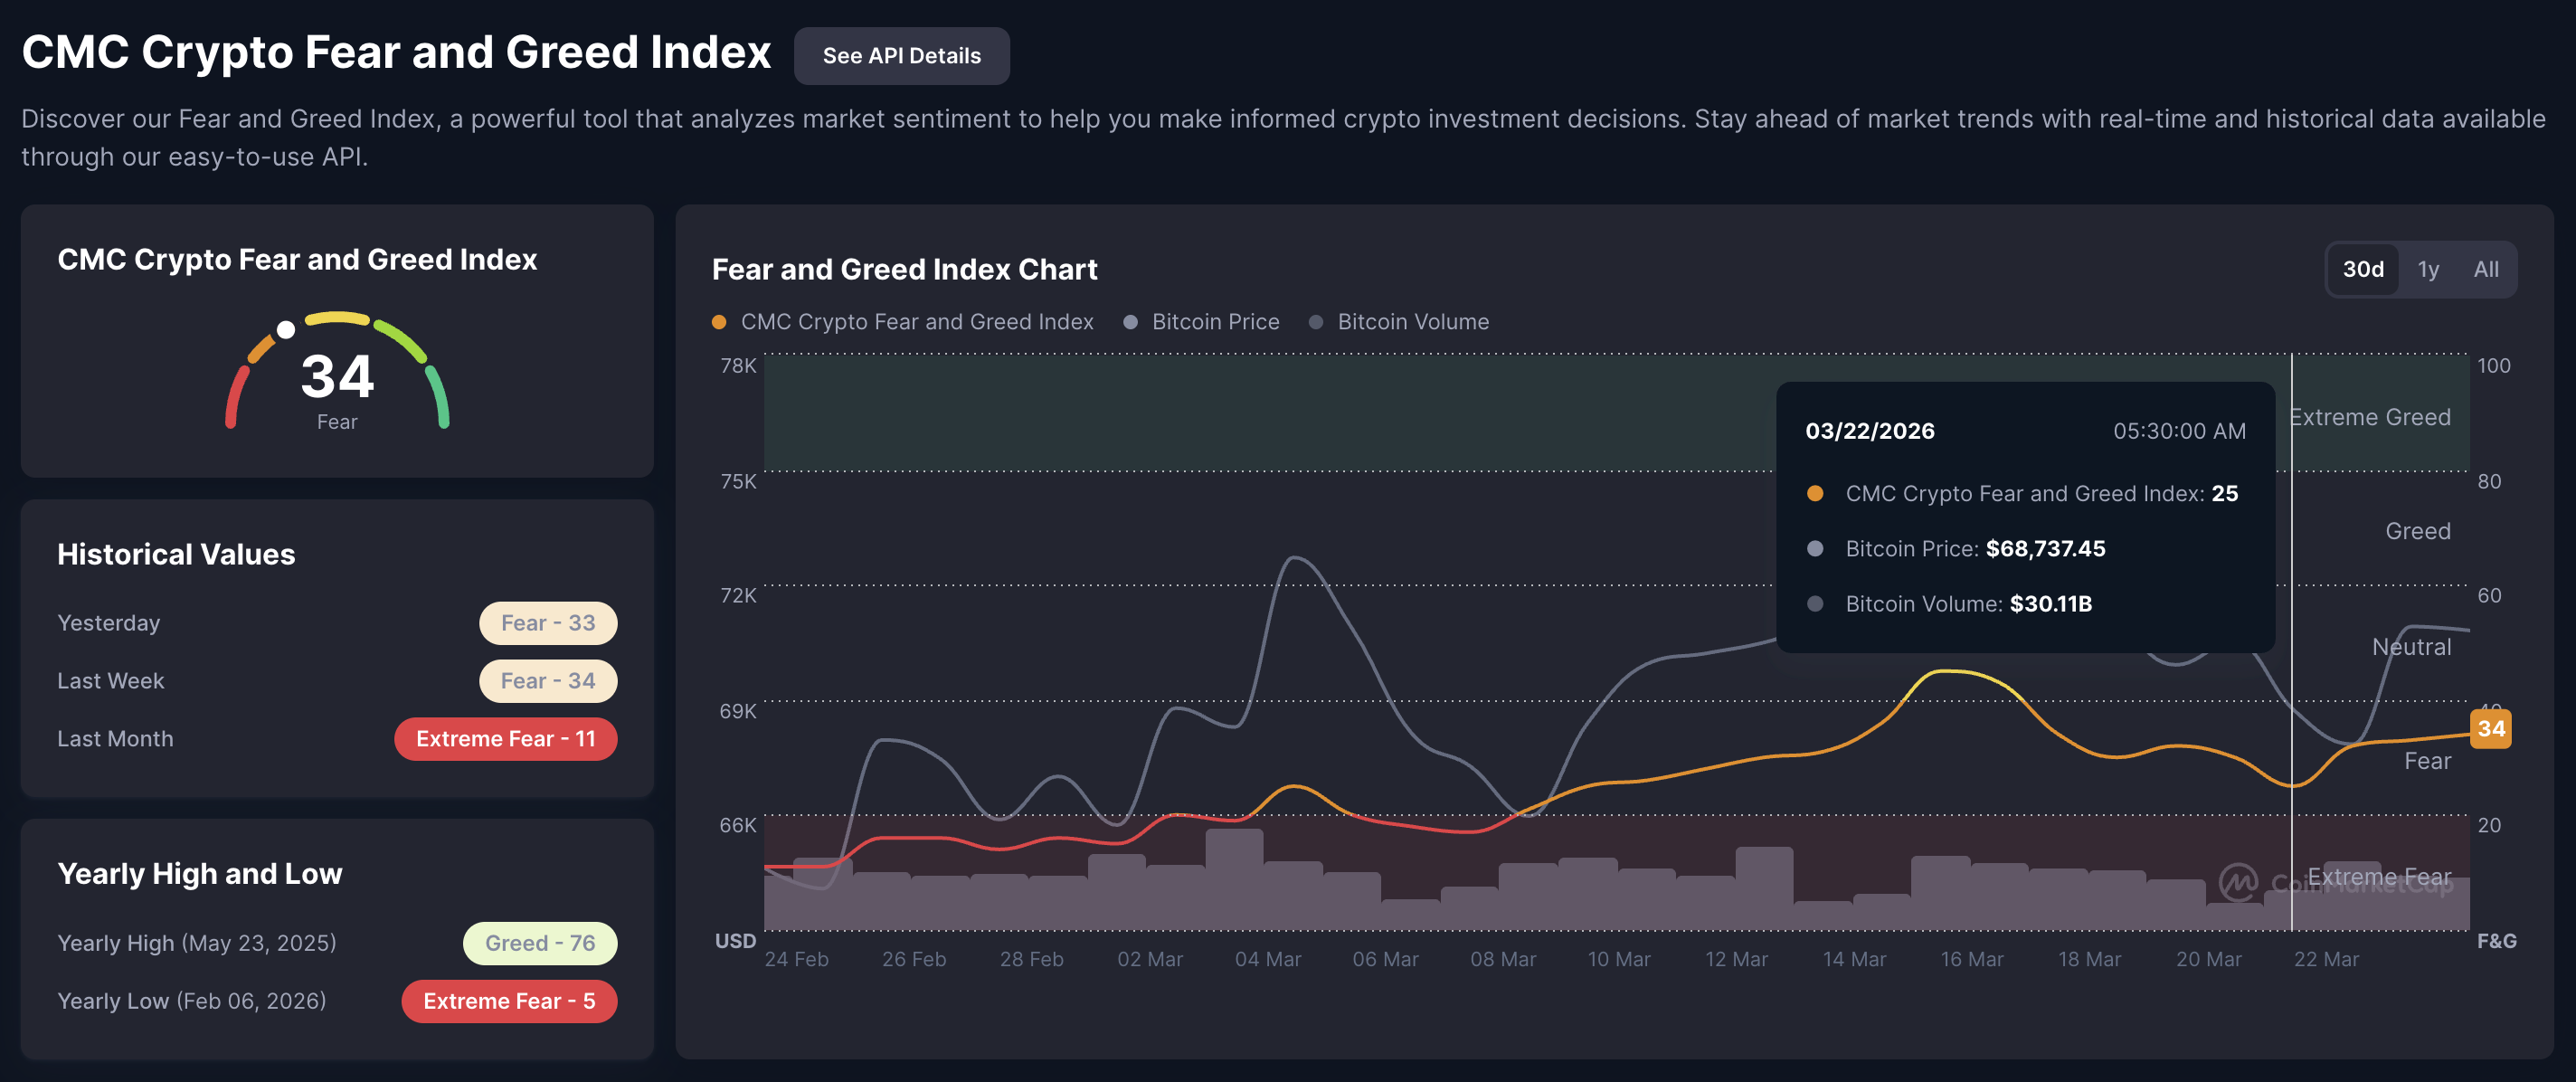
Crypto market sentiment holds amid US-Iran peace talks, CLARITY Act draft
Bitcoin holds steady above $70,000 during early Asian hours on Wednesday while Ethereum (ETH) approaches $2,200 and Ripple (XRP) crosses above $1.40. The broader market sentiment holds steady as the US attempts to ease pressure in the Middle East through peace talks, possibly seeking a one-month ceasefire through diplomatic routes, sending Crude Oil futures below $90.
However, the Circle (CRCL) stock price dropped 20% the previous day after US banks and crypto companies compromised on the latest draft of the Digital Asset Market Clarity Act. According to CoinDesk, the draft restricts passive rewards for holding the stablecoin but will reward activity. This provides a middle ground for banks and crypto companies, but limits stablecoins to payment utility tokens rather than as a store-of-value product.
Top Crypto Gainers: TAO, FET and HYPE lead gains
Bittensor shows a steady upward trend after the bullish breakout of a falling channel pattern on the daily chart. At the time of writing, TAO trades near $340 on Wednesday, holding up roughly 15% from the previous day.
The near-term bias is bullish as TAO extends away from the clustered 50-day, 100-day, and 200-day Exponential Moving Averages, which now trail well below spot and underline a strengthening uptrend structure. Momentum remains firm, with the Relative Strength Index (RSI) at 79 holding in the overbought territory and the Moving Average Convergence Divergence (MACD) indicator staying positive and above its signal line, as the histogram keeps expanding, all of which reinforces persistent upside pressure rather than signaling immediate exhaustion.
If the breakout rally secures a daily close above $369, it could target the November 1 high at $539.
Looking down, the $300 psychological level remains the crucial support for Bittensor.
FET is up 4% at press time on Wednesday, extending recovery for the third consecutive day. The near-term bias is cautiously bullish as price holds above the 50- and 100-day EMAs but trades just below the 200-day EMA, reinforcing an improving medium-term structure.
If FET clears the 78.6% Fibonacci retracement at $0.2622, measured from the $0.31 high to the $0.13 low, it could target the 200-day EMA at $0.3013.
The MACD is above its signal line, with a modestly positive histogram, suggesting strengthening bullish momentum after the recent breakout. The RSI at 69 is on the verge of signaling overbought conditions, indicating upside pressure persists but with increased risk of a pause or consolidation.
On the downside, the 100-day EMA at $0.2186 serves as the immediate support level.
Hyperliquid shows early signs of recovery, joining the AI tokens as top gainers over the last 24 hours. HYPE is trading near $40 at press time on Wednesday, up 8% from the previous day, breaking a three-day losing streak. The near-term bias is mildly bullish as HYPE holds above the crucial daily EMAs, signaling an improving medium-term trend.
The MACD line remains slightly below the signal line, hovering around the zero mark, with a contracting negative histogram, which hints at waning downside momentum after the recent pullback. The RSI at 62 indicates that buyers retain an edge without immediate overbought stress.
Looking up, the 78.6% Fibonacci retracement level at $47.51, measured from the $59.45 high to the $20.85 low, serves as the upside target.
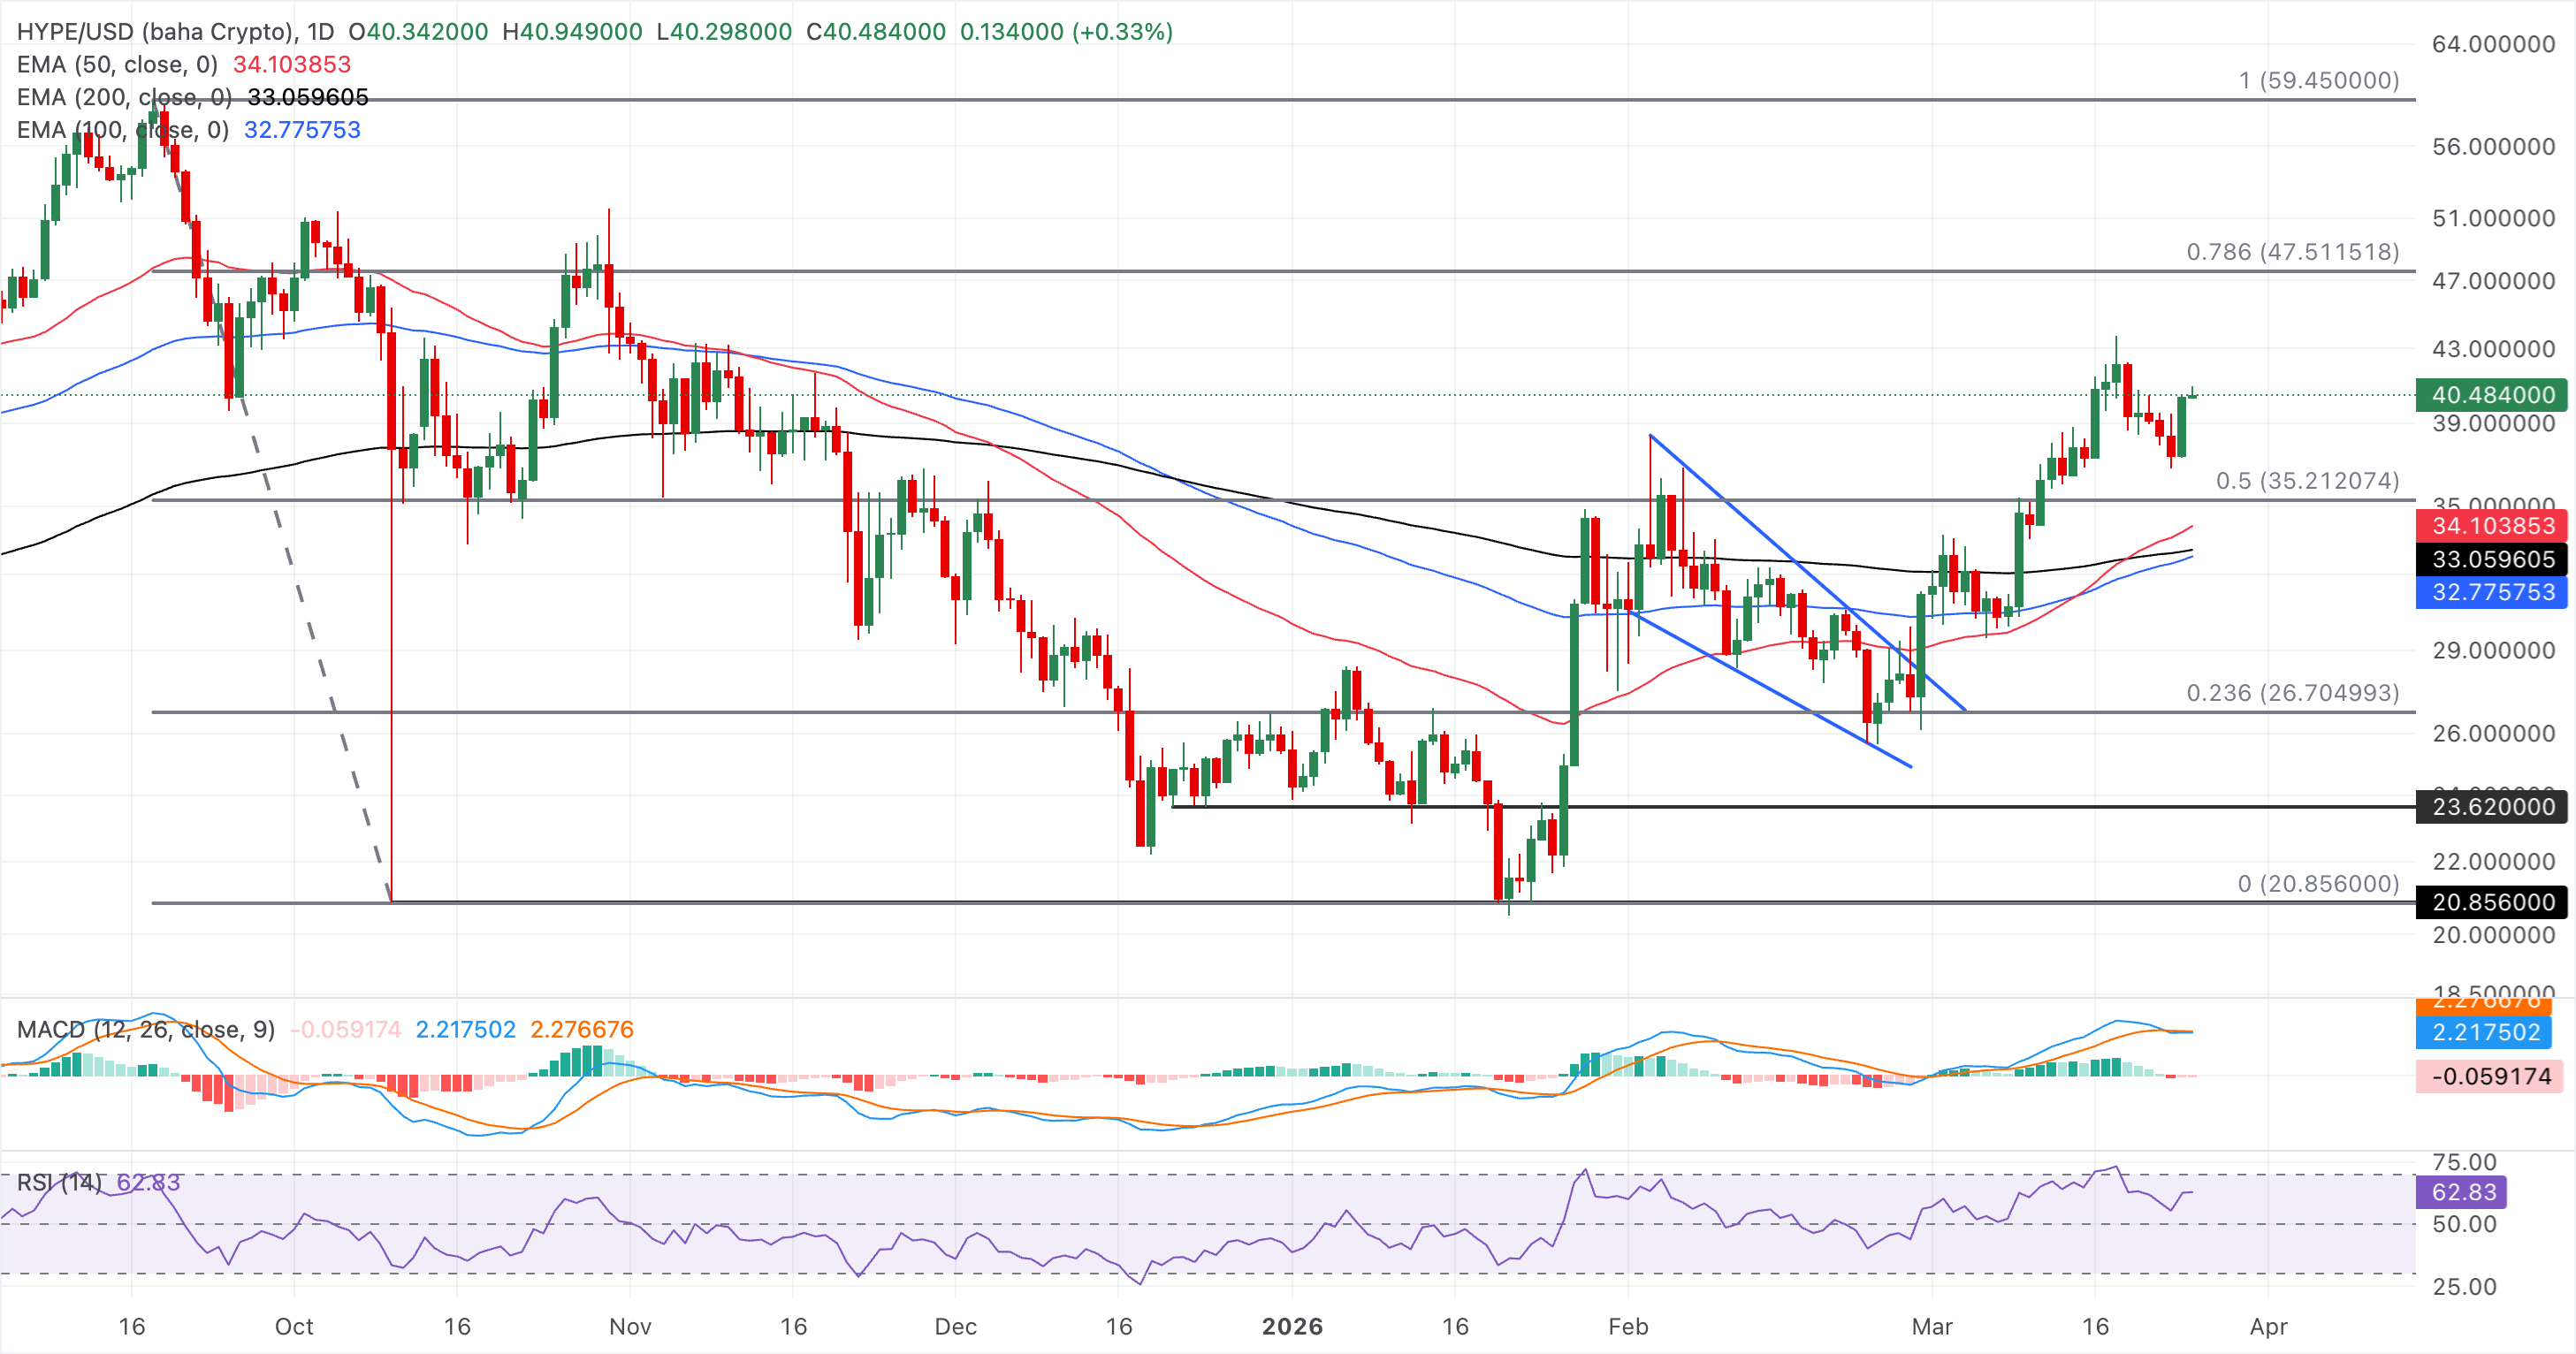
Immediate support for HYPE remains the 50% retracement level at $35.21.
(The technical analysis of this story was written with the help of an AI tool.)

Hơn một triệu người dùng dựa vào FXStreet để có dữ liệu thị trường thời gian thực, công cụ biểu đồ, góc nhìn chuyên gia và tin tức Forex. Lịch kinh tế toàn diện và các hội thảo web giáo dục giúp nhà giao dịch luôn cập nhật và đưa ra quyết định có tính toán. FXStreet có khoảng 60 nhân sự, chia giữa trụ sở Barcelona và nhiều khu vực toàn cầu.
Đọc thêm


