
Crypto Overview: Bitcoin retreats as liquidations cross $500 million – Toncoin, Near Protocol outperform
Bởi Vishal Dixit
Đã cập nhật: 7 May 2026


BÀI VIẾT PHỔ BIẾN

Bitcoin (BTC) is holding above $80,000 at press time on Thursday, retracing after three straight days of gains. Total liquidations exceeded $500 million in the last 24 hours, suggesting increased short-term volatility in the market.
- Bitcoin slips below $81,000 on Thursday, risking a three-day recovery streak.
- Total liquidations cross $500 million in 24 hours, suggesting short-term volatility.
- Toncoin and Near Protocol emerge as top performers over the last 24 hours.
Bitcoin (BTC) is holding above $80,000 at press time on Thursday, retracing after three straight days of gains. Total liquidations exceeded $500 million in the last 24 hours, suggesting increased short-term volatility in the market. Steering clear of the whipsaw, Toncoin (TON) and Near Protocol (NEAR) emerge as top performers in the same time period with double-digit gains.
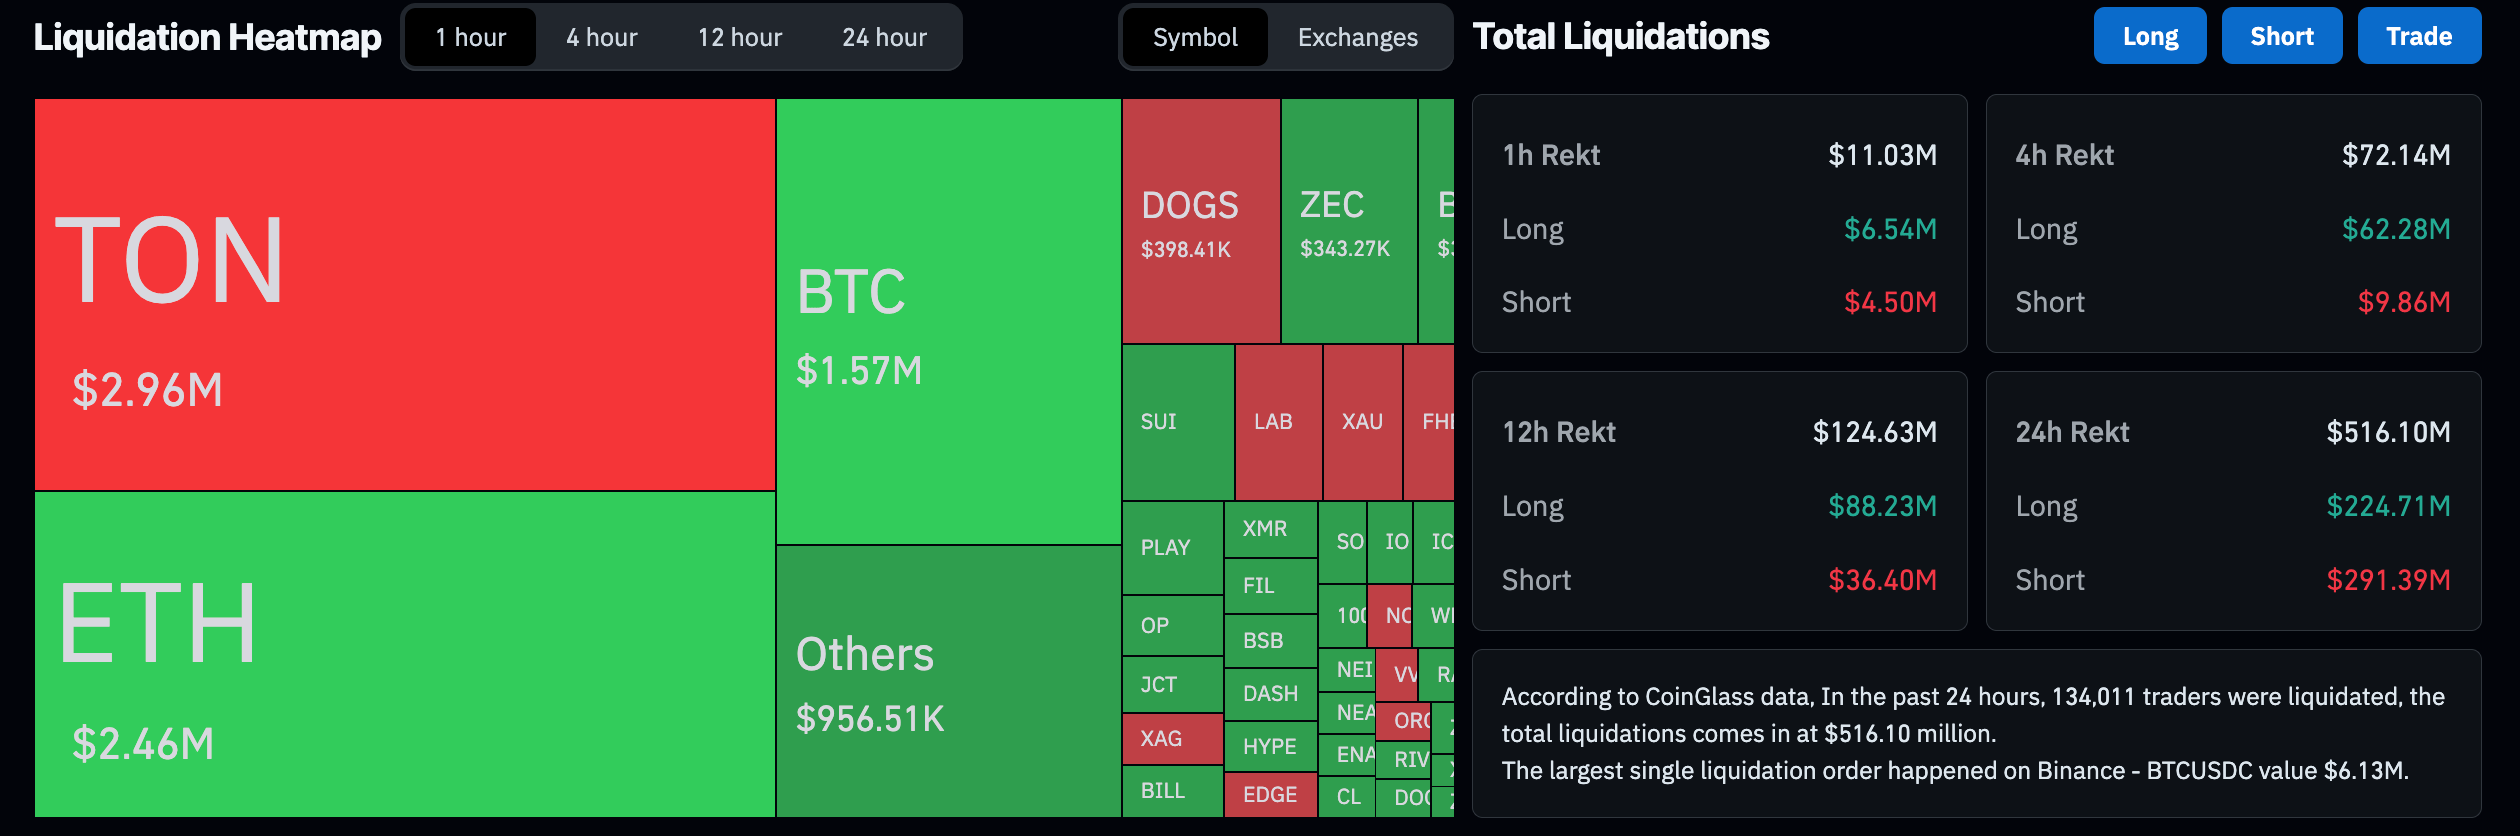
Liquidations cross $500 million as Bitcoin recovery weakens
The broader cryptocurrency market is turning indecisive in the short term as Bitcoin tests ground above the $80,000 mark. CoinGlass data shows $516 million of total liquidations over the last 24 hours, with $224 million in long liquidations and $291 million in short liquidations.
Bitcoin trades around $80,900 at press time on Thursday, maintaining a mild near-term bullish bias as price holds well above the 50-day and 100-day Exponential Moving Averages (EMAs) at roughly $75,168 and $76,450, respectively.
Bitcoin is testing overhead resistance within an ascending structure near $82,000, and a daily close above this zone could target the 200-day EMA at $84,018, which now serves as the next key topside barrier.
Momentum remains constructive, with the Relative Strength Index (RSI) hovering around 66, hinting at firm buying pressure but edging toward overbought territory, and a positive Moving Average Convergence Divergence (MACD) reading reinforces the upward tone.
On the downside, initial support comes from the cluster of shorter-term EMAs, with the 100-day EMA at $76,450, followed by the 50-day EMA near $75,168. Deeper retracements would be expected to draw buyers toward the rising trendline support around $69,329 as long as the broader bullish structure remains intact.
Top Crypto Gainers: Toncoin and Near Protocol eye further recovery
Toncoin extends a steady recovery for the sixth consecutive day, entering a steep bullish phase after decisively breaking above its key moving averages. The 50-day, 100-day and 200-day EMAs at $1.4553, $1.4586 and $1.7102, respectively, now trail well below spot, reinforcing a strong upside bias as price accelerates into fresh highs.
Momentum remains extreme, with the RSI hovering deep in overbought territory near 92, while the Moving Average Convergence Divergence (MACD) holds firmly above the zero line with a wide positive spread, hinting that bulls still control the tape despite stretched conditions.
The first meaningful cushion emerges around the $2.0130 broken resistance level, followed by the 200-day EMA at $1.7102, which now serves as the nearest major trend filter.
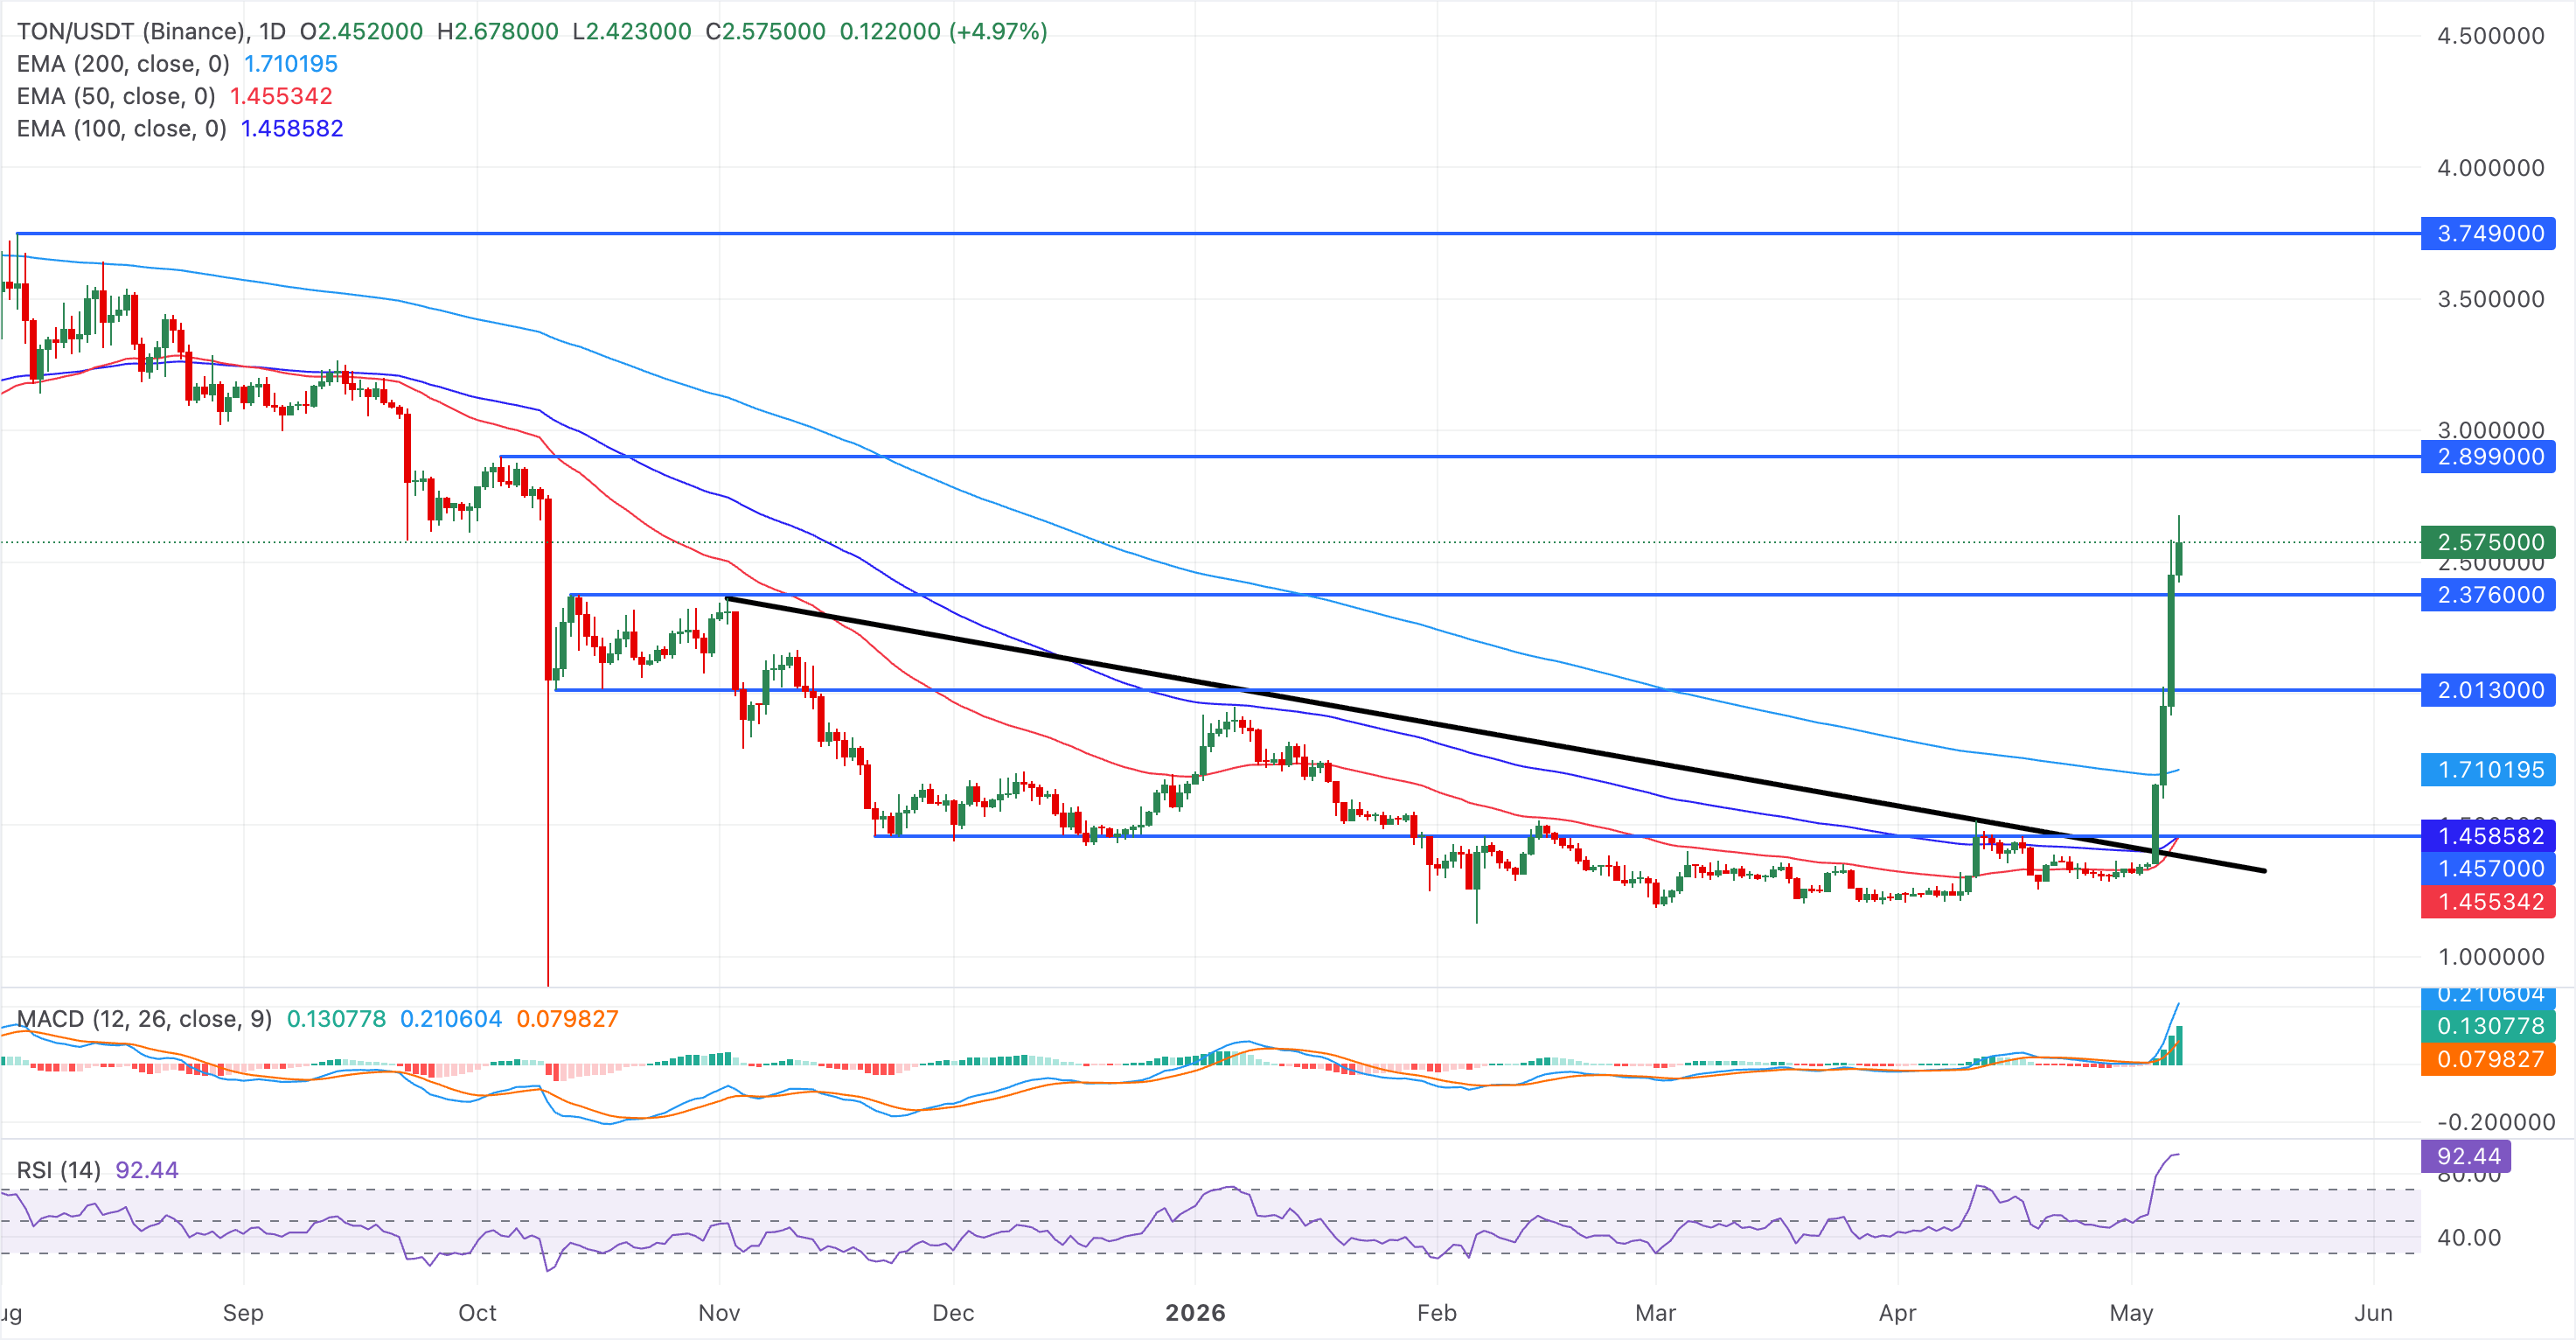
The immediate resistance for TON lies at the $2.899 peak from October 4, guarding the upside above the $3.00 round figure.
Near Protocol has extended its rebound above the 50-day and 100-day EMAs at $1.3314 and $1.3694, tilting the near-term bias to the upside while it still trades below the longer-term 200-day EMA at $1.6016. The RSI remains in bullish territory near 65, with room to run before reaching the overbought zone, and the MACD crosses above the signal line, suggesting renewed upside momentum.
The 200-day EMA at $1.6016 is the first significant hurdle, close to the 50% retracement of a downswing from $3.185 to $0.8410 at $1.7364. A daily close above these barriers would open the way toward the 78.6% Fibonacci retracement level at $2.3952.
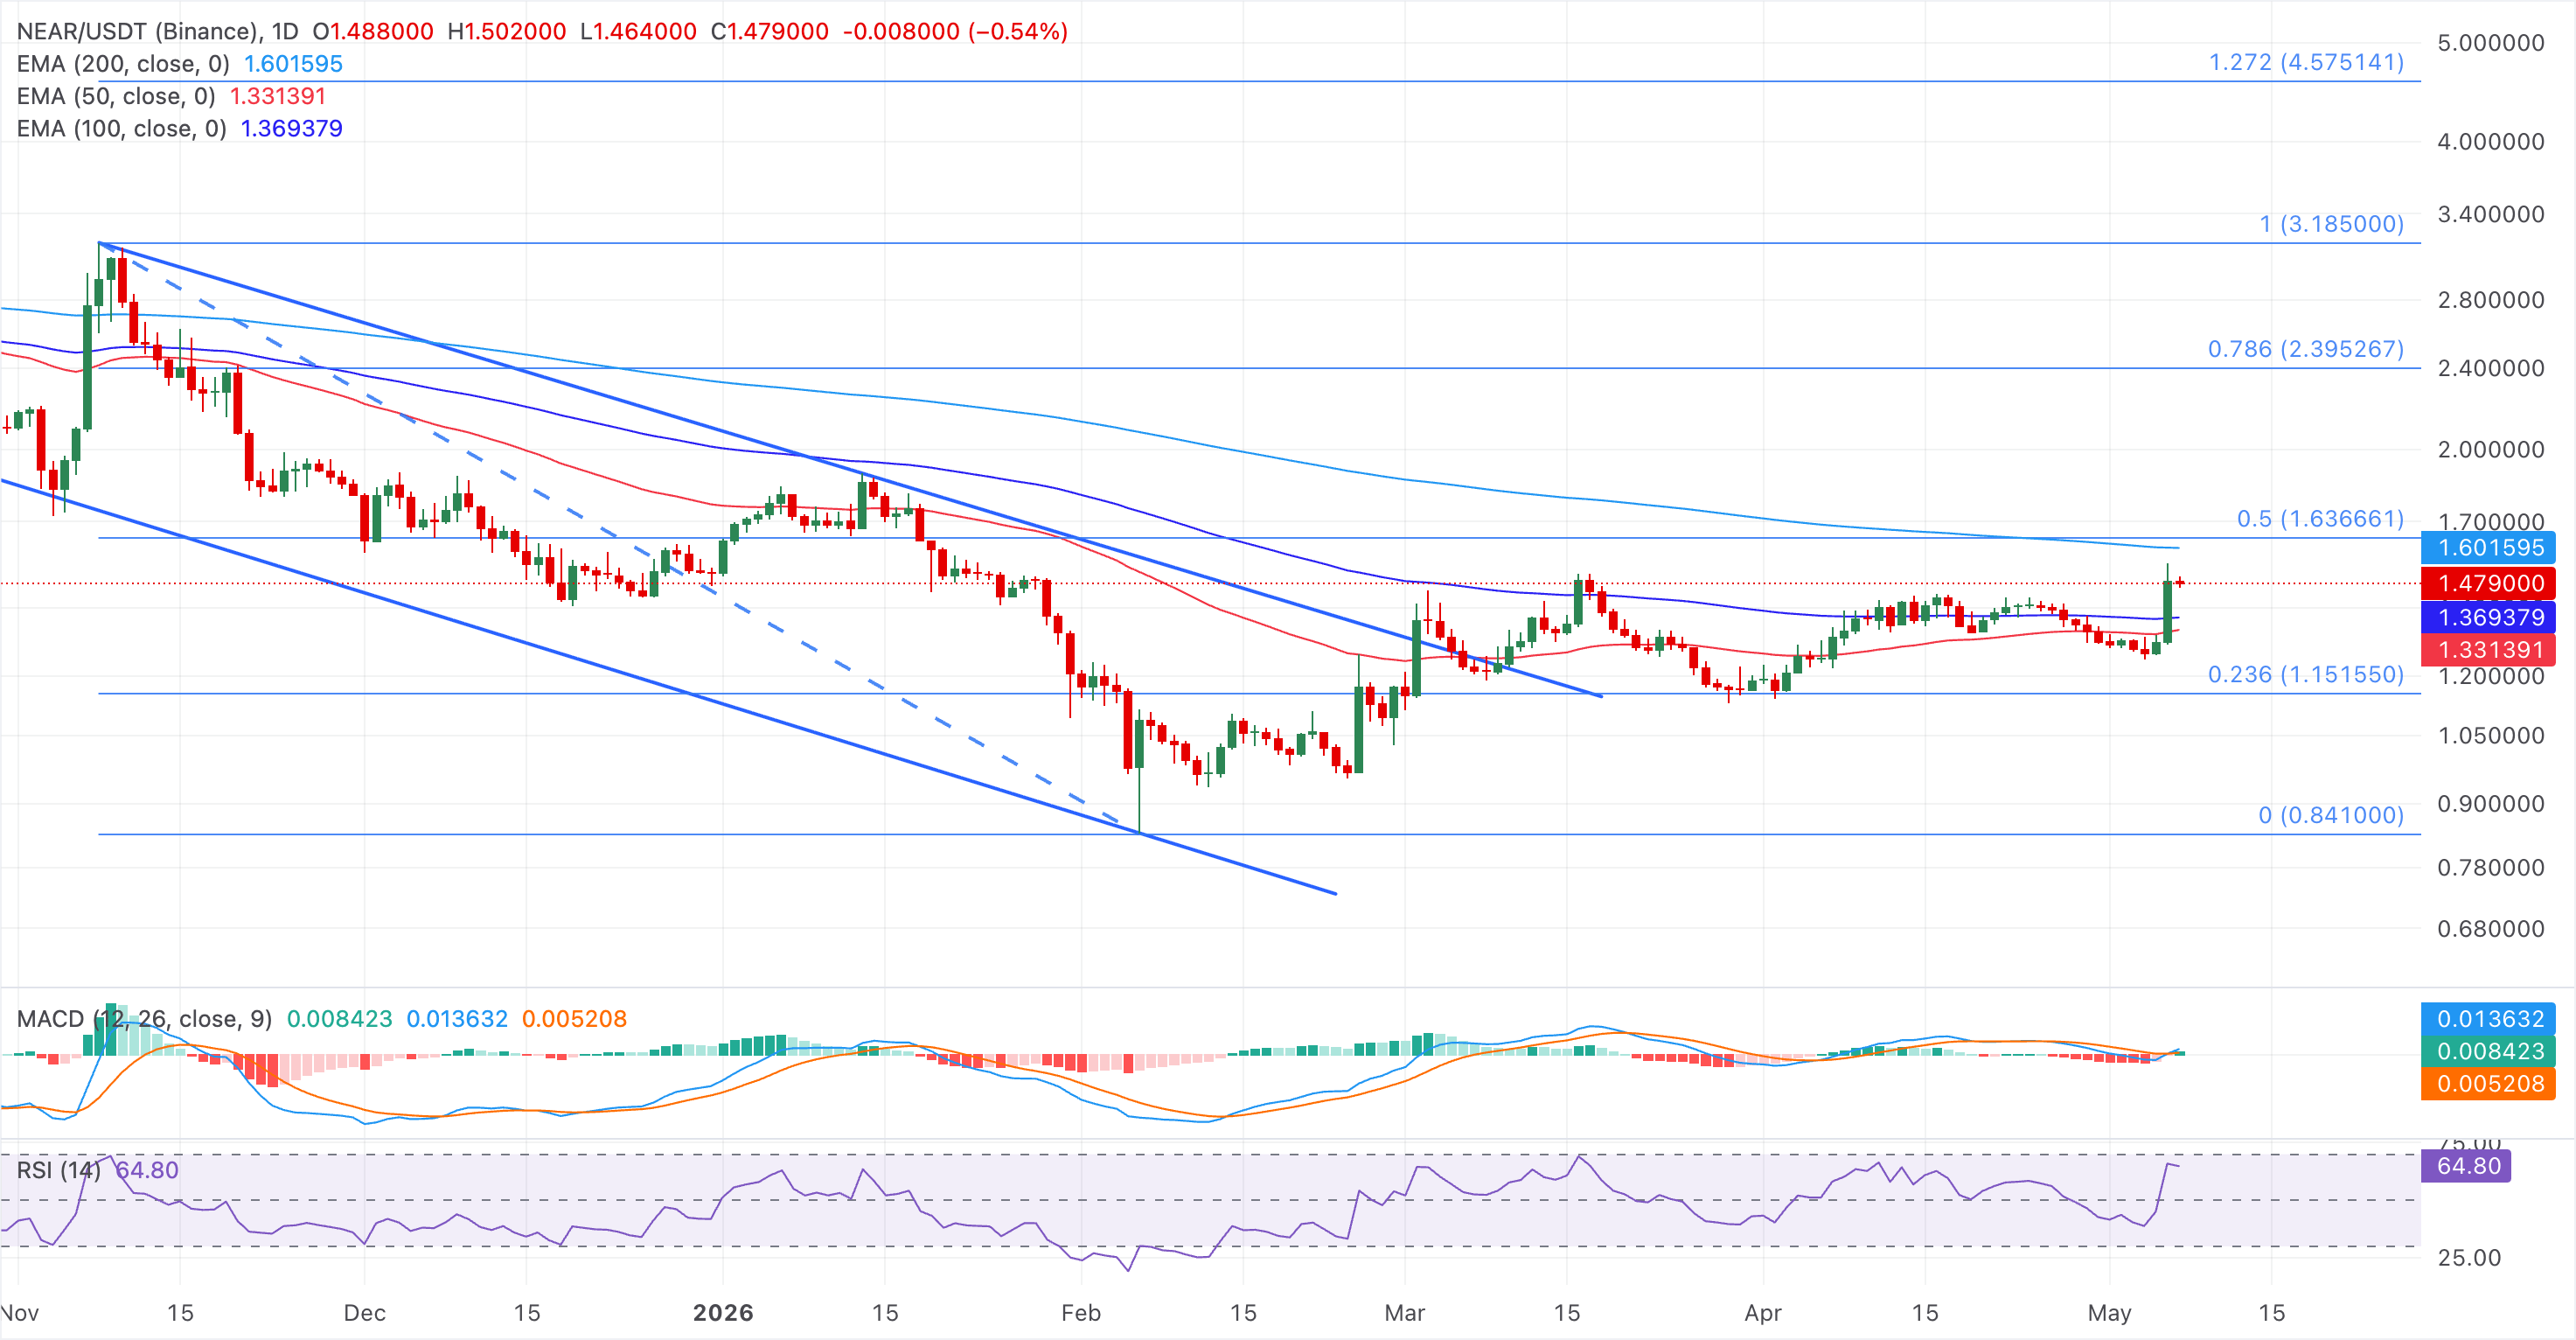
Looking down, initial support is seen at the 100- and 50-day EMAs at $1.3694 and $1.3314, respectively.
(The technical analysis of this story was written with the help of an AI tool.)

Hơn một triệu người dùng dựa vào FXStreet để có dữ liệu thị trường thời gian thực, công cụ biểu đồ, góc nhìn chuyên gia và tin tức Forex. Lịch kinh tế toàn diện và các hội thảo web giáo dục giúp nhà giao dịch luôn cập nhật và đưa ra quyết định có tính toán. FXStreet có khoảng 60 nhân sự, chia giữa trụ sở Barcelona và nhiều khu vực toàn cầu.
Đọc thêm


