
Crypto Overview: Bitcoin tops $71,000 on US-Iran ceasefire – Zcash, LayerZero, Bitcoin SV lead rally
Bởi Vishal Dixit
Đã cập nhật: 8 Apr 2026


BÀI VIẾT PHỔ BIẾN

Bitcoin (BTC) resurfaces above $71,000 at press time on Wednesday, on easing tensions in the Middle East with the US-Iran ceasefire. The broader crypto market witnesses a renewed risk-on sentiment, wiping out over $400 million in short positions.
- Bitcoin held above $71,000 on Wednesday, after a 4% rise the previous day.
- The two-week ceasefire announcement between the US and Iran has eased downside pressure across markets.
- Zcash, LayerZero, and Bitcoin SV lead the rally over the last 24 hours with double-digit gains.
Bitcoin (BTC) resurfaces above $71,000 at press time on Wednesday, on easing tensions in the Middle East with the US-Iran ceasefire. The broader crypto market witnesses a renewed risk-on sentiment, wiping out over $400 million in short positions. Meanwhile, Zcash (ZEC), LayerZero (ZRO), and Bitcoin SV (BSV) have posted double-digit gains over the last 24 hours.
Crypto market recovers on the US-Iran ceasefire
The broader cryptocurrency market gains strength overnight as the high-stakes 48-hour deadline imposed by US President Donald Trump on Iran evolved into a two-week ceasefire, with the immediate reopening of the Strait of Hormuz under military management.
Further negotiations to finalize the peace deal will begin on Friday in Islamabad, Pakistan. According to an Iranian official, the 10-point proposal includes reopening the Strait of Hormuz under Iranian military oversight, while talks with the US do not mean the end of the war, and the final details of the 10-point plan will determine the war's ultimate outcome, as previously reported by FXStreet.
According to CoinGlass, total market liquidations over the last 24 hours reached $596 million, led by $430 million in short liquidations, reflecting the market's bearish wipeout.
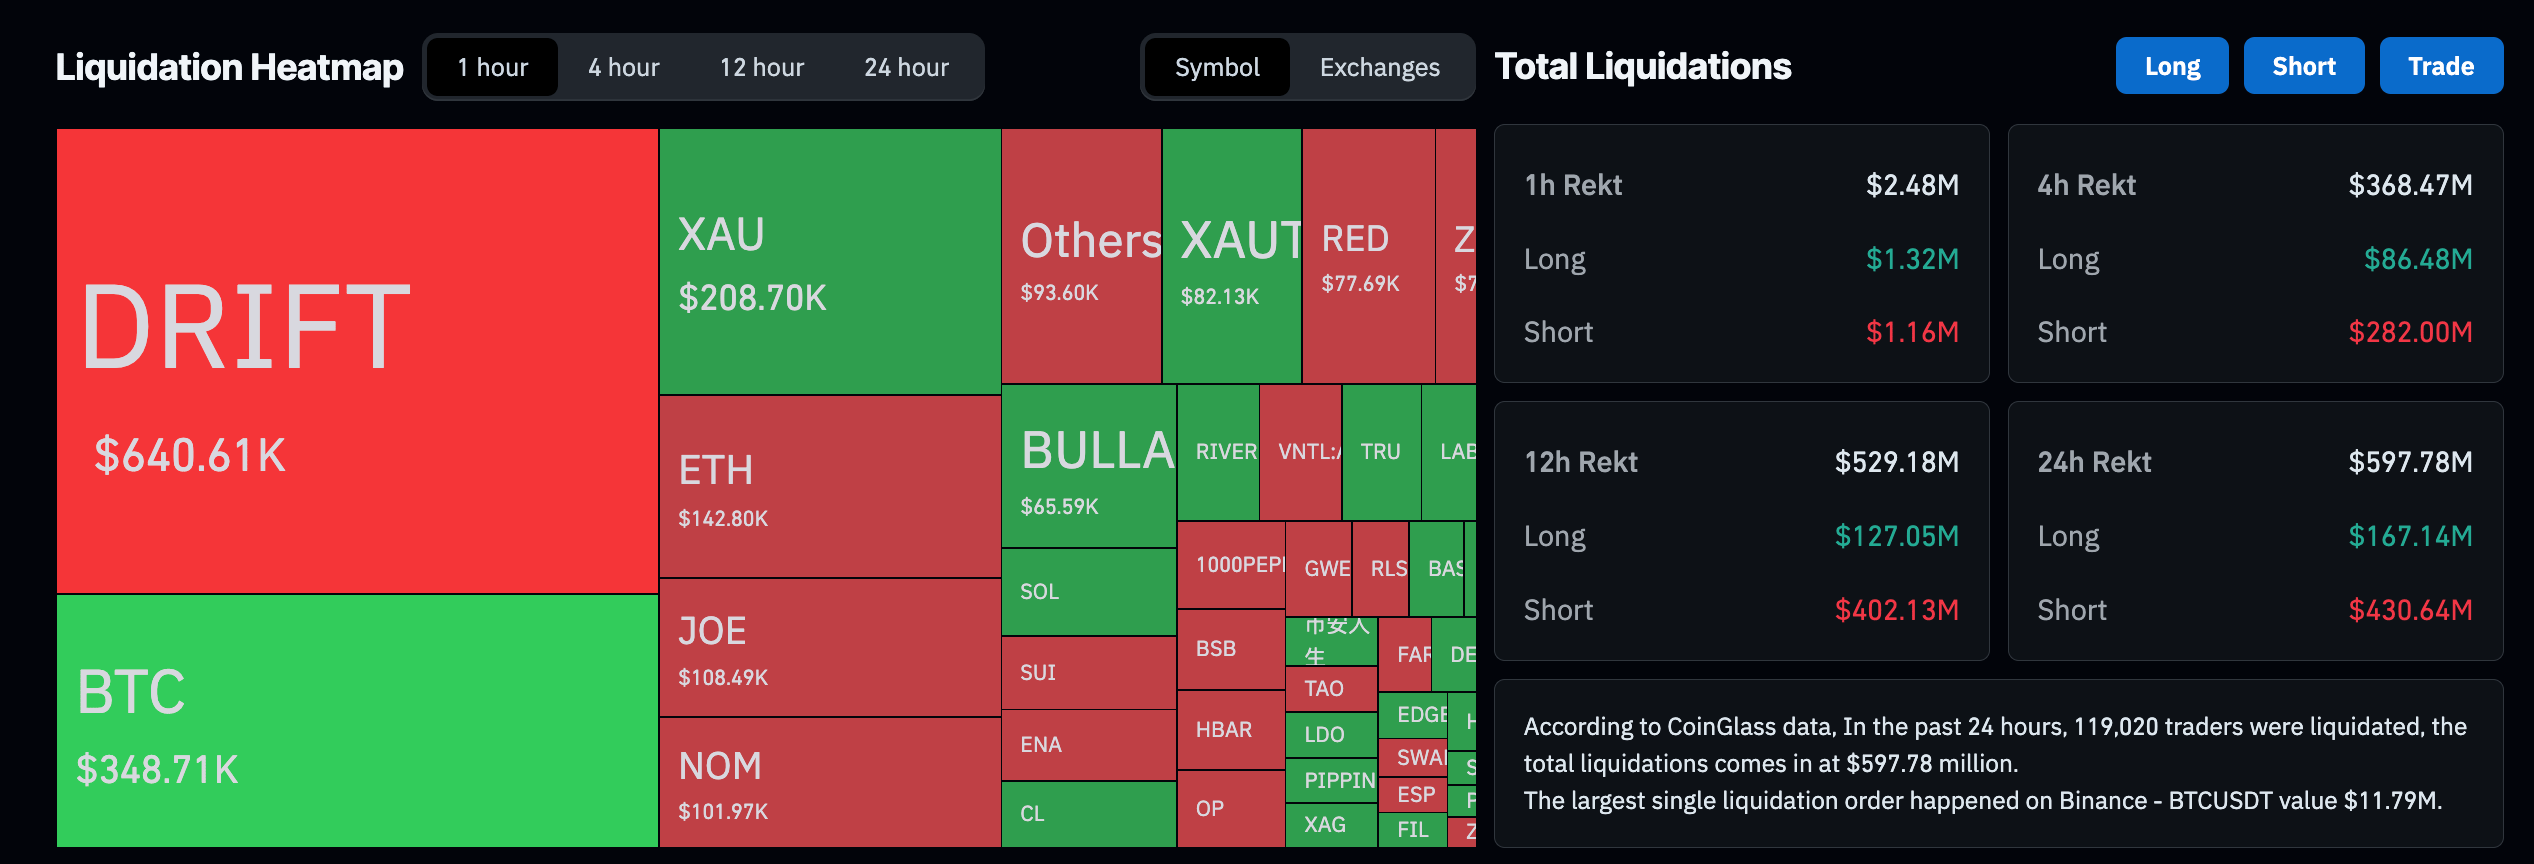
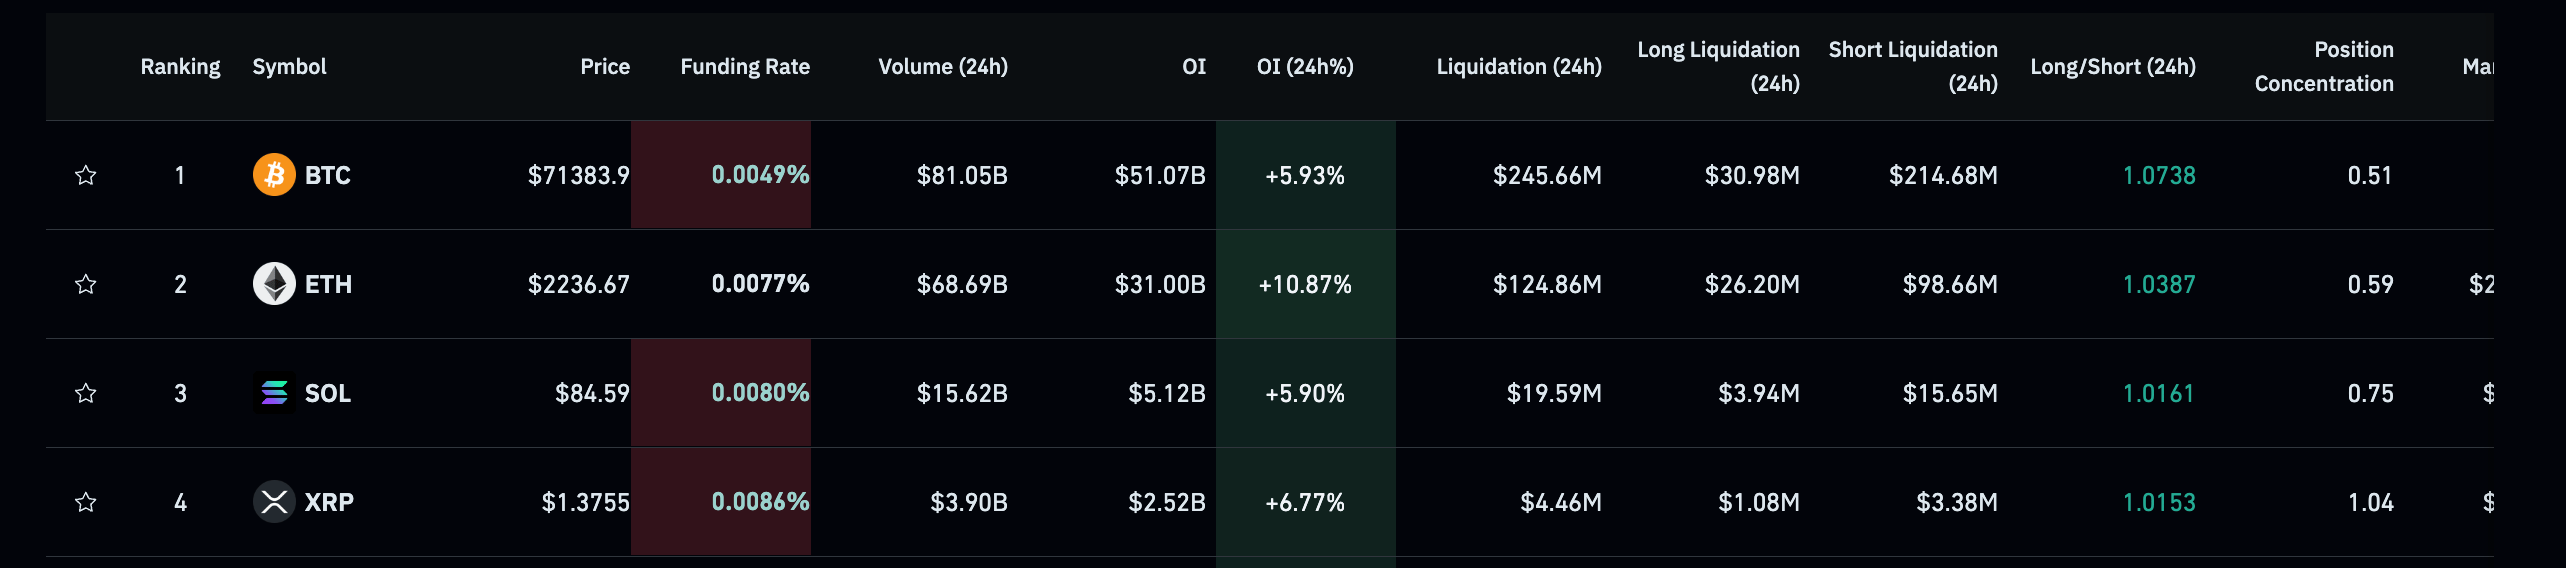
At the same time, the futures Open Interest of Bitcoin, Ethereum, Solana, and XRP surged by 5% to 10%, with the long-to-short ratio crossing above 1, indicating a greater number of active long positions.
Technical outlook: Zcash, LayerZero, and Bitcoin SV lead the way
Zcash extends gains above $300 at press time on Wednesday after a 27% surge the previous day. The near-term bias turns bullish after price has surged through the confluence of the 100-day and 200-day Exponential Moving Averages (EMAs), leaving both gauges well below the market and reinforcing an emerging uptrend.
Momentum confirms the shift, with the Moving Average Convergence Divergence (MACD) indicator now firmly positive and its line extending above the signal line, while the Relative Strength Index holds near 71, signaling strong upside pressure despite entering overbought territory.
The privacy coin's recovery approaches the February 14 high at $333, which serves as immediate resistance. A decisive close above this level could pave the path toward the $400 round figure.
Looking down, the 200-day EMA at $278, close to the 100-day EMA at $273, remains a crucial support zone.
On the other hand, LayerZero reclaimed $2.00 with a roughly 18% jump on Tuesday. At the time of writing, ZRO hovers above $2.00 on Wednesday, holding the previous day's gains. The near-term bias is cautiously bullish, as price holds above the rising 50-, 100-, and 200-day EMAs.
Momentum improves after a recent pullback, with the MACD lifting back toward the signal line, hinting that selling pressure is fading. The RSI at 55, consistent with recovering bullish momentum rather than overbought conditions.
On the topside, immediate resistance stands around $2.59, last tested on February 11.
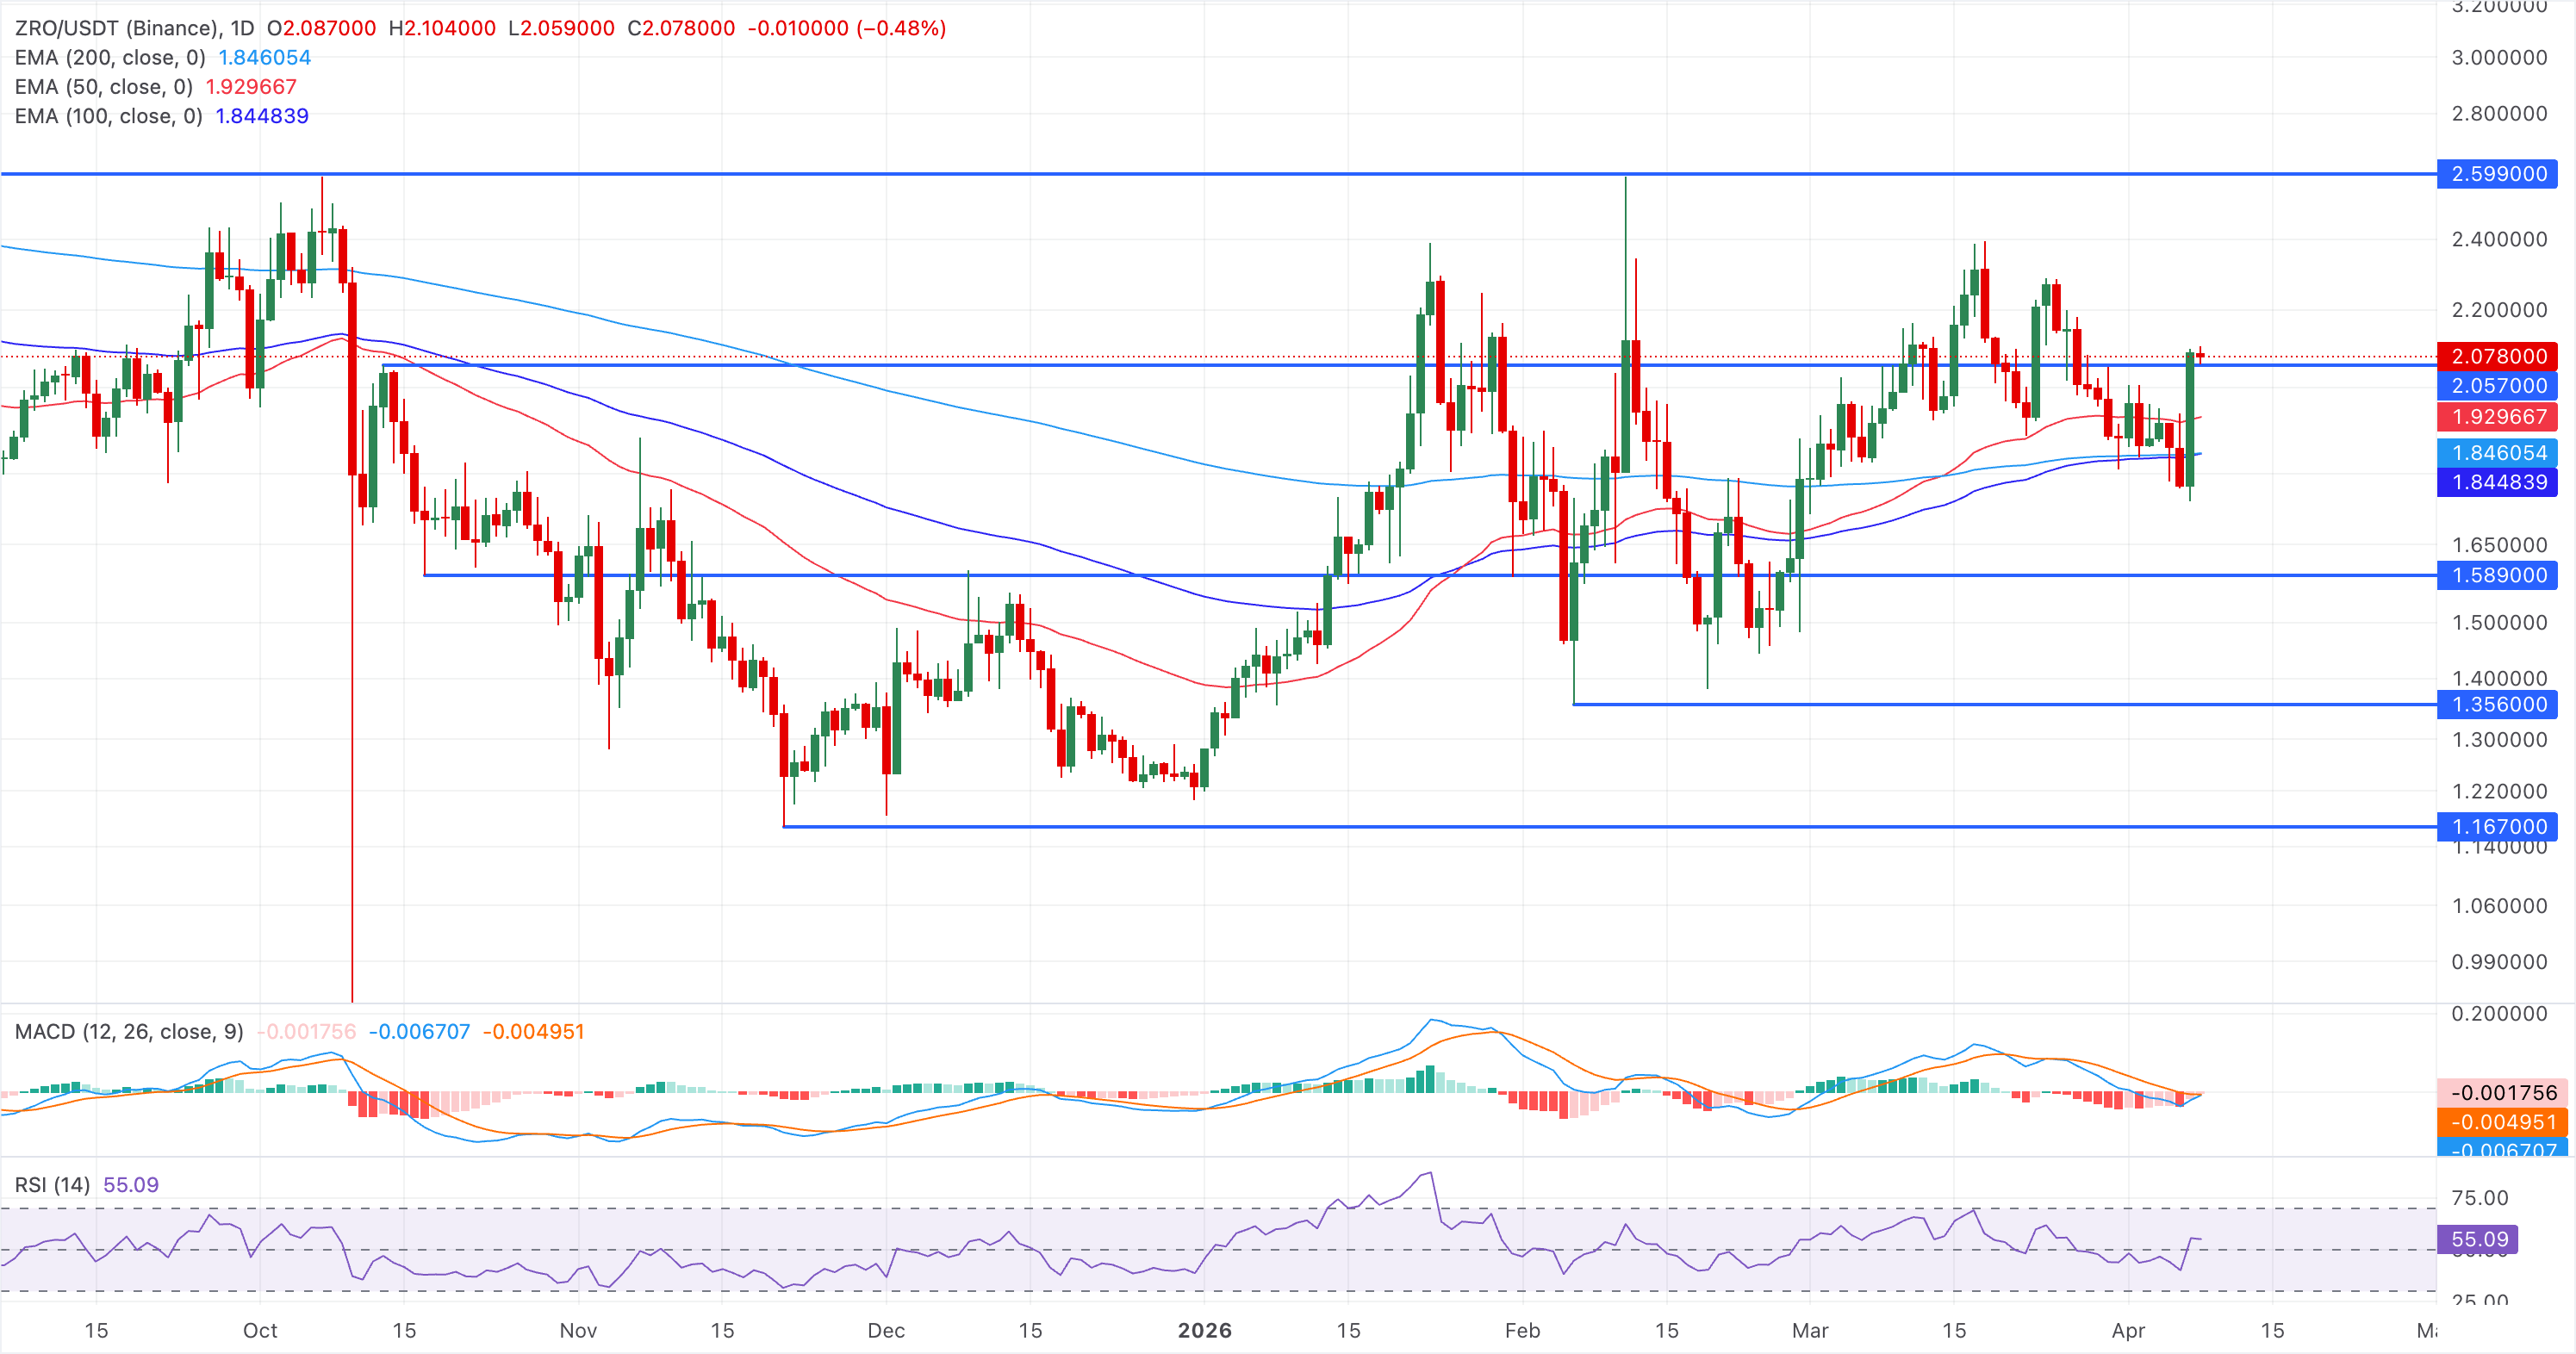
If ZRO drops below $2.00, the 50-day EMA at $1.92 provides immediate support.
Bitcoin SV is trading above $17 at press time on Wednesday, after breaking above the descending resistance trend line near $16.90 and the 100-day EMA the previous day.
The MACD line holds above its signal and the zero line, with a positive, expanding histogram, pointing to strengthening upside momentum, while the Relative Strength Index around 66 stays below overbought territory, reinforcing ongoing buying pressure.
On the upside, another daily close would reinforce the breakout rally and could extend the rally toward the 200-day EMA at $19.38.
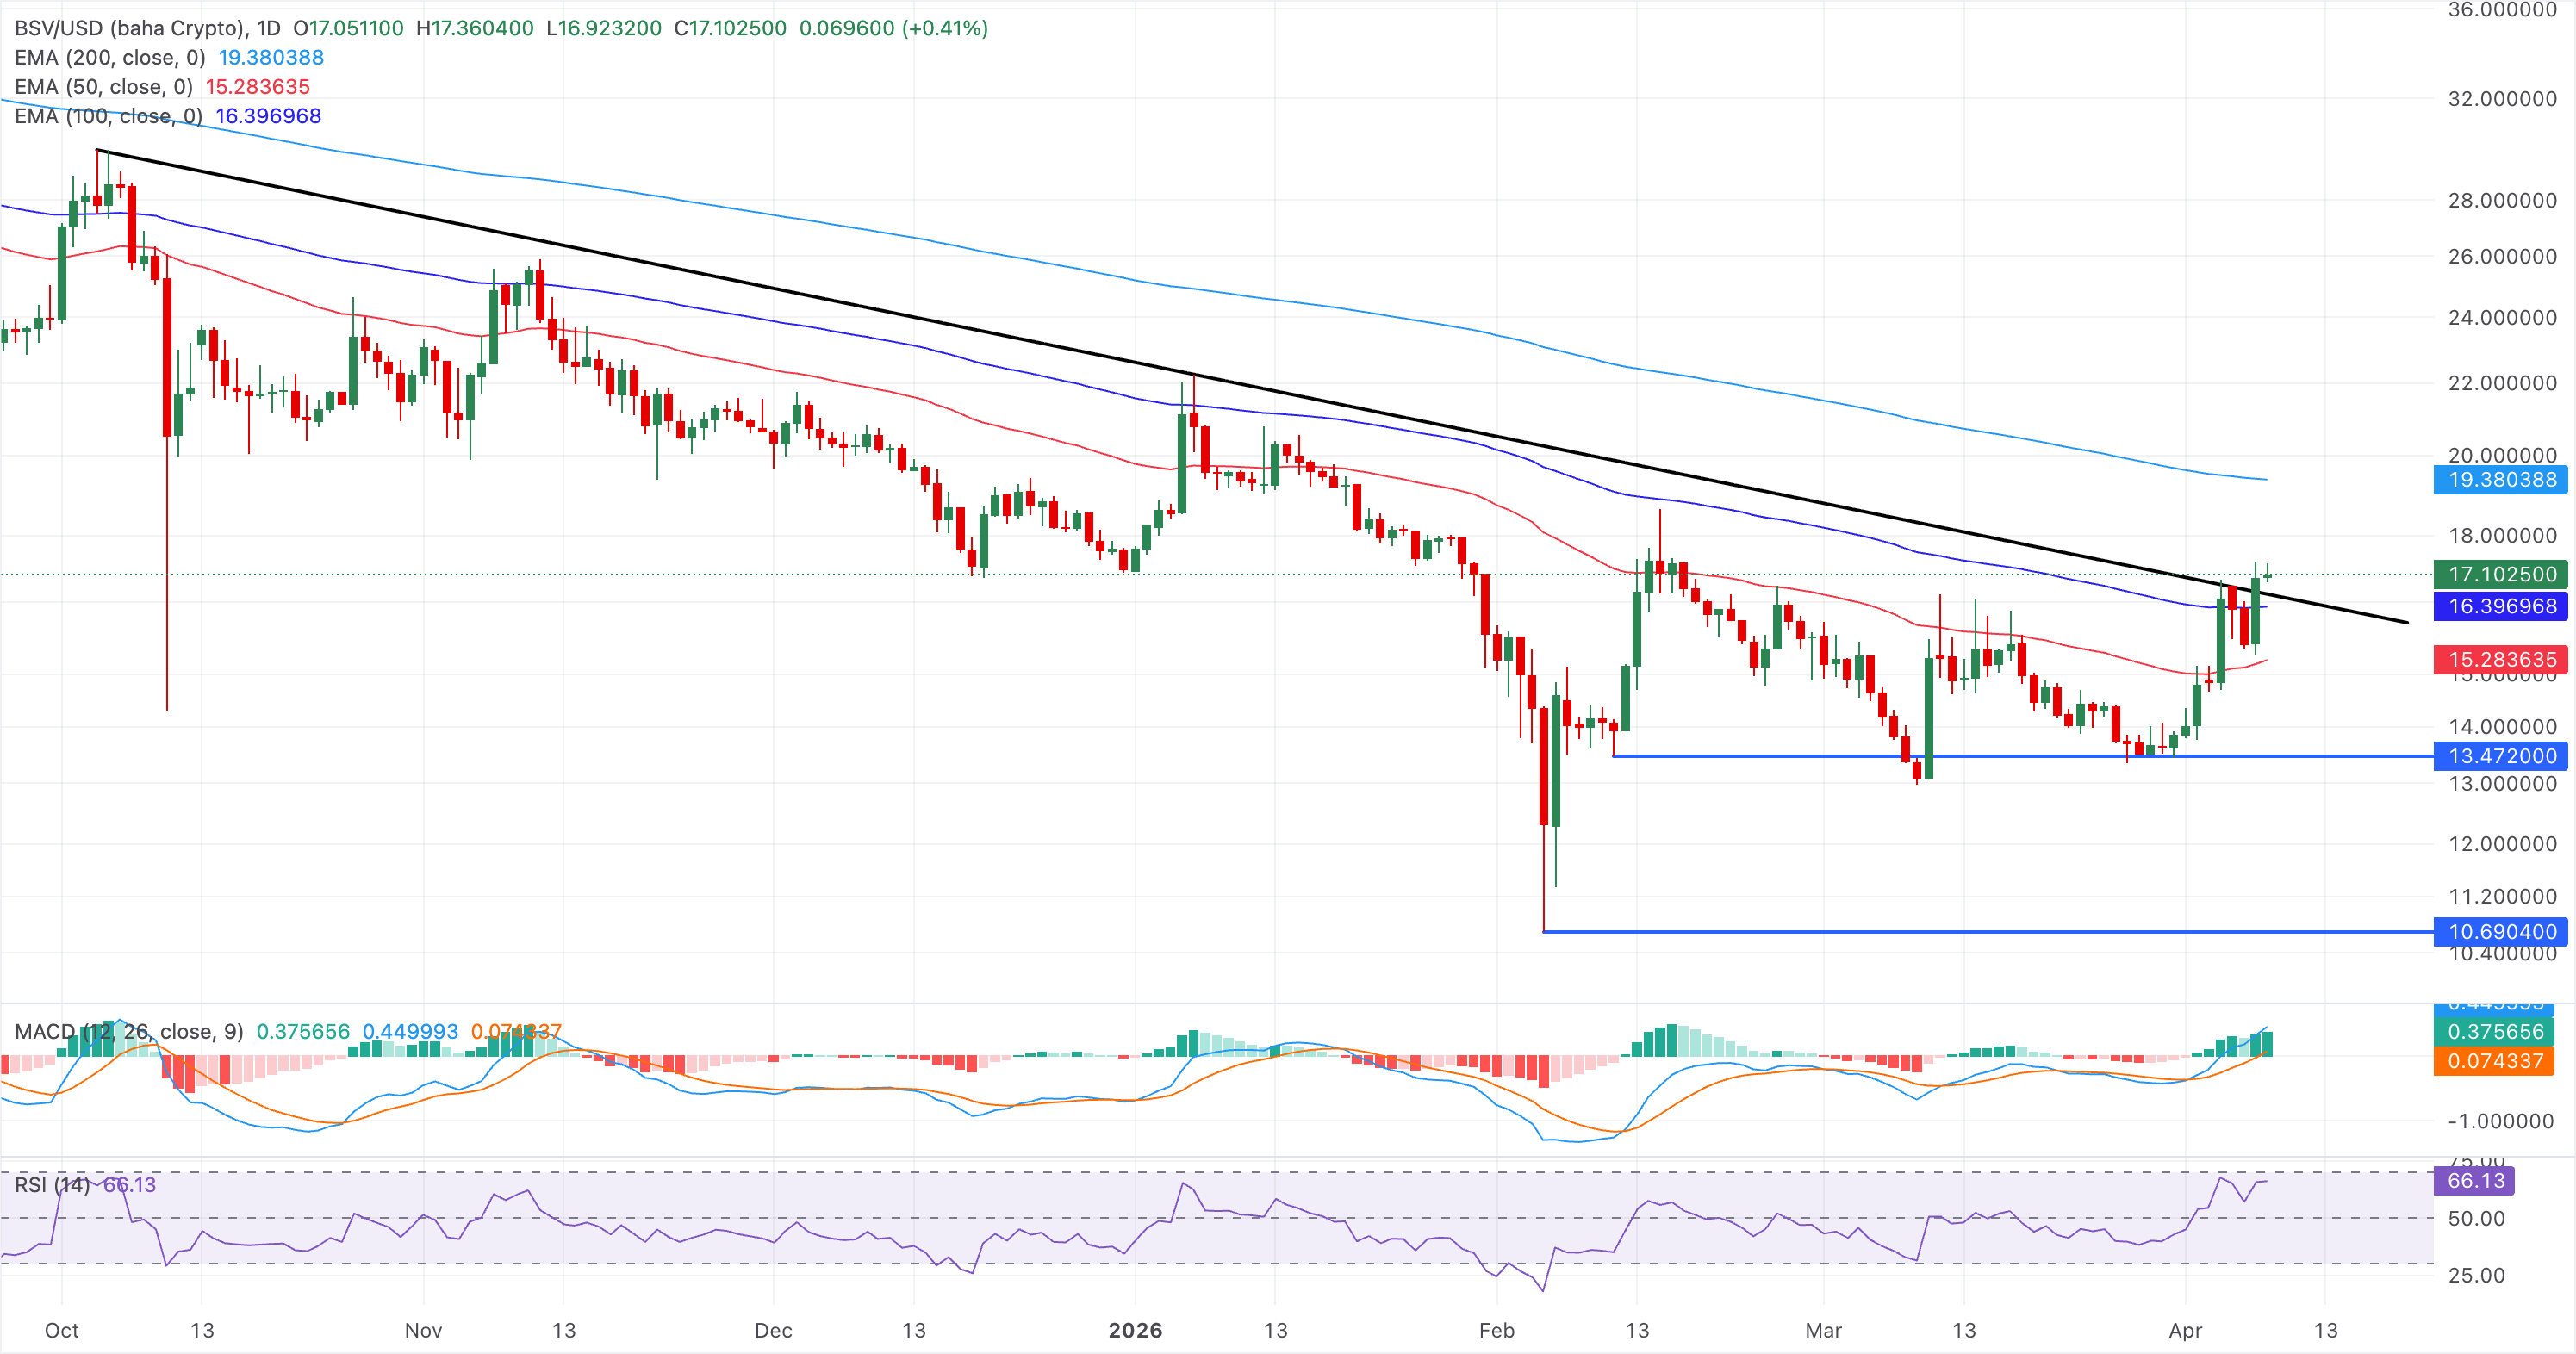
Initial support emerges at the broken trend-line area near $16.90, followed by the 50-day EMA around $15.30 if a deeper pullback unfolds.
(The technical analysis of this story was written with the help of an AI tool.)

Hơn một triệu người dùng dựa vào FXStreet để có dữ liệu thị trường thời gian thực, công cụ biểu đồ, góc nhìn chuyên gia và tin tức Forex. Lịch kinh tế toàn diện và các hội thảo web giáo dục giúp nhà giao dịch luôn cập nhật và đưa ra quyết định có tính toán. FXStreet có khoảng 60 nhân sự, chia giữa trụ sở Barcelona và nhiều khu vực toàn cầu.
Đọc thêm


