
Crypto Today: Bitcoin, Ethereum, XRP risk extending decline as ETF outflows persist
Bởi John Isige
Đã cập nhật: 27 Mar 2026


BÀI VIẾT PHỔ BIẾN

The cryptocurrency market is extending its broad correction on Friday, with Bitcoin (BTC) sliding below $68,000, weighed down by risk-off sentiment and volatility amid the war in the Middle East.
- Bitcoin slides for the second consecutive day as risk-off sentiment and ETF outflows weigh.
- Ethereum struggles to retain $2,000 as immediate support amid a deteriorating technical structure.
- XRP tests the lower end of a narrow range despite a mildly improving retail risk appetite, with futures Open Interest at $2.65 billion.
The cryptocurrency market is extending its broad correction on Friday, with Bitcoin (BTC) sliding below $68,000, weighed down by risk-off sentiment and volatility amid the war in the Middle East.
Altcoins, including Ethereum (ETH) and Ripple (XRP), are falling alongside Bitcoin, reflecting a lack of investor confidence in the crypto market. The largest smart contract token, ETH, is hovering above $2,000 but remains in a defined wider bearish trend, while the remittance token, XRP, has slipped below the weekly open of $1.38 to trade around $1.35.
Bitcoin, Ethereum, XRP under pressure as demand fades
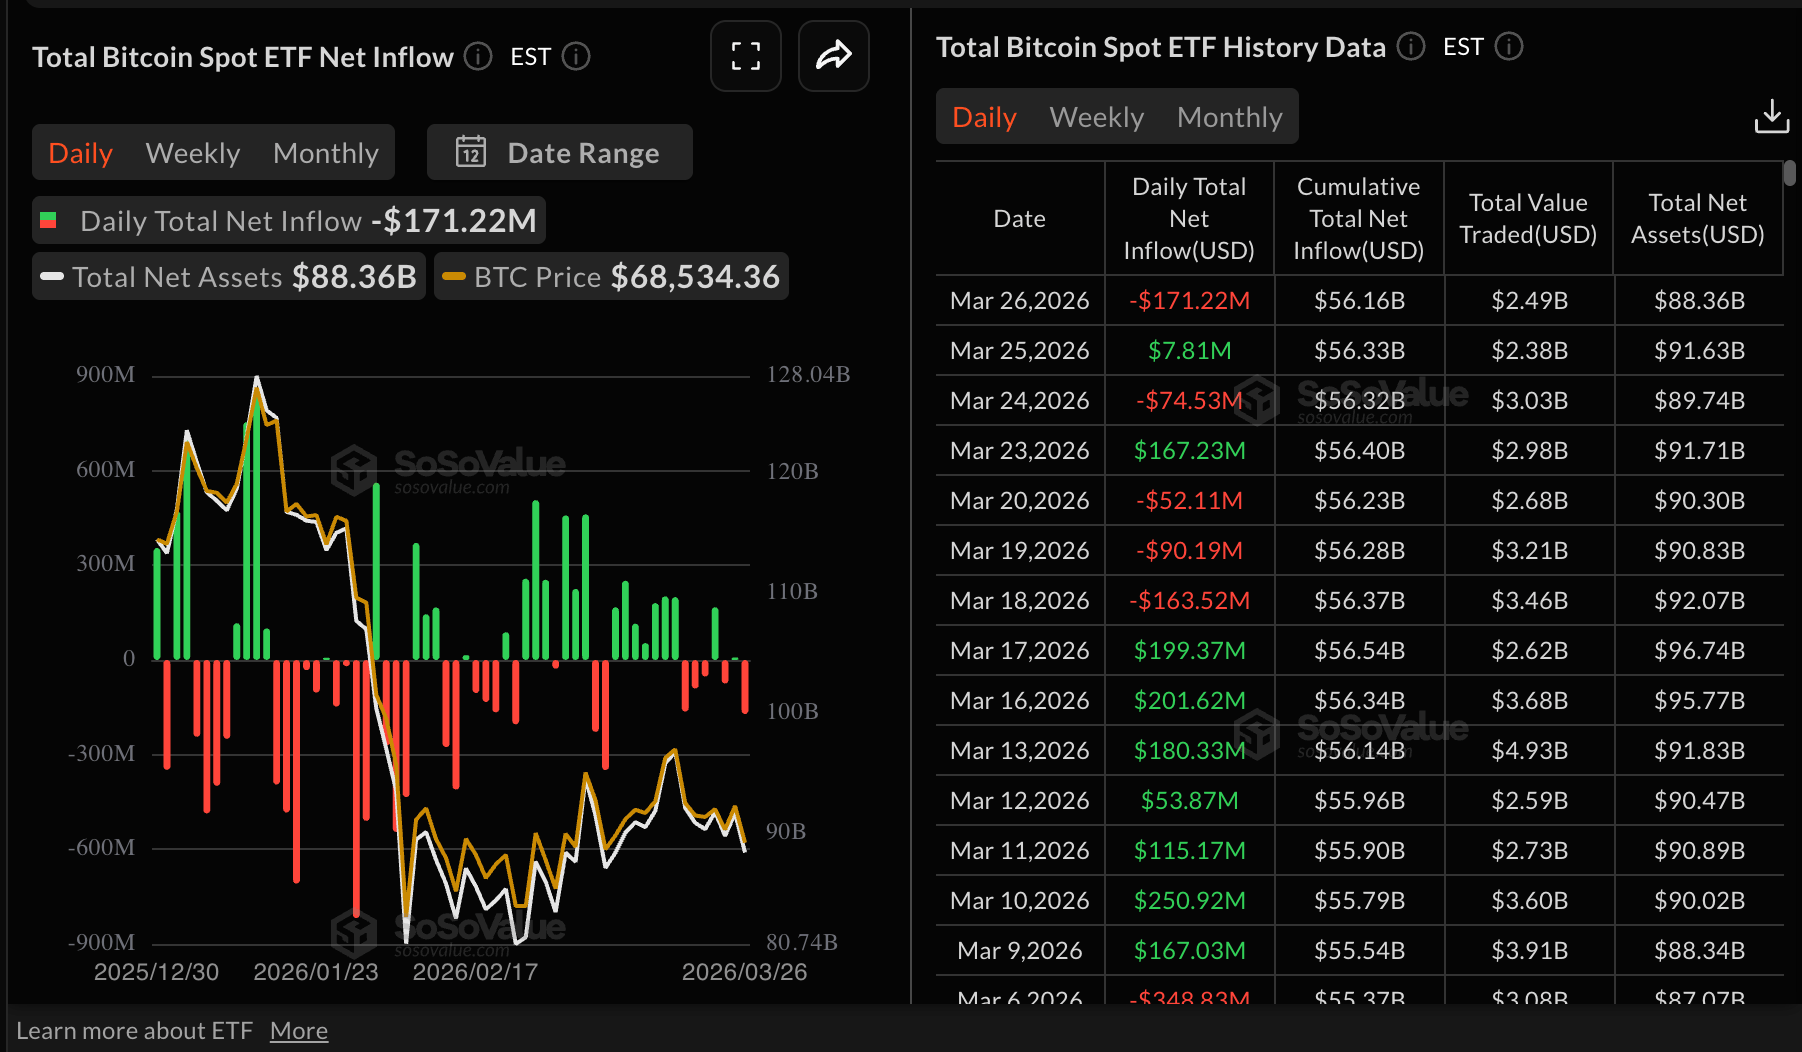
Bitcoin is facing notable cooling in institutional interest, as outflows totalling $171 million from spot Exchange-Traded Funds (ETFs) on Thursday underscored the trend. Risk appetite has remained wobbly in 2026 amid a deteriorating macroeconomic outlook, with risk-off sentiment persisting.
Earlier this month, the Federal Reserve (Fed) took a hawkish stance on interest rate cuts due to the Iran war. Investors are now pricing in a high probability that rates will remain unchanged for much longer in 2026, a significant shift from an earlier projection of at least two rate cuts.
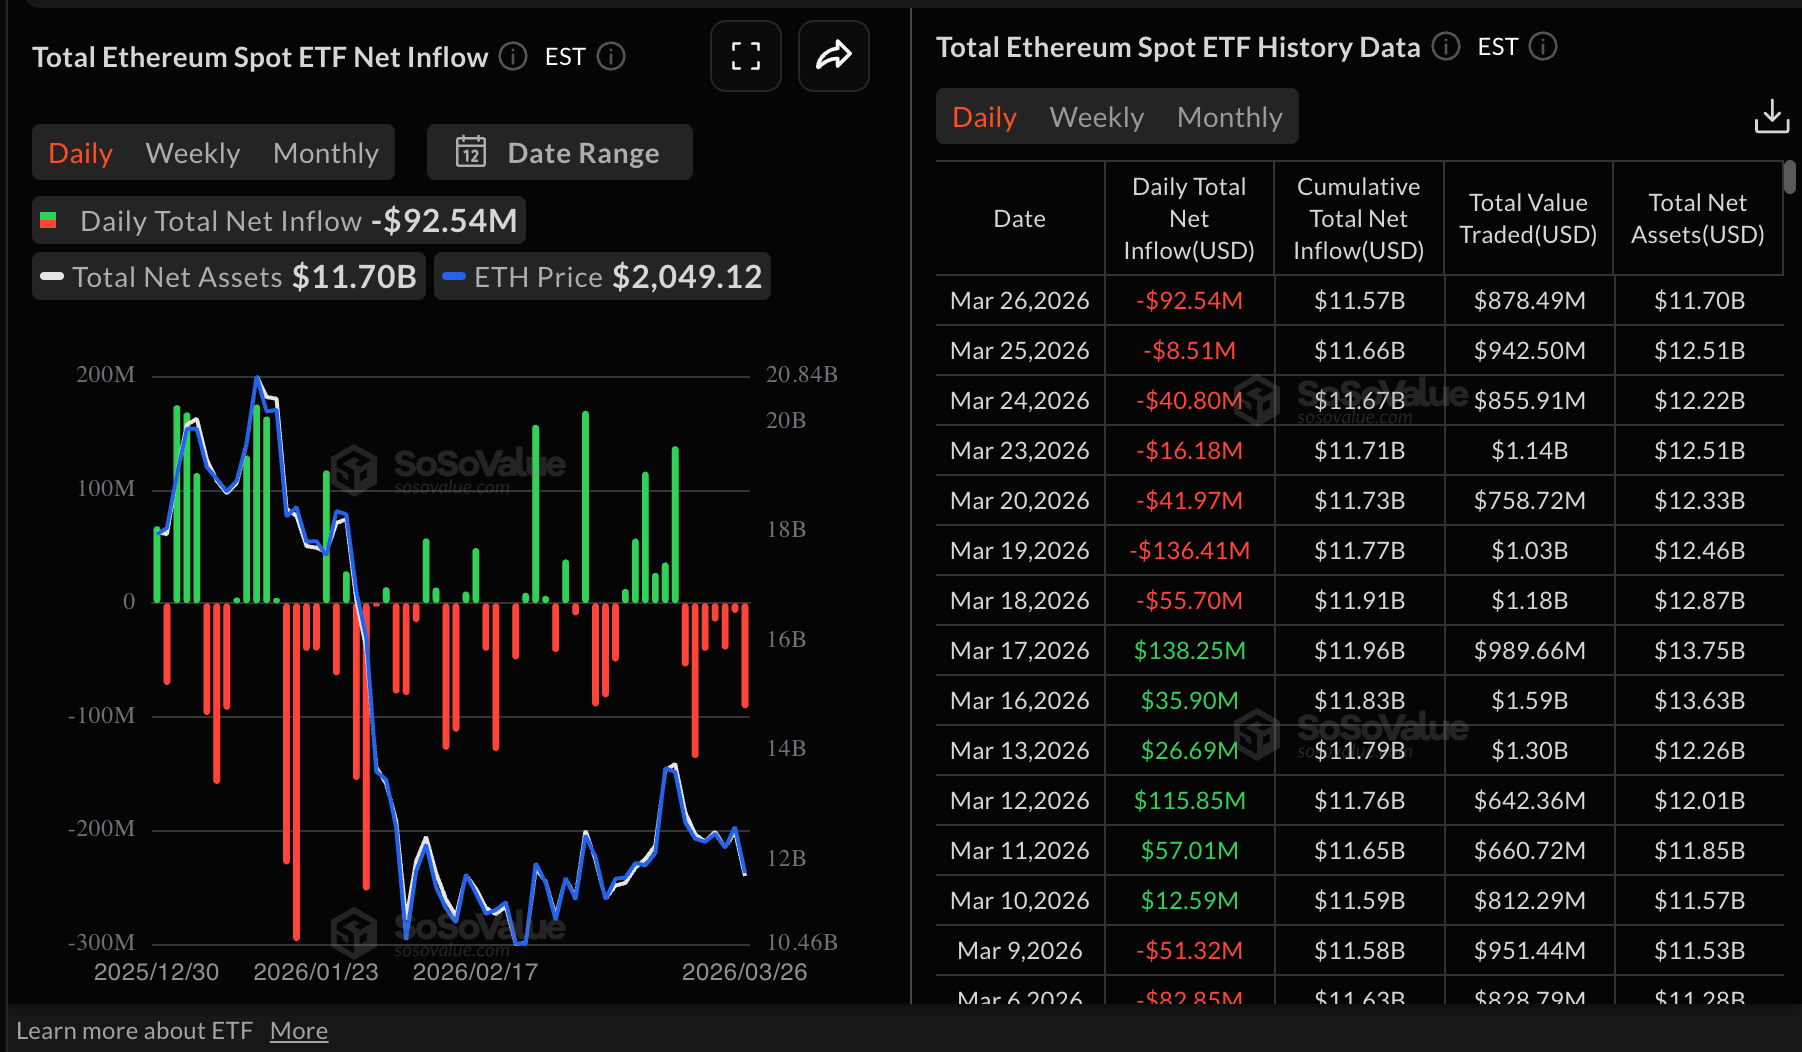
As for Ethereum, spot ETFs have extended the bearish streak for seven consecutive days, with outflows of nearly $93 million experienced on Thursday. Cumulative inflows now stand at $11.57 billion and net assets under management at $11.7 billion amid the persistent risk-off sentiment. If the bearish outlook continues, it will dampen sentiment further and reduce demand for ETH digital investment products.
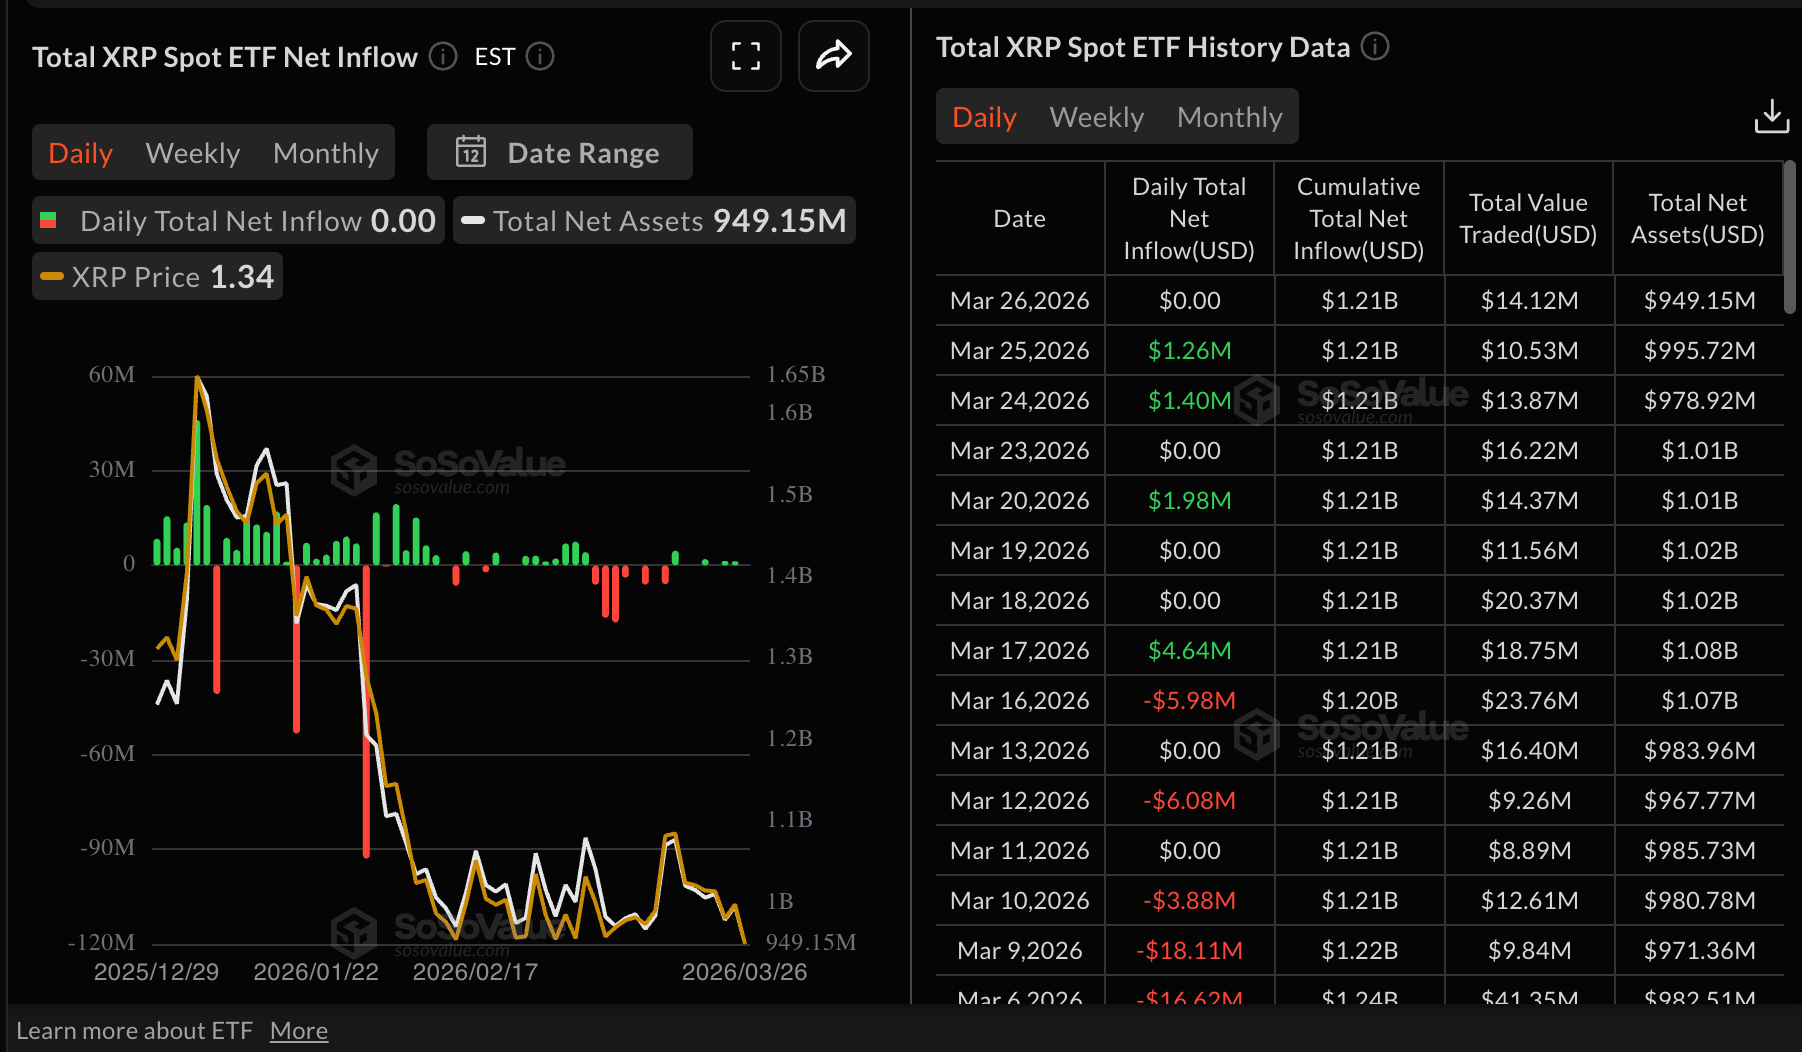
Meanwhile, interest in XRP spot ETFs remains low as the products closed Thursday with zero flows. Cumulative inflows currently average $1.21 billion, with net assets under management averaging $949 million.
The XRP derivatives market paints a slightly positive outlook, with futures Open Interest (OI) increasing to $2.65 billion on Friday, up from $2.53 billion the previous day. CoinGlass data shows that the OI has steadily grown from $2.33 billion on Monday, affirming that risk appetite is improving in the retail market. A steady increase in OI would support XRP’s recovery potential.
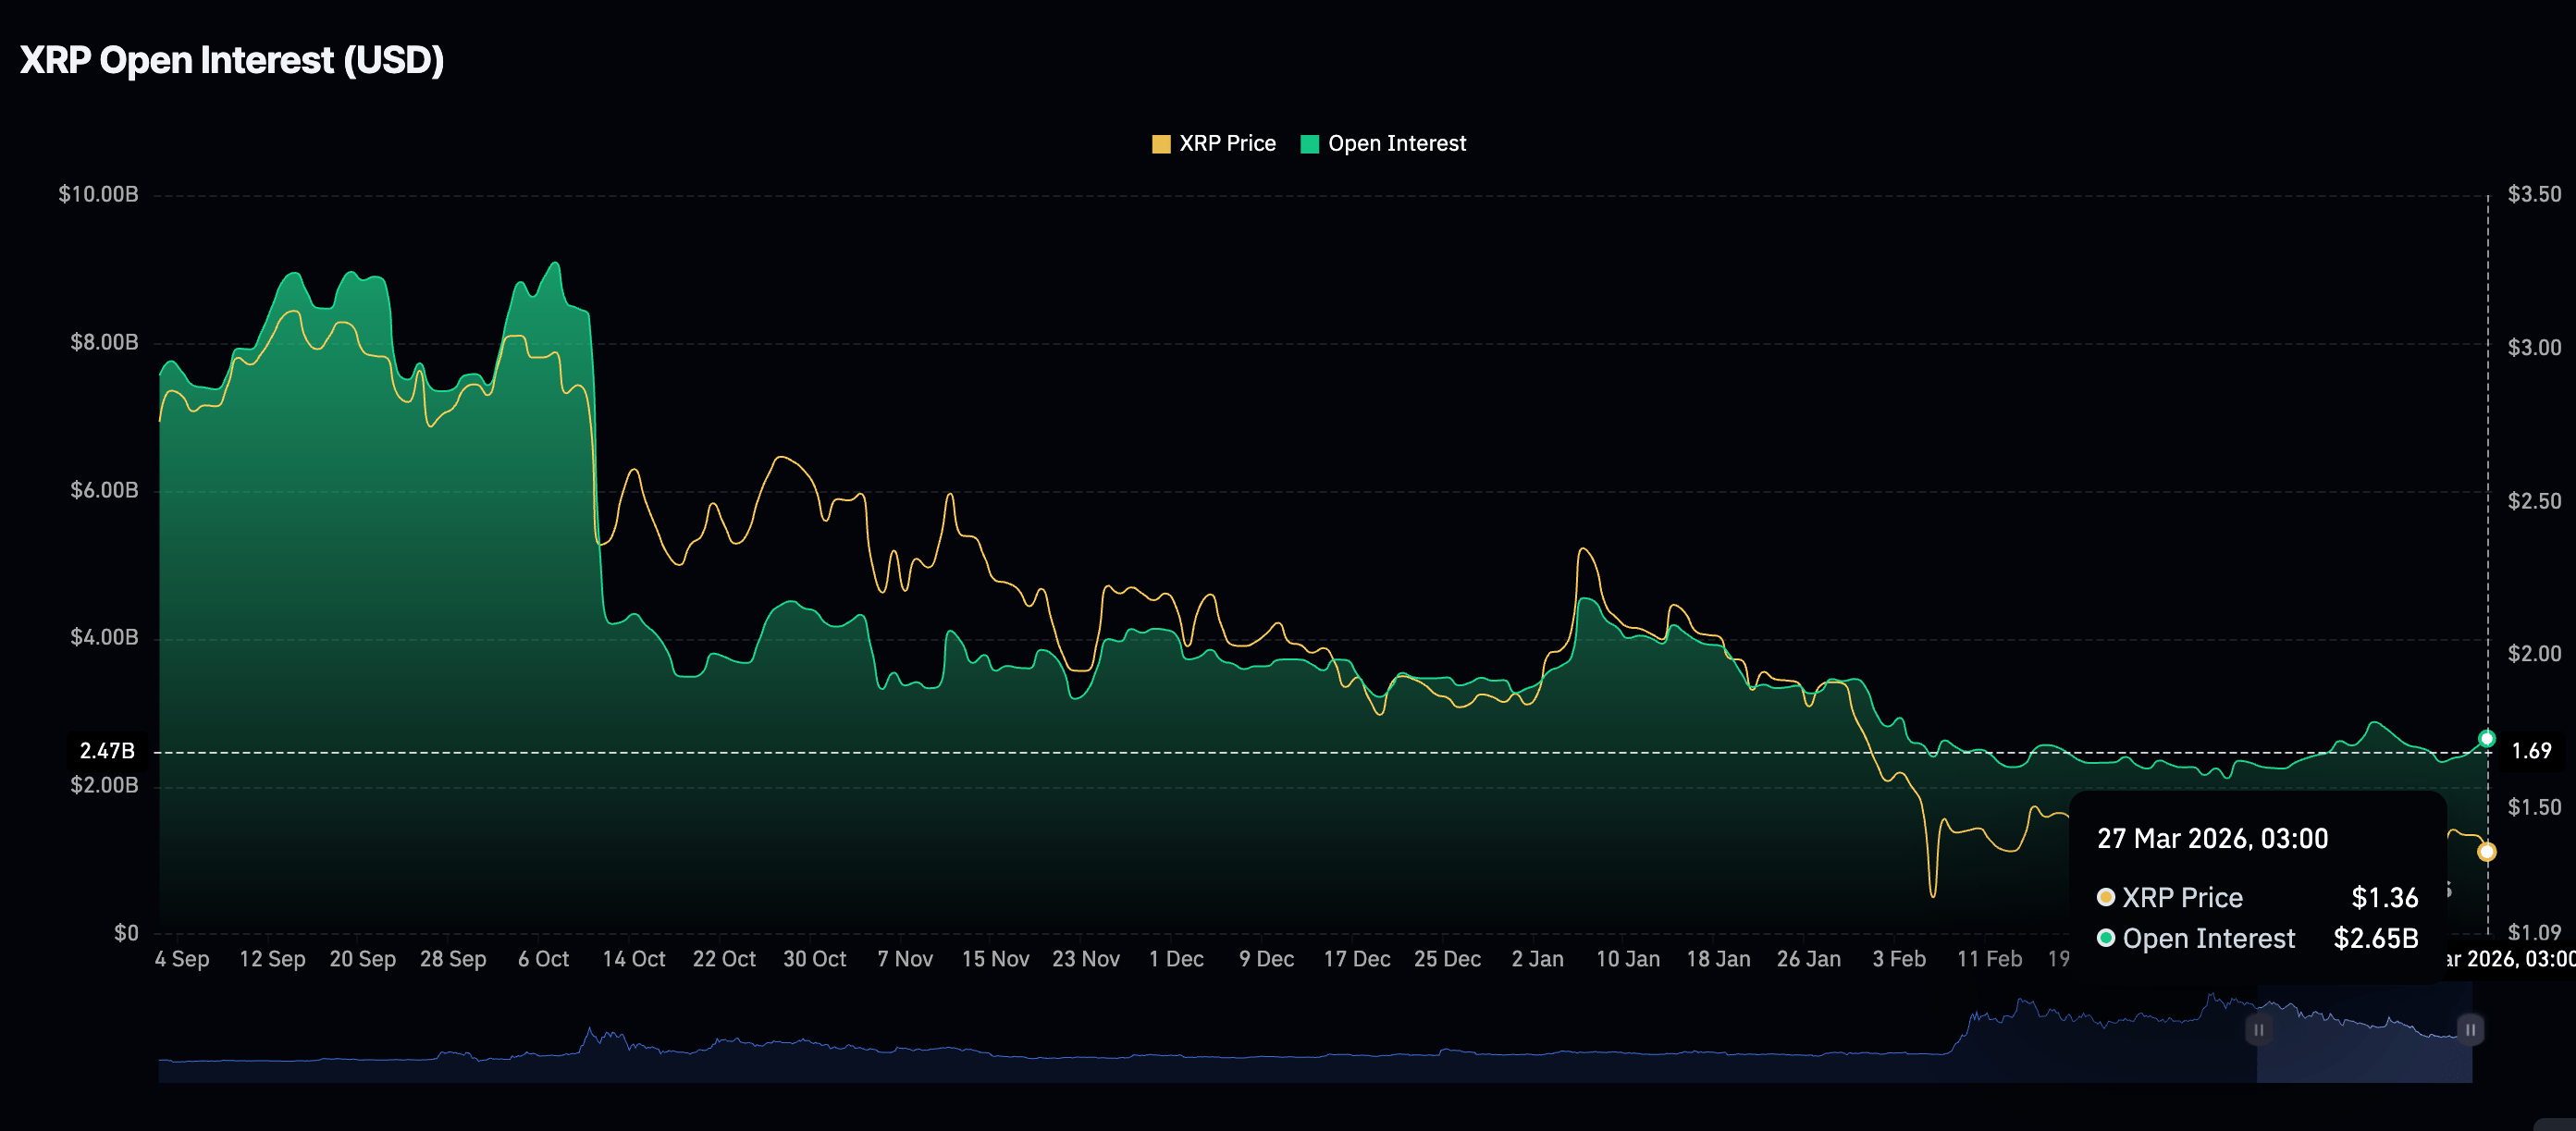
Chart of the day: Bitcoin falls as technicals weaken
Bitcoin is edging lower below $68,000 at the time of writing on Friday. Its near-term bias remains neutral-to-bearish, with a downside tilt as price oscillates below the clustered 50-day, 100-day and 200-day Exponential Moving Averages (EMAs), which all sit well above spot and frame an overarching corrective outlook.
The Moving Average Convergence Divergence (MACD) indicator has slipped below its signal line on the daily chart, as red histogram bars are expanding, suggesting sellers retain modest momentum after BTC failed to sustain above the $70,000 threshold. At the same time, the Relative Strength Index (RSI) around 45 reinforces this view of fading upside pressure without reaching oversold conditions, consistent with a consolidative phase rather than a strong bearish trend.
-1774604929198-1774604929199.png)
Initial resistance lies around the $70,000 pivotal level, with a break above it exposing the 50-day EMA at $71,897, where prior peaks converge with the descending short-term average cluster. On the downside, immediate support is seen around $67,500, the latest closing low before the current bounce, followed by $65,000, where prior reaction lows and the lower end of the recent range converge. A daily close below $65,000 would open the door to a deeper retracement toward the yearly low of $60,000.
Altcoins technical outlook: Ethereum and XRP sellers tighten grip
Ethereum is under pressure, trading toward support at $2,000. Near-term bias is cautiously bearish as price holds below the rising trendline, which remains unbroken. The 50-day EMA near $2,185 and the 100-day EMA around $2,443 both cap Ethereum's upside, framing the token within a broader corrective trend.
Moreover, the MACD indicator has slipped below the signal line on the daily chart, with the red histogram bars expanding, suggesting fading bullish momentum and reinforcing the downside skew. The RSI at 46 stays below the 50 midline on the same chart, consistent with mild selling pressure rather than capitulation.
-1774605179033-1774605179043.png)
Immediate support lies near the recent low at $2,000, with a break exposing a deeper demand zone around $1,950 if sellers extend control. Below that, the region at $1,800 comes into view as the next downside level where prior reaction lows cluster. On the topside, Ethereum faces resistance at the 50-day EMA around $2,185, which would need to be reclaimed on a daily close to ease the current pressure.
As for XRP, a near-term bias remains mildly bearish as price extends its pullback to around $1.35, which is further below the 50-day, 100-day, and 200-day EMAs, keeping the broader trend scope bearish despite the earlier spike toward $1.61. The MACD indicator has slipped below the signal line on the daily chart as red histogram bars expand, reflecting fading upside momentum after the late advance and reinforcing downside pressure.
At the same time, the RSI hovers just above 40 on the same chart, indicating bearish momentum without oversold conditions and leaving room for further weakness if sellers retain control.
-1774605218324-1774605218336.png)
XRP's immediate support lies at $1.32, aligning with the March 8 low. A break below that demand would expose the next downside area near $1.30, ahead of stronger demand around $1.25. On the topside, initial resistance stands at $1.40, where the latest bounce stalled, followed by $1.45, which capped the price during mid-March. A daily close above $1.45 would ease the current bearish tone and open the way toward $1.54.
Crypto ETF FAQs
An Exchange-Traded Fund (ETF) is an investment vehicle or an index that tracks the price of an underlying asset. ETFs can not only track a single asset, but a group of assets and sectors. For example, a Bitcoin ETF tracks Bitcoin’s price. ETF is a tool used by investors to gain exposure to a certain asset.
Yes. The first Bitcoin futures ETF in the US was approved by the US Securities & Exchange Commission in October 2021. A total of seven Bitcoin futures ETFs have been approved, with more than 20 still waiting for the regulator’s permission. The SEC says that the cryptocurrency industry is new and subject to manipulation, which is why it has been delaying crypto-related futures ETFs for the last few years.
Yes. The SEC approved in January 2024 the listing and trading of several Bitcoin spot Exchange-Traded Funds, opening the door to institutional capital and mainstream investors to trade the main crypto currency. The decision was hailed by the industry as a game changer.
The main advantage of crypto ETFs is the possibility of gaining exposure to a cryptocurrency without ownership, reducing the risk and cost of holding the asset. Other pros are a lower learning curve and higher security for investors since ETFs take charge of securing the underlying asset holdings. As for the main drawbacks, the main one is that as an investor you can’t have direct ownership of the asset, or, as they say in crypto, “not your keys, not your coins.” Other disadvantages are higher costs associated with holding crypto since ETFs charge fees for active management. Finally, even though investing in ETFs reduces the risk of holding an asset, price swings in the underlying cryptocurrency are likely to be reflected in the investment vehicle too.
(The technical analysis of this story was written with the help of an AI tool.)

Hơn một triệu người dùng dựa vào FXStreet để có dữ liệu thị trường thời gian thực, công cụ biểu đồ, góc nhìn chuyên gia và tin tức Forex. Lịch kinh tế toàn diện và các hội thảo web giáo dục giúp nhà giao dịch luôn cập nhật và đưa ra quyết định có tính toán. FXStreet có khoảng 60 nhân sự, chia giữa trụ sở Barcelona và nhiều khu vực toàn cầu.
Đọc thêm


