
Crypto Today: Bitcoin, Ethereum, XRP slide as capital outflows persist
Bởi John Isige
Đã cập nhật: 23 Jun 2026


BÀI VIẾT PHỔ BIẾN

The cryptocurrency market is experiencing broad-based declines on Tuesday, as Bitcoin (BTC) retests support at $62,000, Ethereum (ETH) extends losses toward $1,600, and Ripple (XRP) remains anchored near the key $1.10 demand zone.
- Bitcoin trims early-week gains, nearing support at $62,000 as institutions incessantly withdraw spot ETF assets.
- Ethereum slumps toward $1,600 after rejection below $1,800, largely weighed down by risk-off sentiment and capital outflows.
- XRP declines gain traction around $1.10 despite mild but steady spot ETF inflows.
The cryptocurrency market is experiencing broad-based declines on Tuesday, as Bitcoin (BTC) retests support at $62,000, Ethereum (ETH) extends losses toward $1,600, and Ripple (XRP) remains anchored near the key $1.10 demand zone.
This market-wide selloff is primarily driven by escalating geopolitical uncertainty in the Middle East, with conflicting reports from the United States (US) and Iran on the outcome of the first round of peace talks held in Switzerland over the weekend. The negotiations are part of the Memorandum of Understanding (MoU) signed by both countries, aimed at establishing lasting peace.
US Vice President JD Vance said late Monday that Iran has given the go-ahead for the International Atomic Energy Agency (IAEA) inspectors to return to the country. However, Iran refuted this claim, saying that it had made “no new commitments.”
Meanwhile, US President Donald Trump warned that “if Iran doesn’t live up to their agreement, or if they’re not behaving, I will do what I have to do.”
Risk-off sentiment lingers amid capital outflows
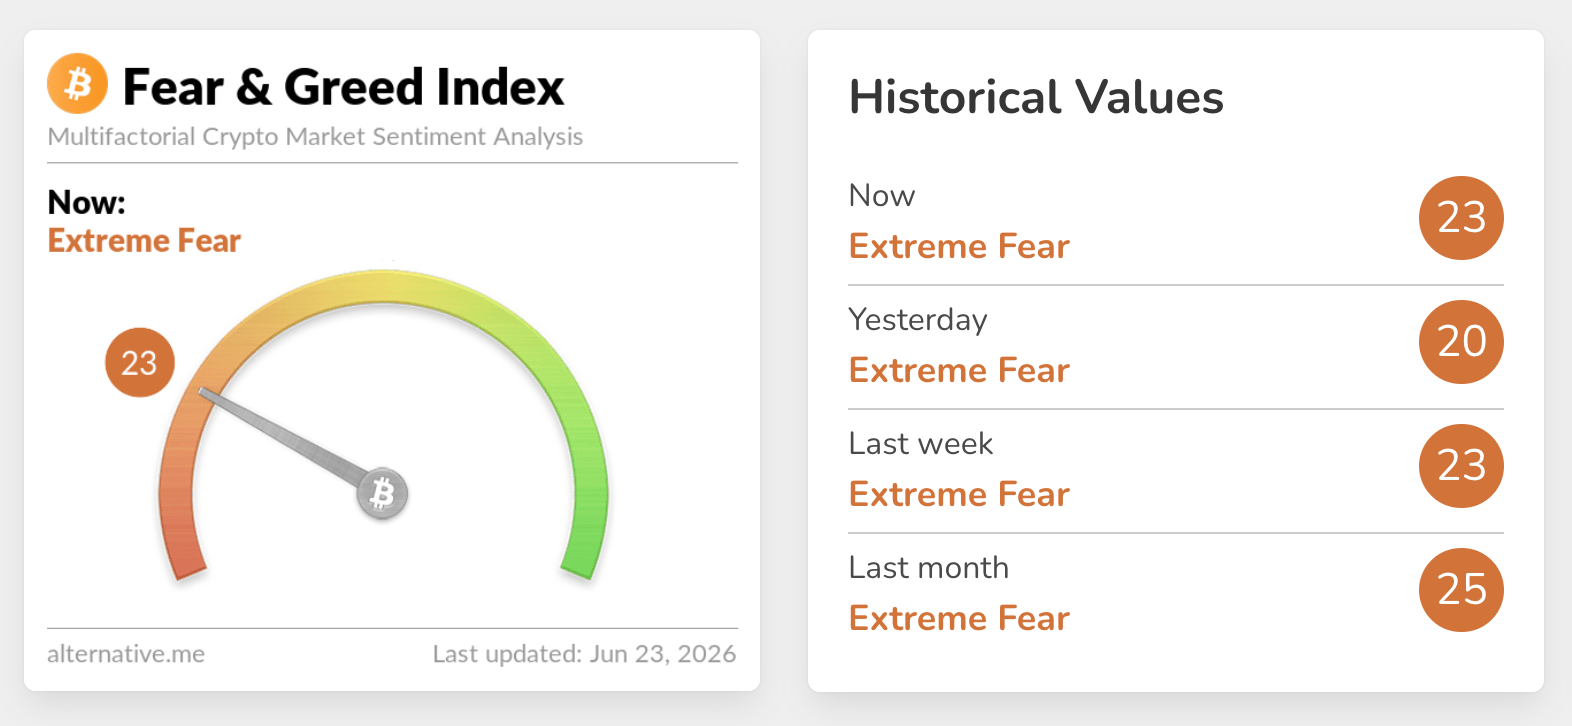
The crypto Fear & Greed Index remains deeply entrenched in Extreme Fear territory, registering 23 on Tuesday, up only marginally from 20 the previous day. This persistent risk aversion underscores weak market confidence and points to ongoing challenges for any sustained price recovery.
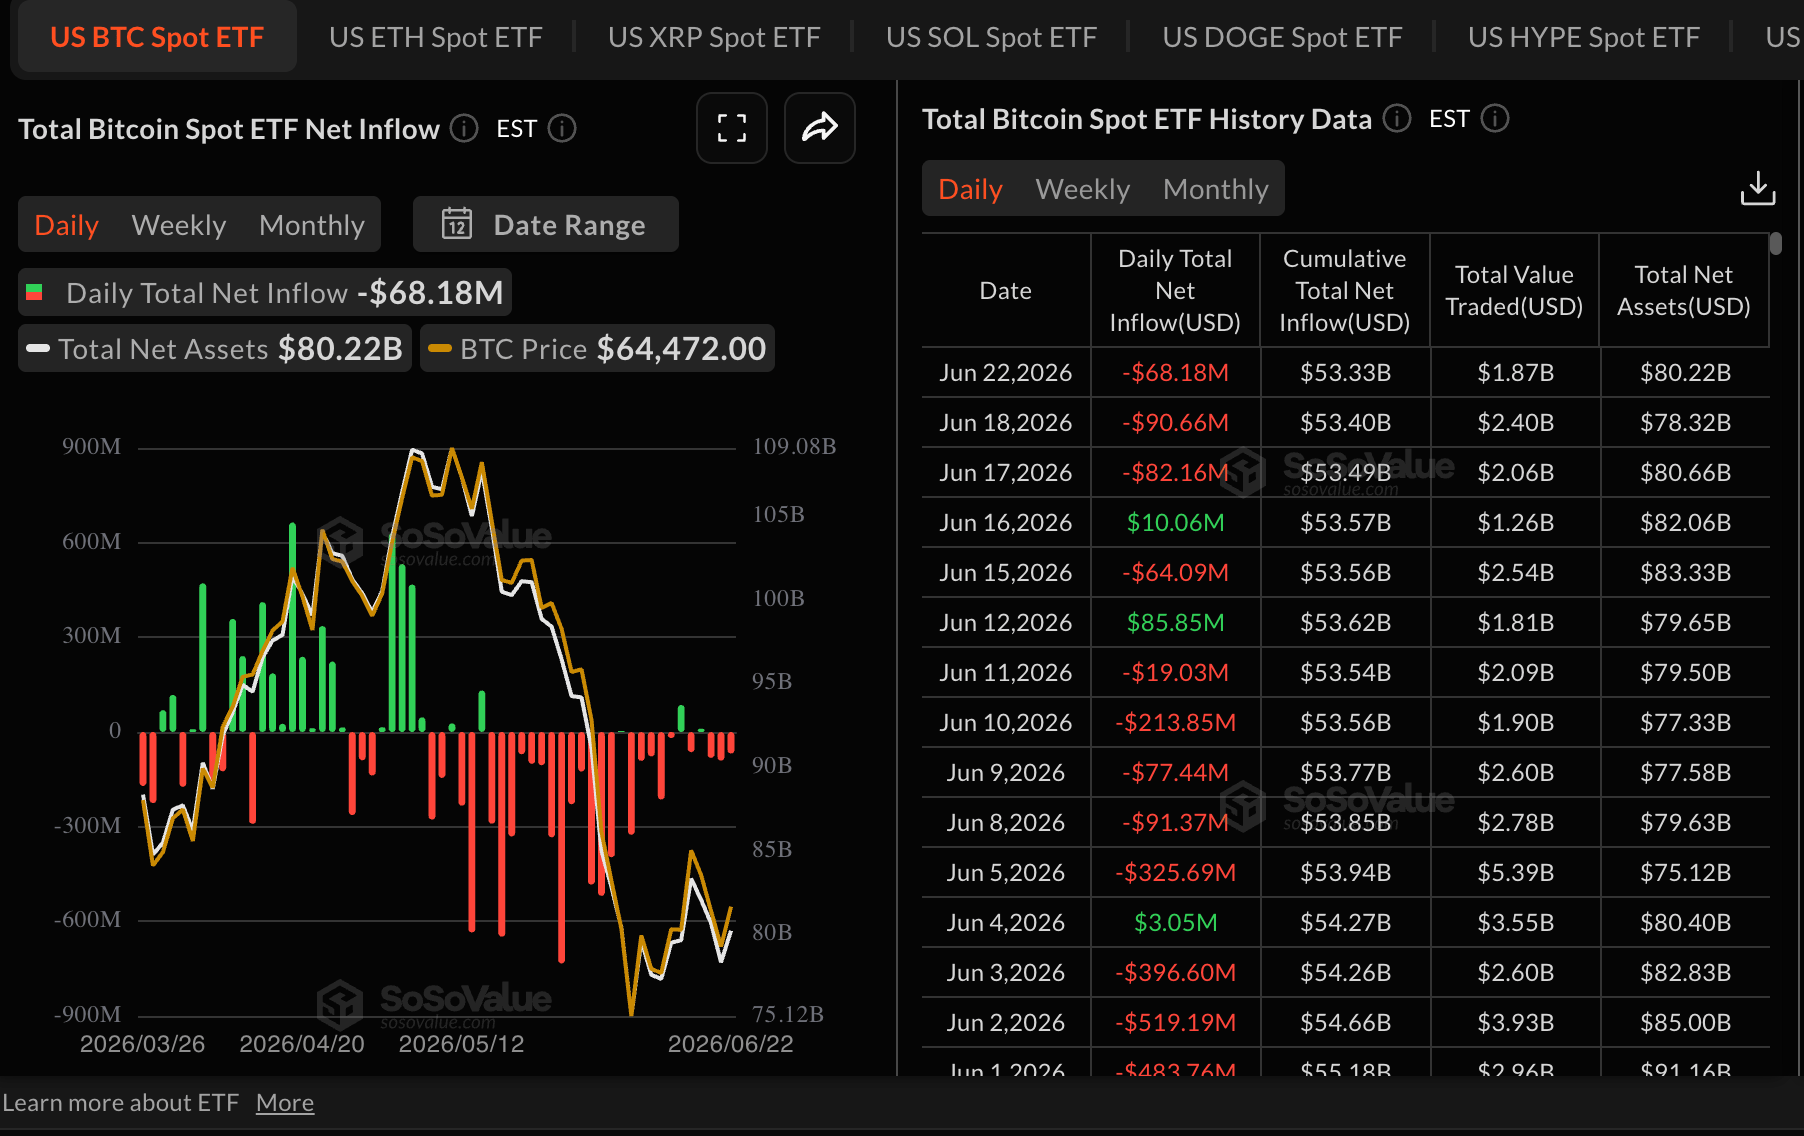
Bitcoin spot Exchange-Traded Funds (ETFs) reflect the risk-off mood amid persistent outflows totaling $68 million on Monday. Cumulative inflows ticked slightly down to $53.33 billion, down from the $53.40 billion recorded on Friday. According to SoSoValue data, total assets under management average $80.22 billion, down from $78.32 billion in the same period.
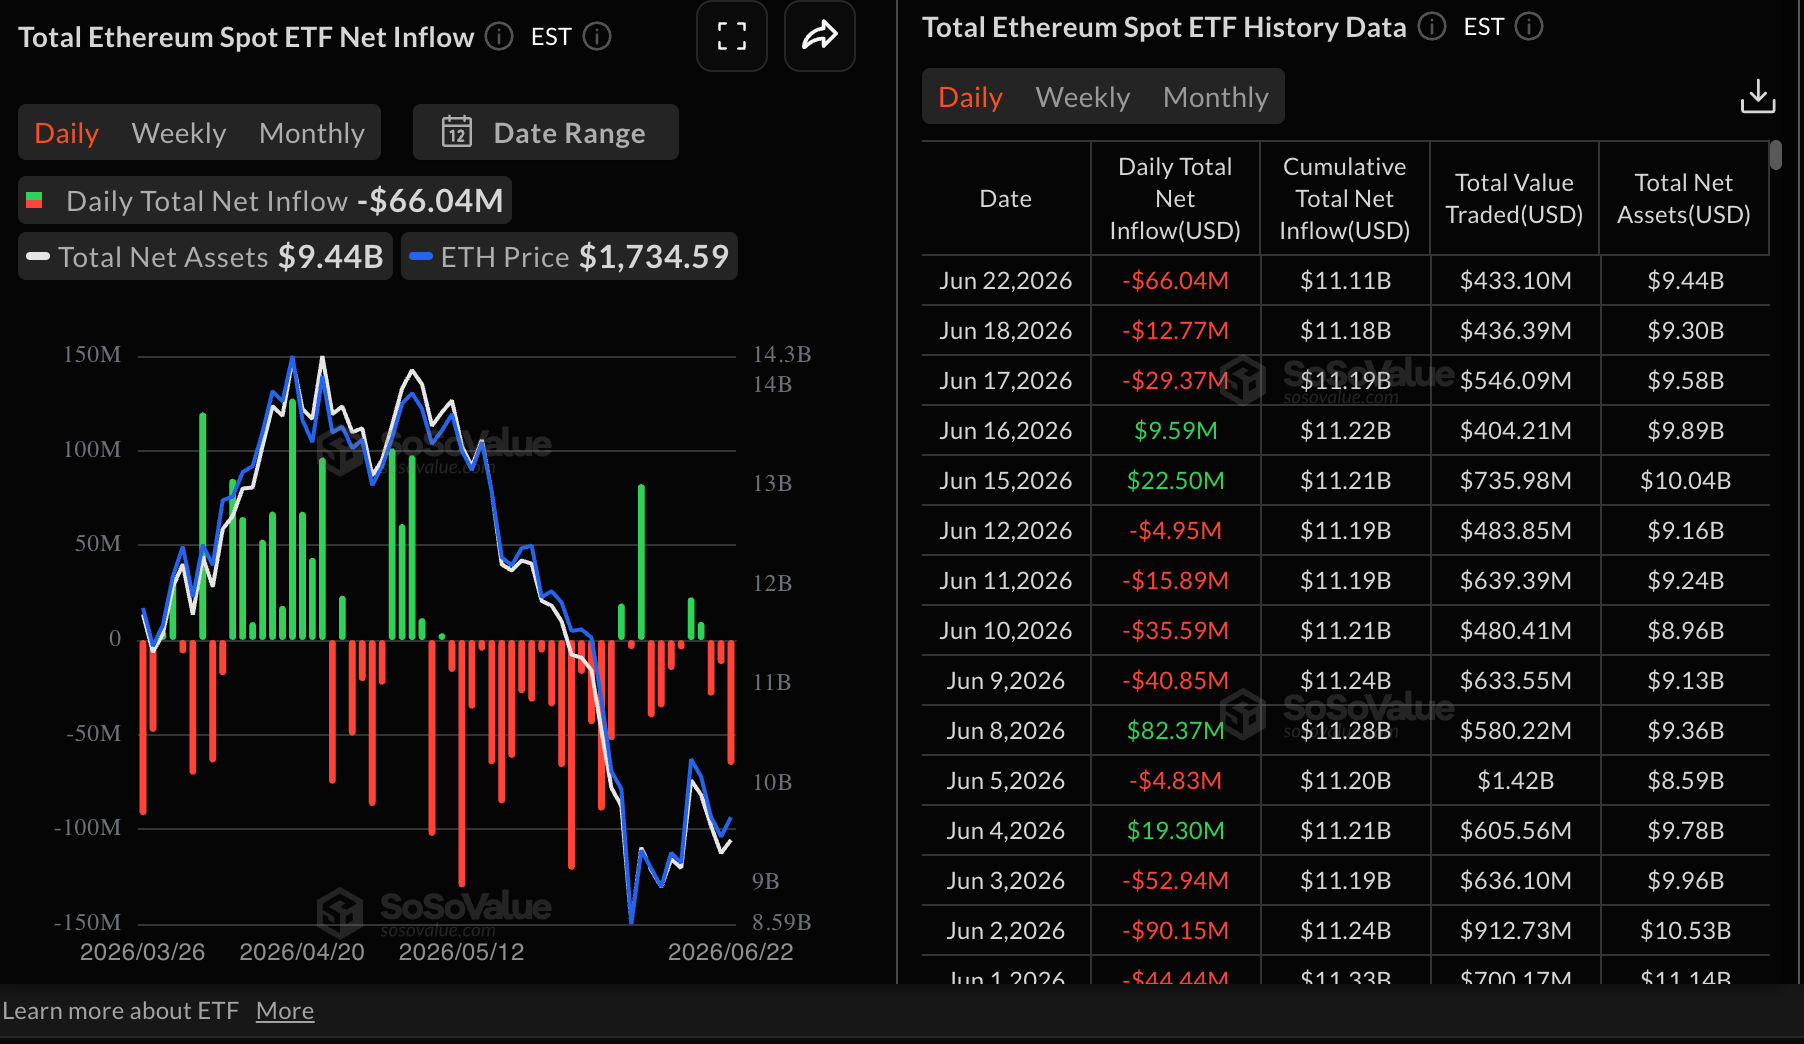
Ethereum spot ETFs retail a bearish streak, with outflows totaling $66 million on Monday compared to nearly $13 million on Friday. Institutions are increasingly retreating to the sidelines, aligning with the broader risk-averse sentiment. Cumulative inflows stand at $11.11 billion with net assets under management at $9.44 billion.
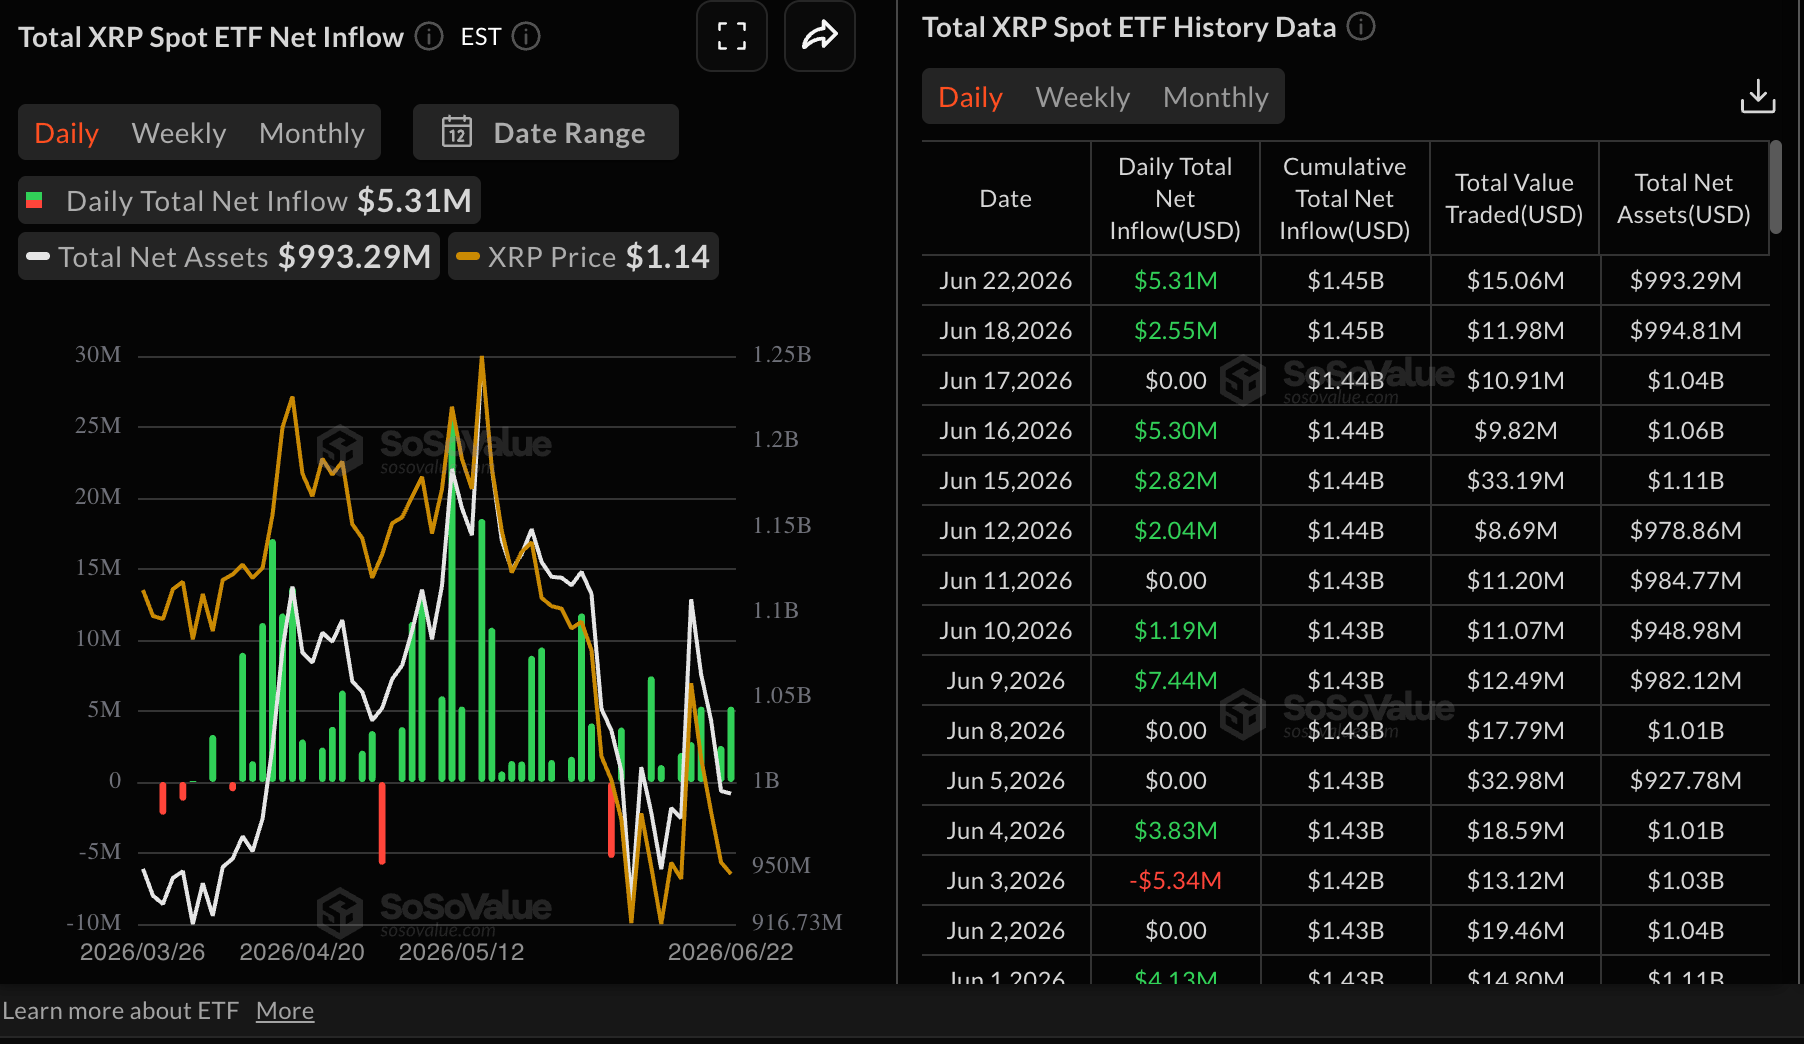
XRP spot ETFs continued to attract consistent inflows, increasing to $5.3 million on Monday from $2.6 million last Friday. SoSoValue data indicate cumulative inflows averaging $1.45 billion and net assets holding at $993 million. Nevertheless, despite this ETF demand, XRP faces persistent selling pressure in the spot market, with prices repeatedly testing the $1.10 support and downside risk extending toward $1.05 and $1.00.
Price analysis: Bitcoin approaches key support
Bitcoin trades above $62,000, maintaining a bearish near-term bias as it holds well below the key Exponential Moving Averages (EMAs). The pair remains capped first by the 50-day EMA near $68,809, with the 100-day EMA around $71,914 and a descending resistance trend line close to $76,458 reinforcing the overhead supply zone. Moreover, the 200-day EMA further above $77,593 underlines a broader corrective phase despite the recent breakout around $66,000.
Momentum, however, is attempting to improve, with the Moving Average Convergence Divergence (MACD) histogram holding in positive territory on the daily chart and the Money Flow Index (MFI) hovering above 50, which hints that selling pressure is fading rather than truly reversing the dominant downtrend.
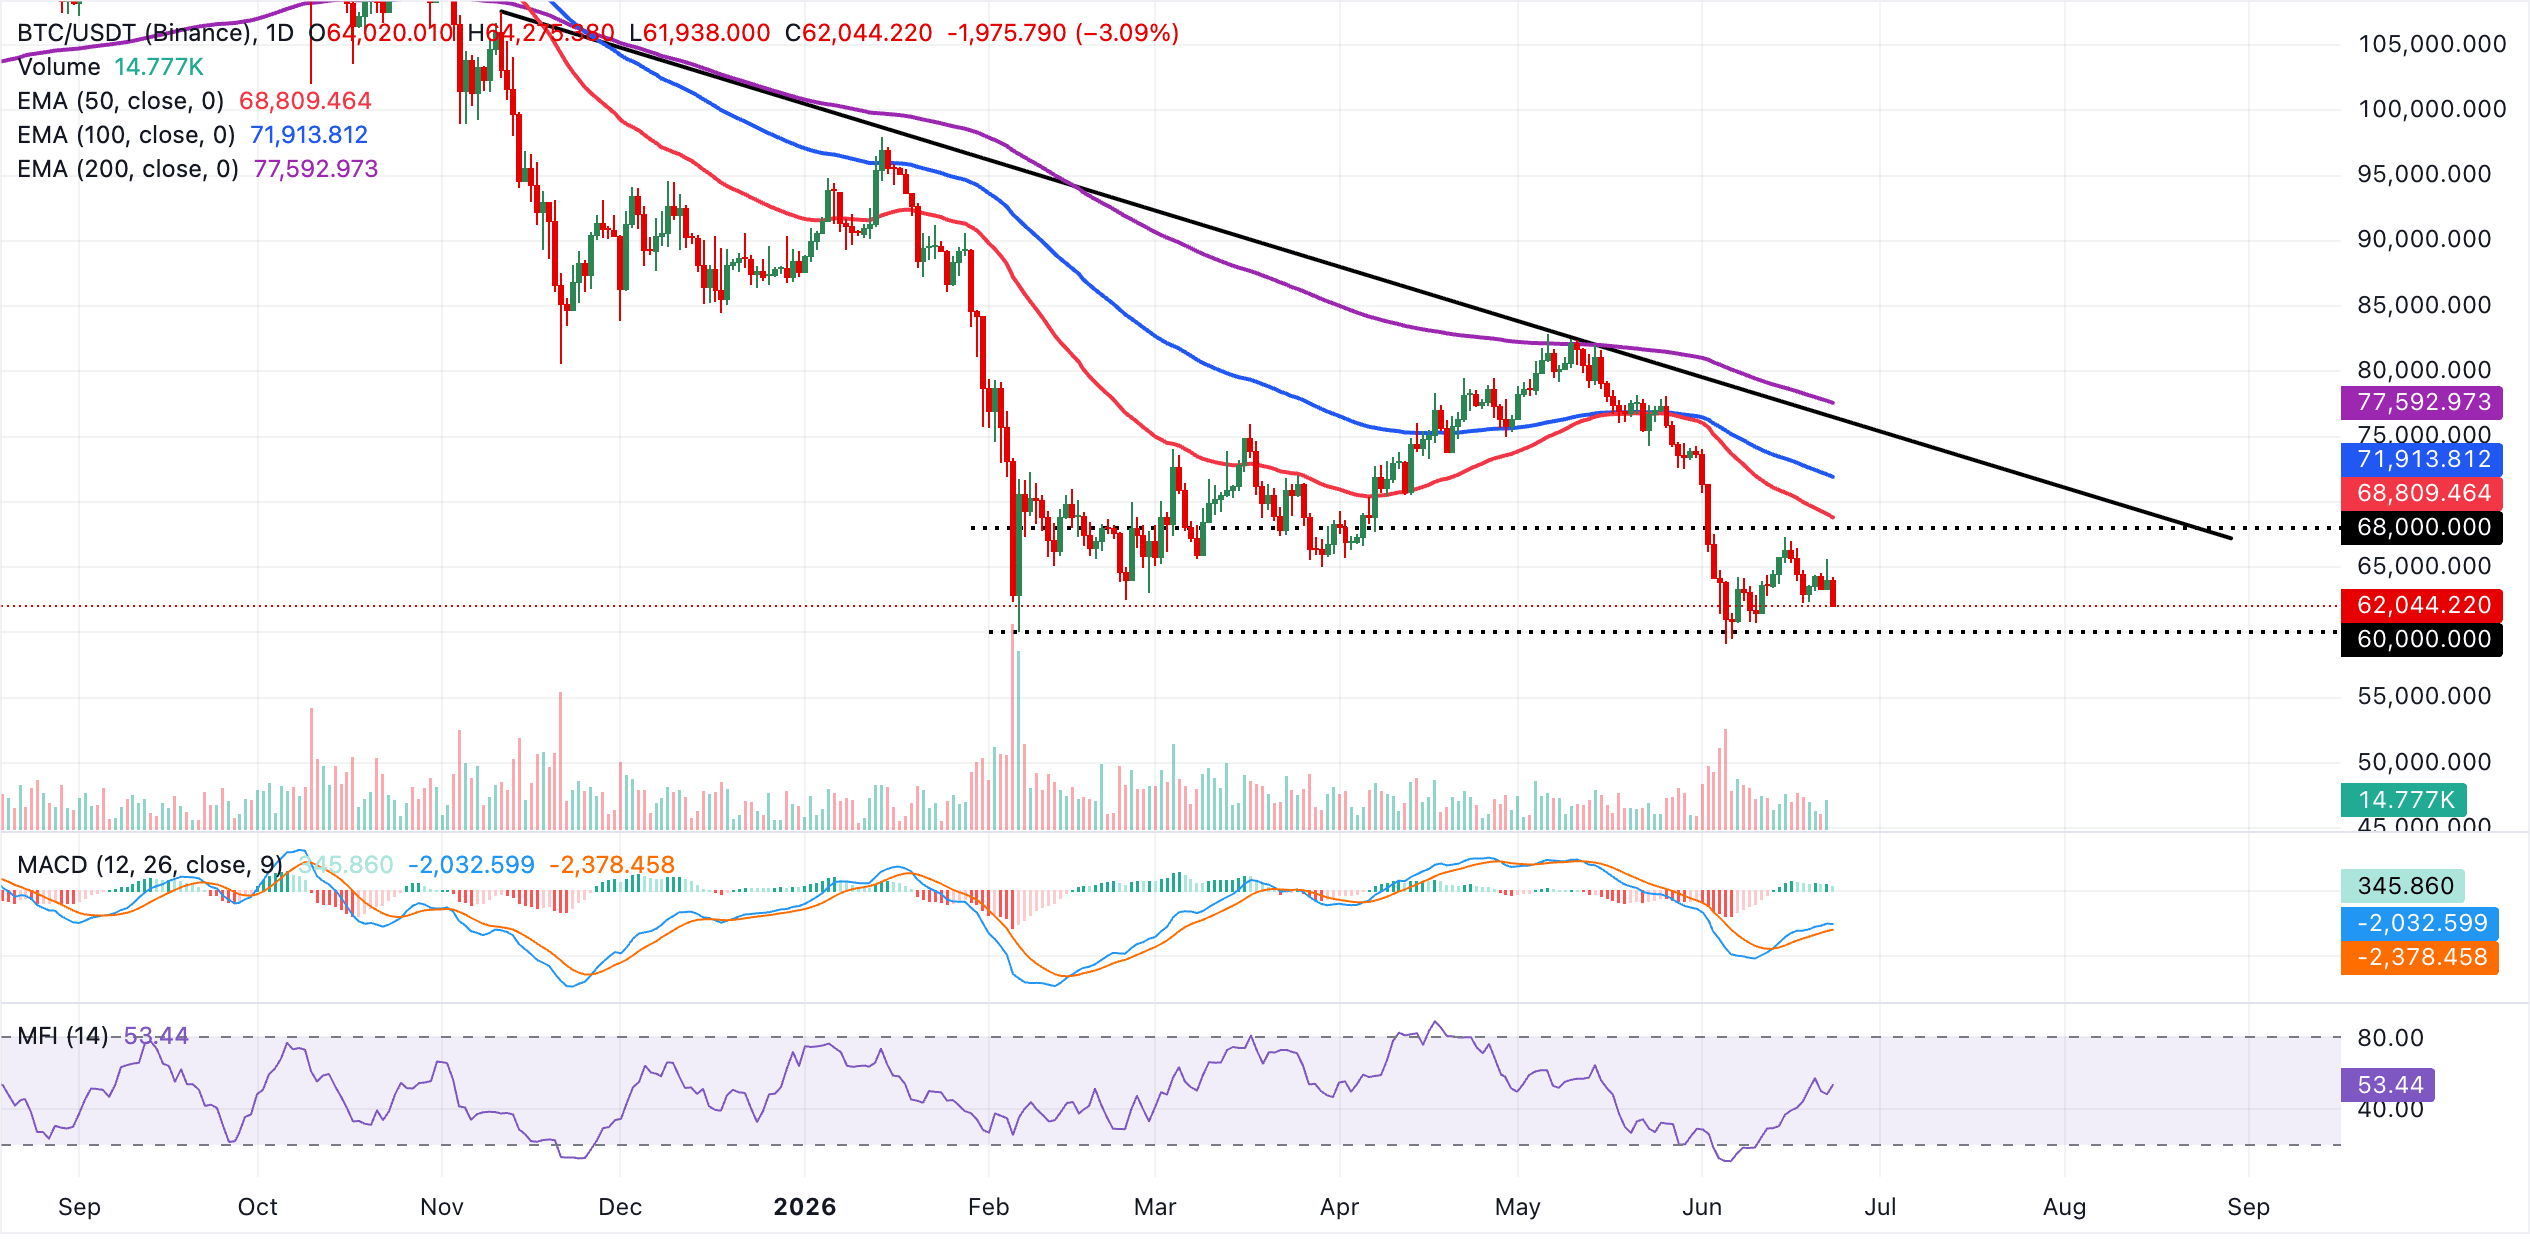
On the topside, any recovery would initially face resistance at the 50-day EMA around $68,809, followed by the 100-day EMA near $71,914. A daily close above these levels would be needed to suggest a more sustained rebound. Further up, the downward-sloping resistance trend line near $76,458 and the 200-day EMA around $77,593 form a dense medium-term cap that is likely to attract fresh supply on approaches. Looking down, Bitcoin's initial support lies at $62,000, followed by the psychological $60,000 level if selling intensifies.
Altcoins technical outlook: Ethereum and XRP uphold bearish outlook
Ethereum is dealing with a dominant bearish near-term bias, trading downward at $1,650. The smart contract token holds below dynamic resistance as highlighted by the 50-day, 100-day and 200-day EMAs. A long-running downward resistance trendline caps the upside, with a break area around $2,015, reinforcing the view that recent recovery attempts are still unfolding within a broader corrective phase.
On the daily timeframe, the MACD histogram has flipped positive and the MFI remains firmly in bullish territory above 60, underscoring improving momentum. However, with spot prices still trading below key moving averages, these signals suggest the market may be establishing a base, rather than confirming a broader trend reversal at this stage.
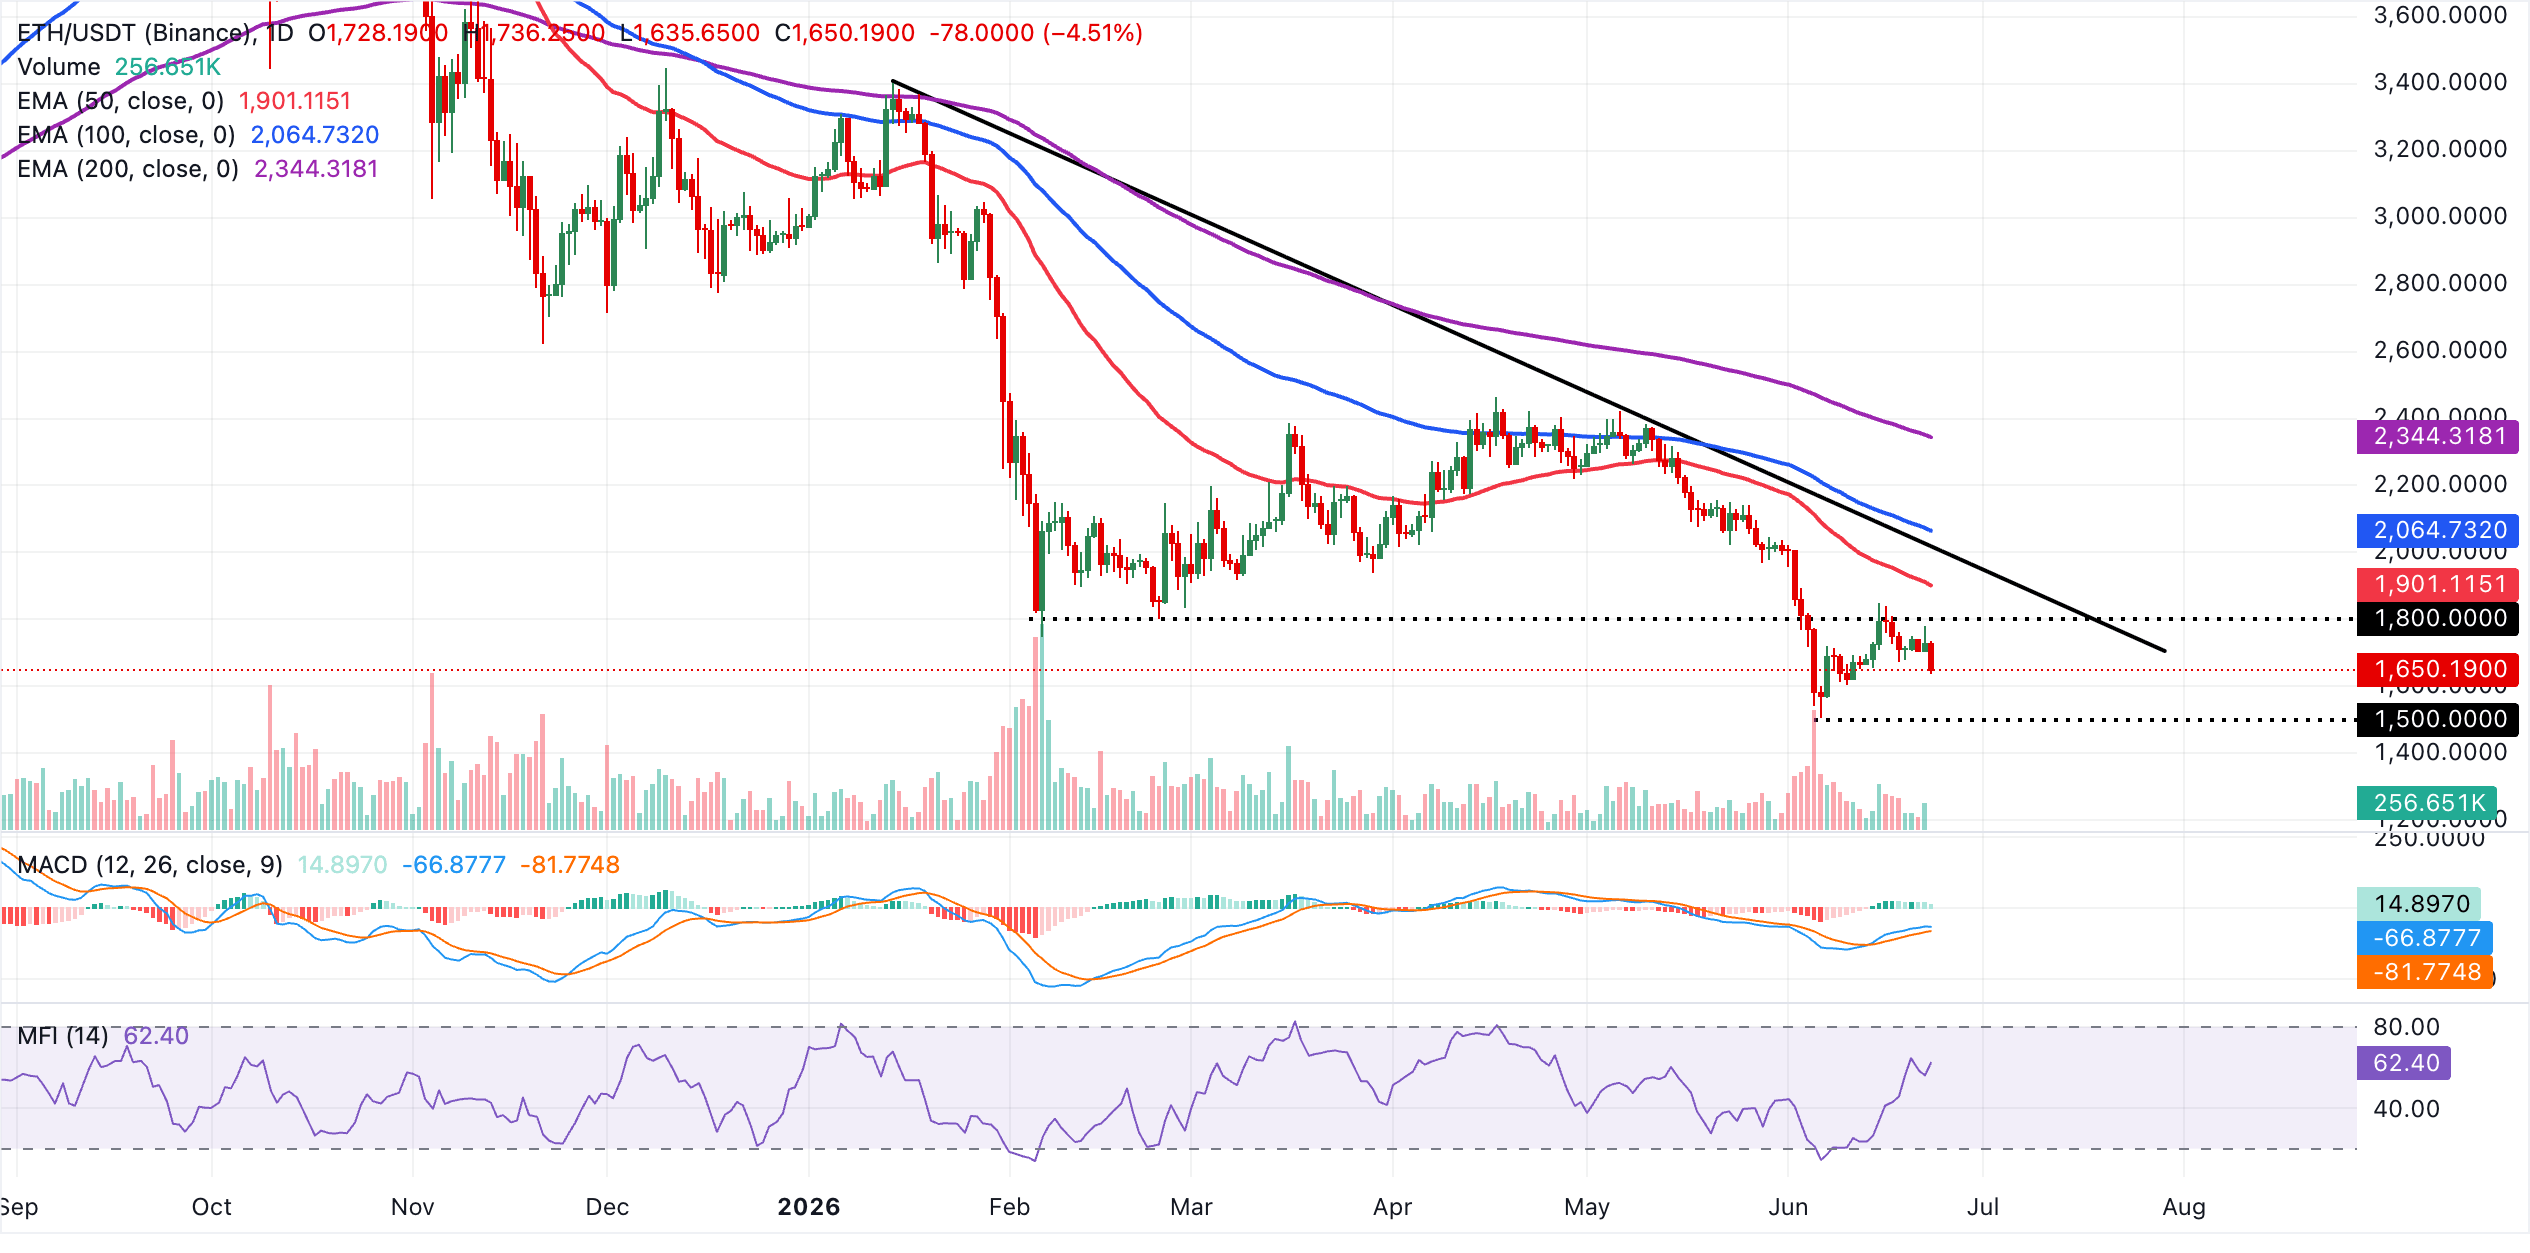
Initial resistance is anticipated around the 50-day EMA near $1,901 and the 100-day EMA around $2,065 adding to overhead supply before the longer-term 200-day EMA looms near $2,344. If the current correction persists, traders may look to recent swing lows and psychological handles at $1,600 and $1,500 to gauge where dip-buying interest might emerge.
On the other hand, XRP trades at $1.10, maintaining a bearish near-term bias as price holds decisively below the 50-day, 100-day and 200-day EMAs.
The pair continues to trade below the middle Bollinger Band, keeping price action constrained to the lower half of the volatility envelope. Although the MACD histogram is edging slightly into positive territory, the MFI's neutral reading near 52 suggests that recovery attempts remain fragile as long as overhead resistance persists.
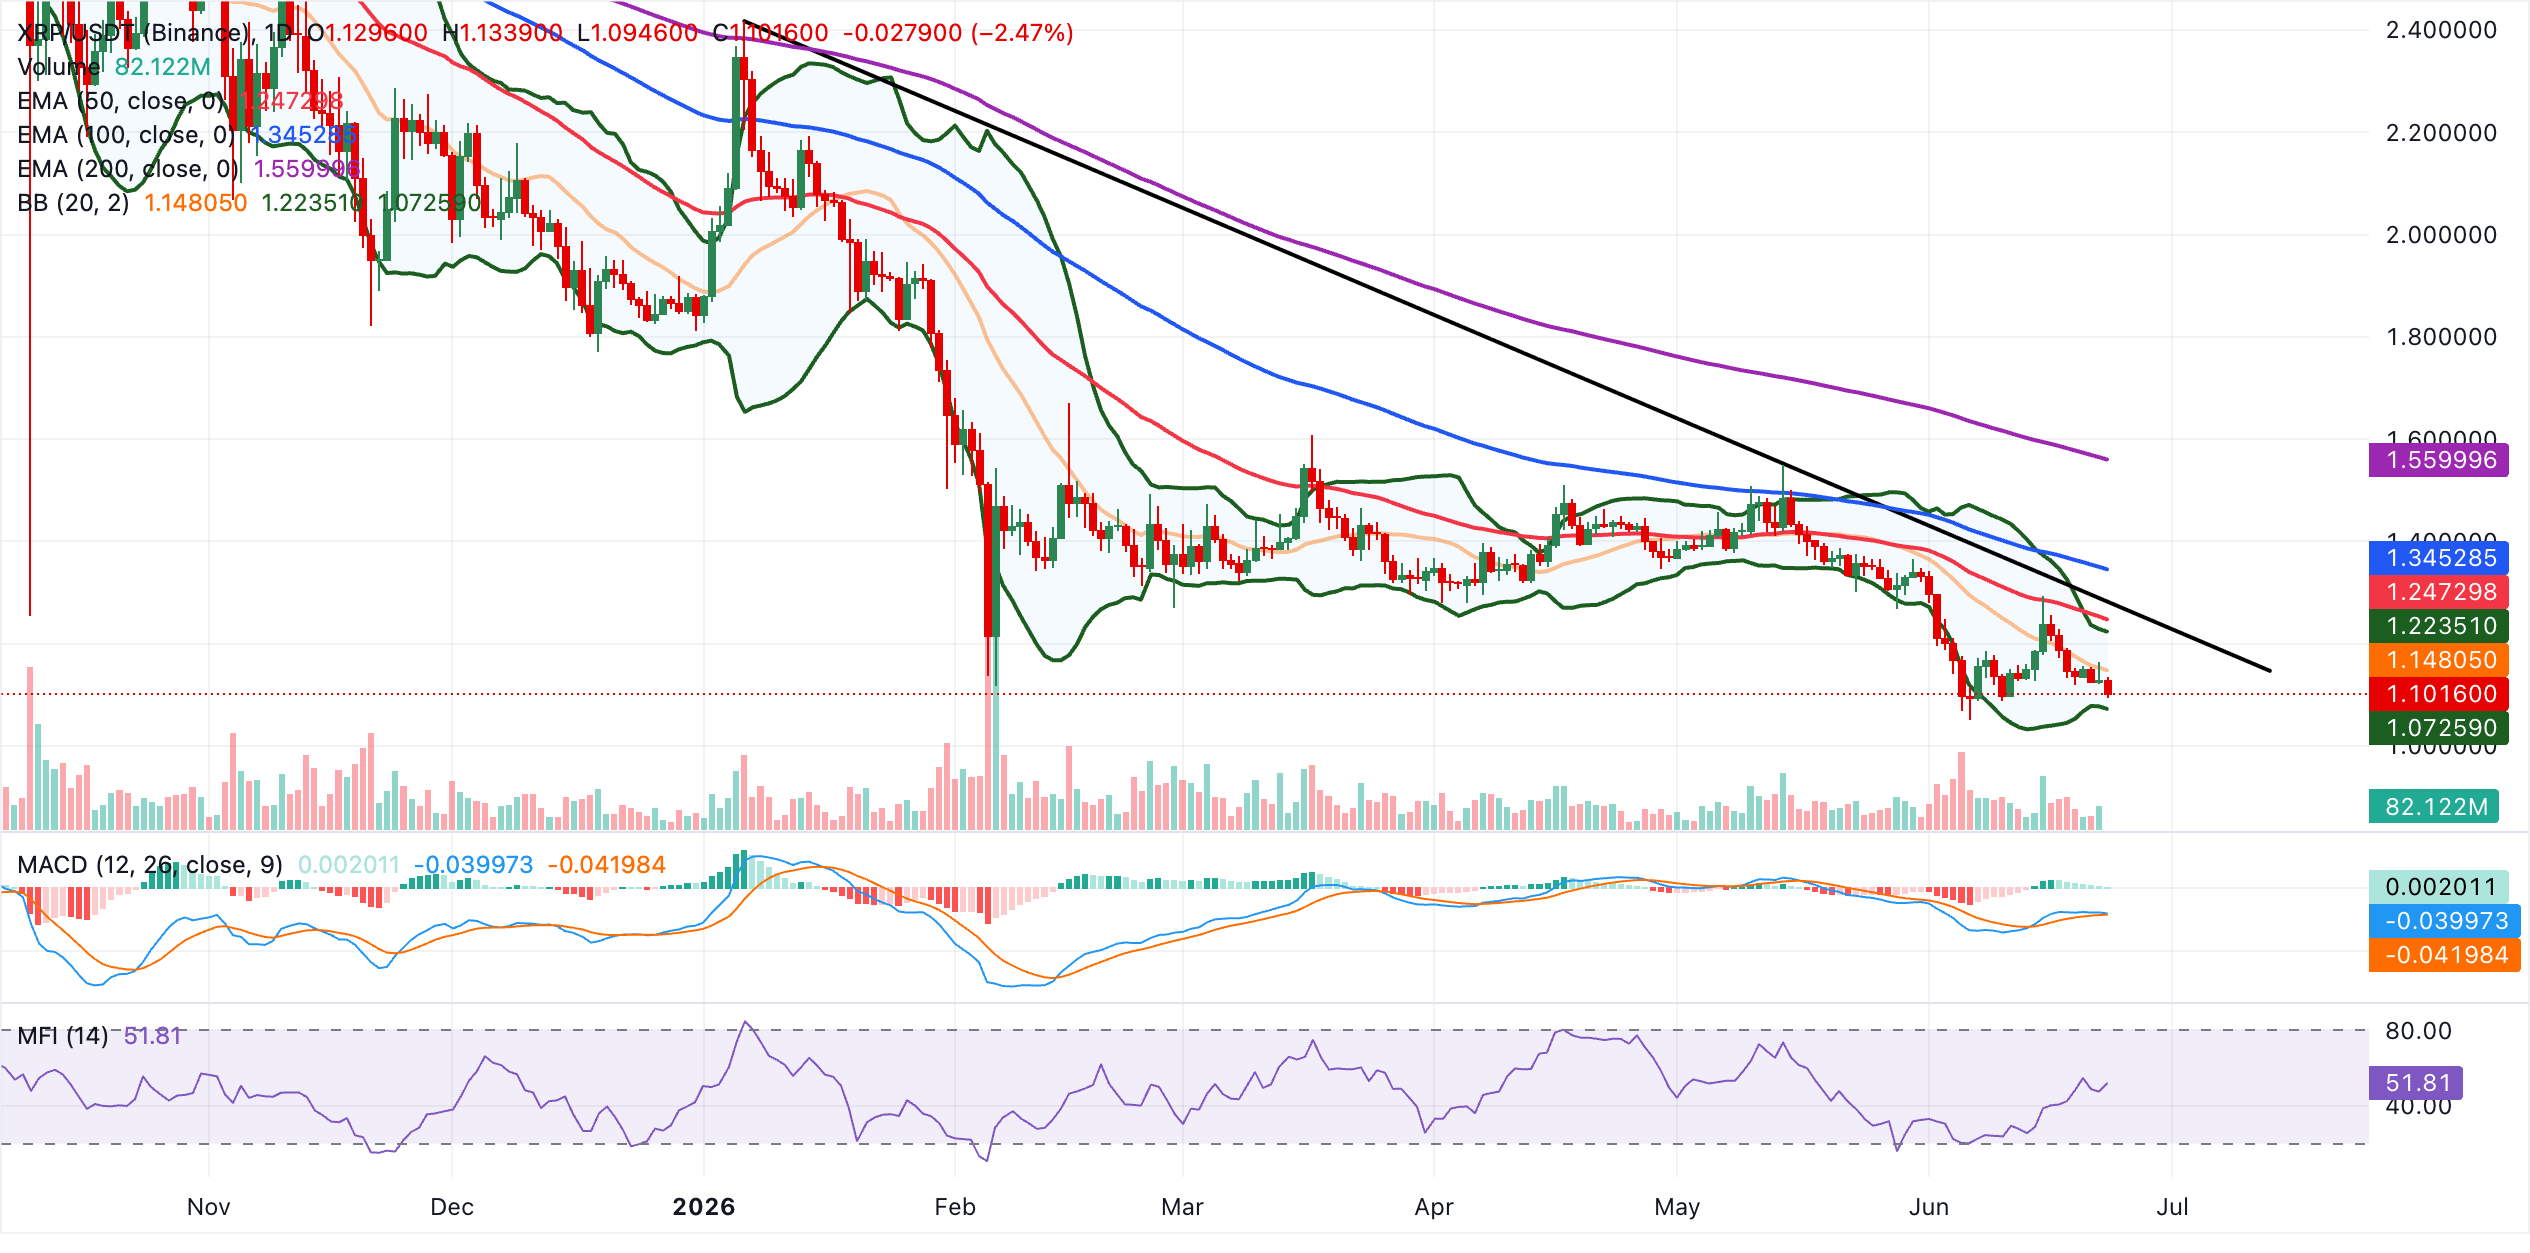
Initial resistance emerges at the middle Bollinger Band around $1.15, ahead of the upper Bollinger Band around $1.22. Above that, the 50-day EMA at $1.25 lines up beneath the descending trendline region near $1.28, before more substantial medium-term barriers at the 100-day EMA around $1.35 and the 200-day EMA near $1.56.
Looking down, immediate support is provided by the lower Bollinger band at $1.07, where a clear break would open the door to a deeper deterioration in the daily structure.
(The technical analysis of this story was written with the help of an AI tool.)
Bitcoin, altcoins, stablecoins FAQs
Bitcoin is the largest cryptocurrency by market capitalization, a virtual currency designed to serve as money. This form of payment cannot be controlled by any one person, group, or entity, which eliminates the need for third-party participation during financial transactions.
Altcoins are any cryptocurrency apart from Bitcoin, but some also regard Ethereum as a non-altcoin because it is from these two cryptocurrencies that forking happens. If this is true, then Litecoin is the first altcoin, forked from the Bitcoin protocol and, therefore, an “improved” version of it.
Stablecoins are cryptocurrencies designed to have a stable price, with their value backed by a reserve of the asset it represents. To achieve this, the value of any one stablecoin is pegged to a commodity or financial instrument, such as the US Dollar (USD), with its supply regulated by an algorithm or demand. The main goal of stablecoins is to provide an on/off-ramp for investors willing to trade and invest in cryptocurrencies. Stablecoins also allow investors to store value since cryptocurrencies, in general, are subject to volatility.
Bitcoin dominance is the ratio of Bitcoin's market capitalization to the total market capitalization of all cryptocurrencies combined. It provides a clear picture of Bitcoin’s interest among investors. A high BTC dominance typically happens before and during a bull run, in which investors resort to investing in relatively stable and high market capitalization cryptocurrency like Bitcoin. A drop in BTC dominance usually means that investors are moving their capital and/or profits to altcoins in a quest for higher returns, which usually triggers an explosion of altcoin rallies.

Hơn một triệu người dùng dựa vào FXStreet để có dữ liệu thị trường thời gian thực, công cụ biểu đồ, góc nhìn chuyên gia và tin tức Forex. Lịch kinh tế toàn diện và các hội thảo web giáo dục giúp nhà giao dịch luôn cập nhật và đưa ra quyết định có tính toán. FXStreet có khoảng 60 nhân sự, chia giữa trụ sở Barcelona và nhiều khu vực toàn cầu.
Đọc thêm


