
Crypto Today: Bitcoin, Ethereum, XRP weaken further as capital outflows persist
Bởi John Isige
Đã cập nhật: 19 Jun 2026


BÀI VIẾT PHỔ BIẾN

Macroeconomic headwinds continue to weigh heavily on the cryptocurrency market on Friday, prompting major assets like Bitcoin (BTC) to pare earlier gains and extend losses after June’s brief relief rally.
- Bitcoin remains suppressed below $63,000, weighed down by ETF outflows and a deteriorating technical structure.
- Ethereum extends its losing streak, trading below $1,700 amid persistent risk-off sentiment and continued institutional outflows.
- XRP bears tighten their grip, accelerating the downtrend toward $1.12 as retail demand fades.
Macroeconomic headwinds continue to weigh heavily on the cryptocurrency market on Friday, prompting major assets like Bitcoin (BTC) to pare earlier gains and extend losses after June’s brief relief rally.
Altcoins, including Ethereum (ETH) and Ripple (XRP), are also suppressed, probing lower levels near $1,600 and $1.12, respectively.
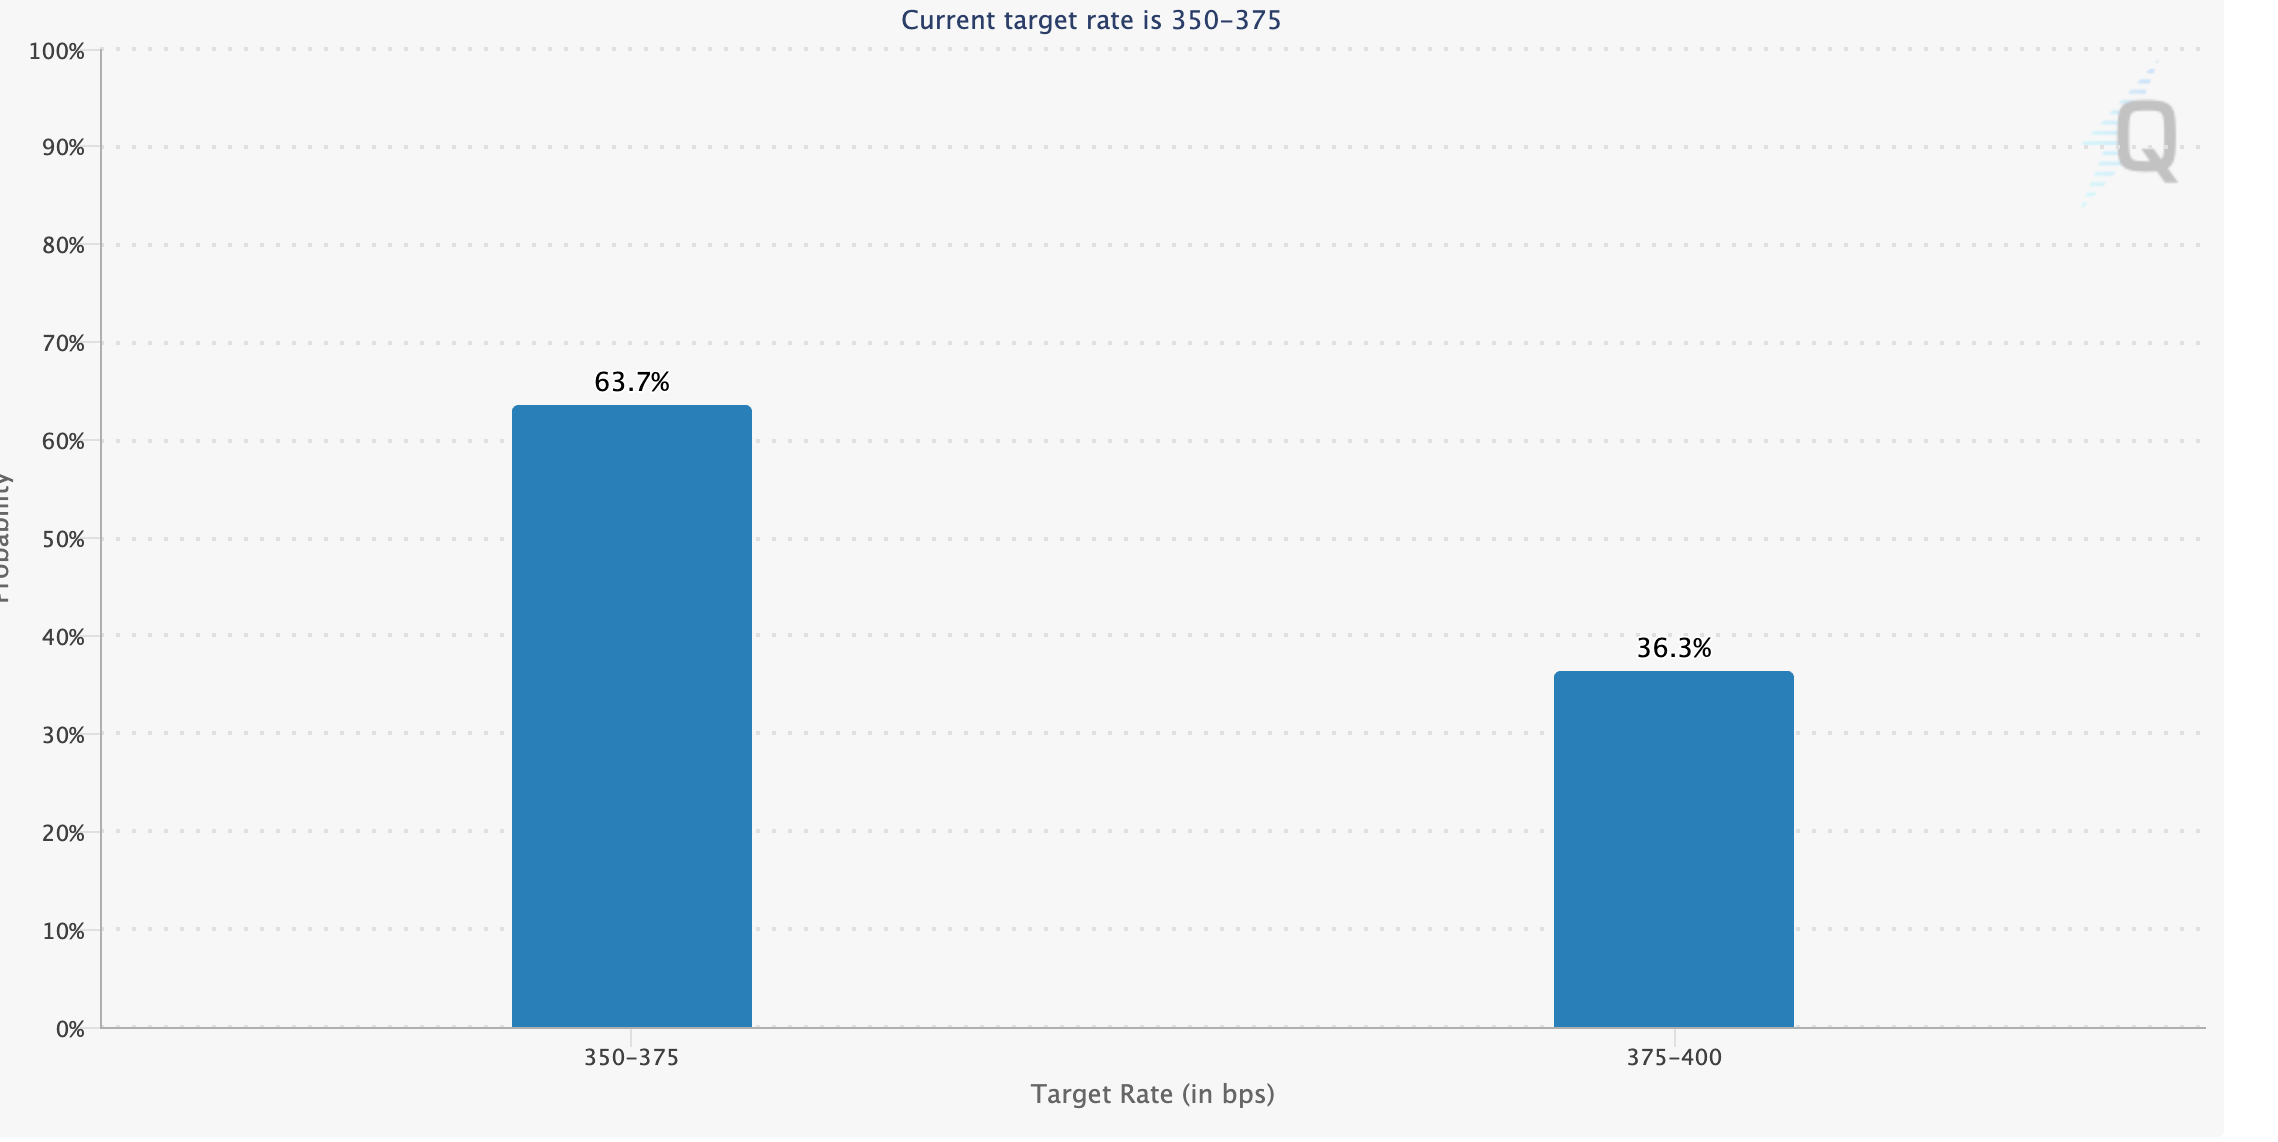
The Federal Reserve’s (Fed) hawkish stance after leaving interest rates unchanged in the 3.50%-3.75% range points to an extended period of tighter monetary policy. Fed Chairman Kevin Warsh's comments at the post-meeting press conference emphasized the need to bring inflation to the long-term target of 2% while ensuring price stability.
Market participants are increasingly betting on a rate hike at the next review cycle, with CME Group data indicating a 36% chance. Investors are largely pricing in a 64% probability that the Fed leaves interest rates unchanged.
Risk sentiment deteriorates amid capital outflows
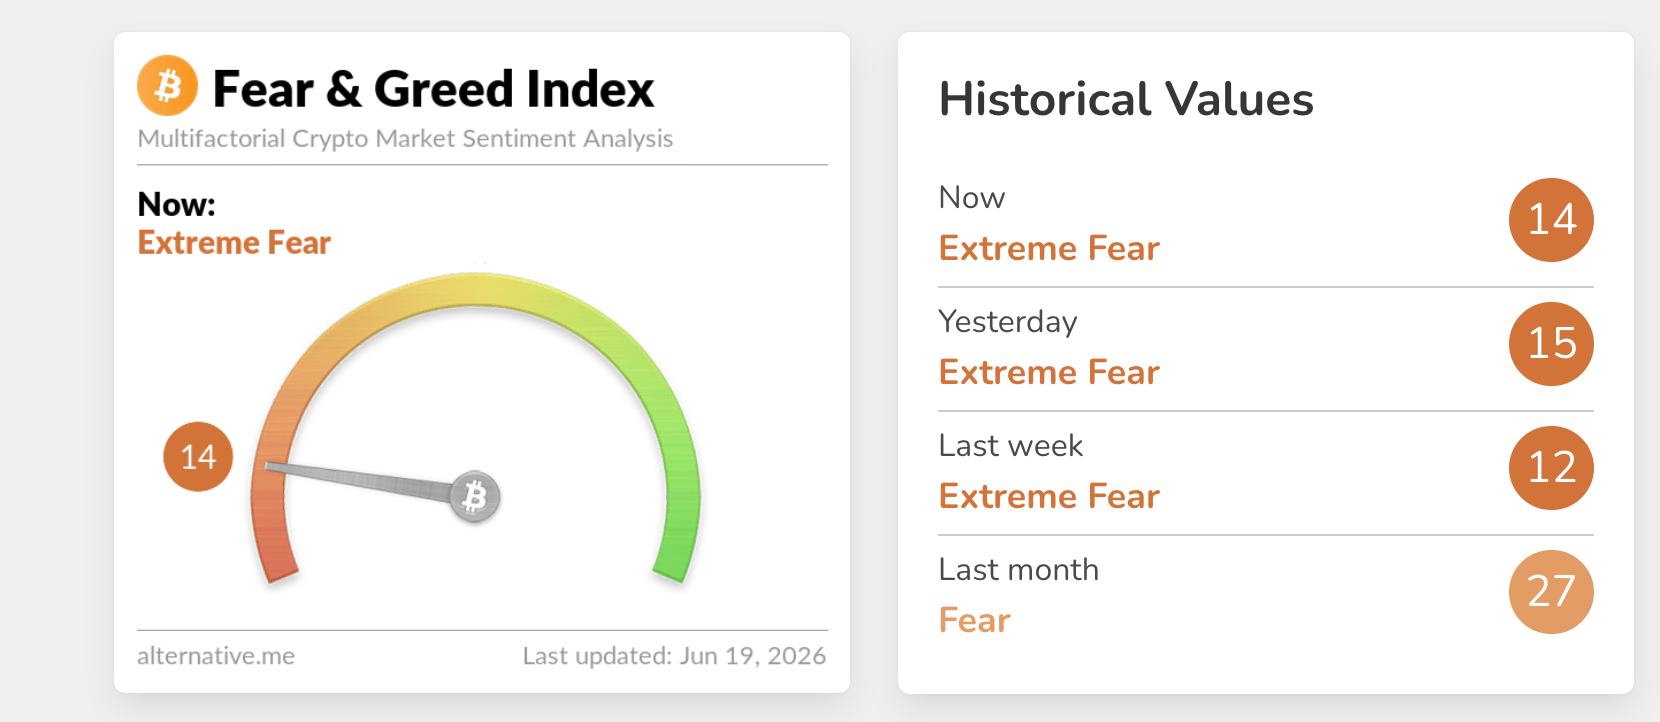
Risk appetite for crypto assets remains significantly low, as reflected in the Fear & Greed Index, steady around 14 in the Extreme Fear territory on Friday. The persistent risk-off mood suggests that investors are exhausted amid declining conviction in the crypto market’s ability to sustain its short to medium-term recovery.
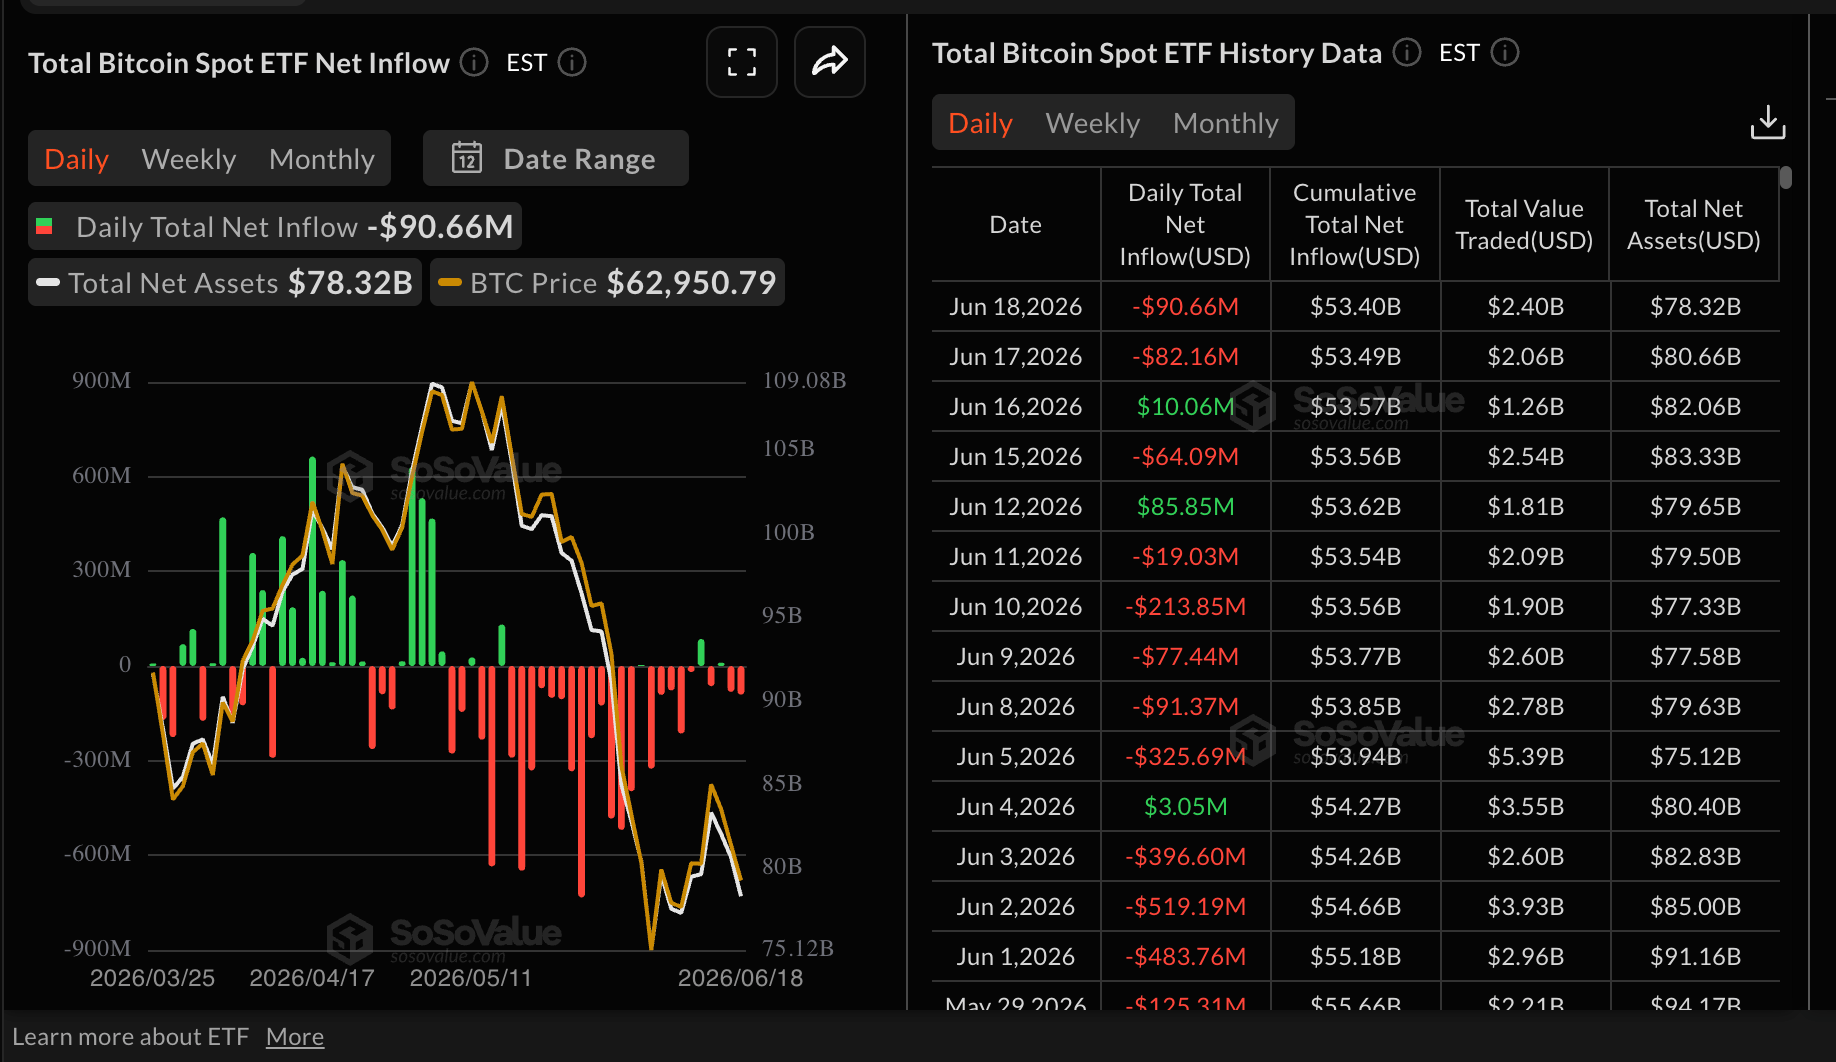
The widespread retreat among investors is evidenced by continued outflows from Bitcoin spot Exchange-Traded Funds (ETFs), totaling roughly $91 million on Thursday and $82 million the day before.
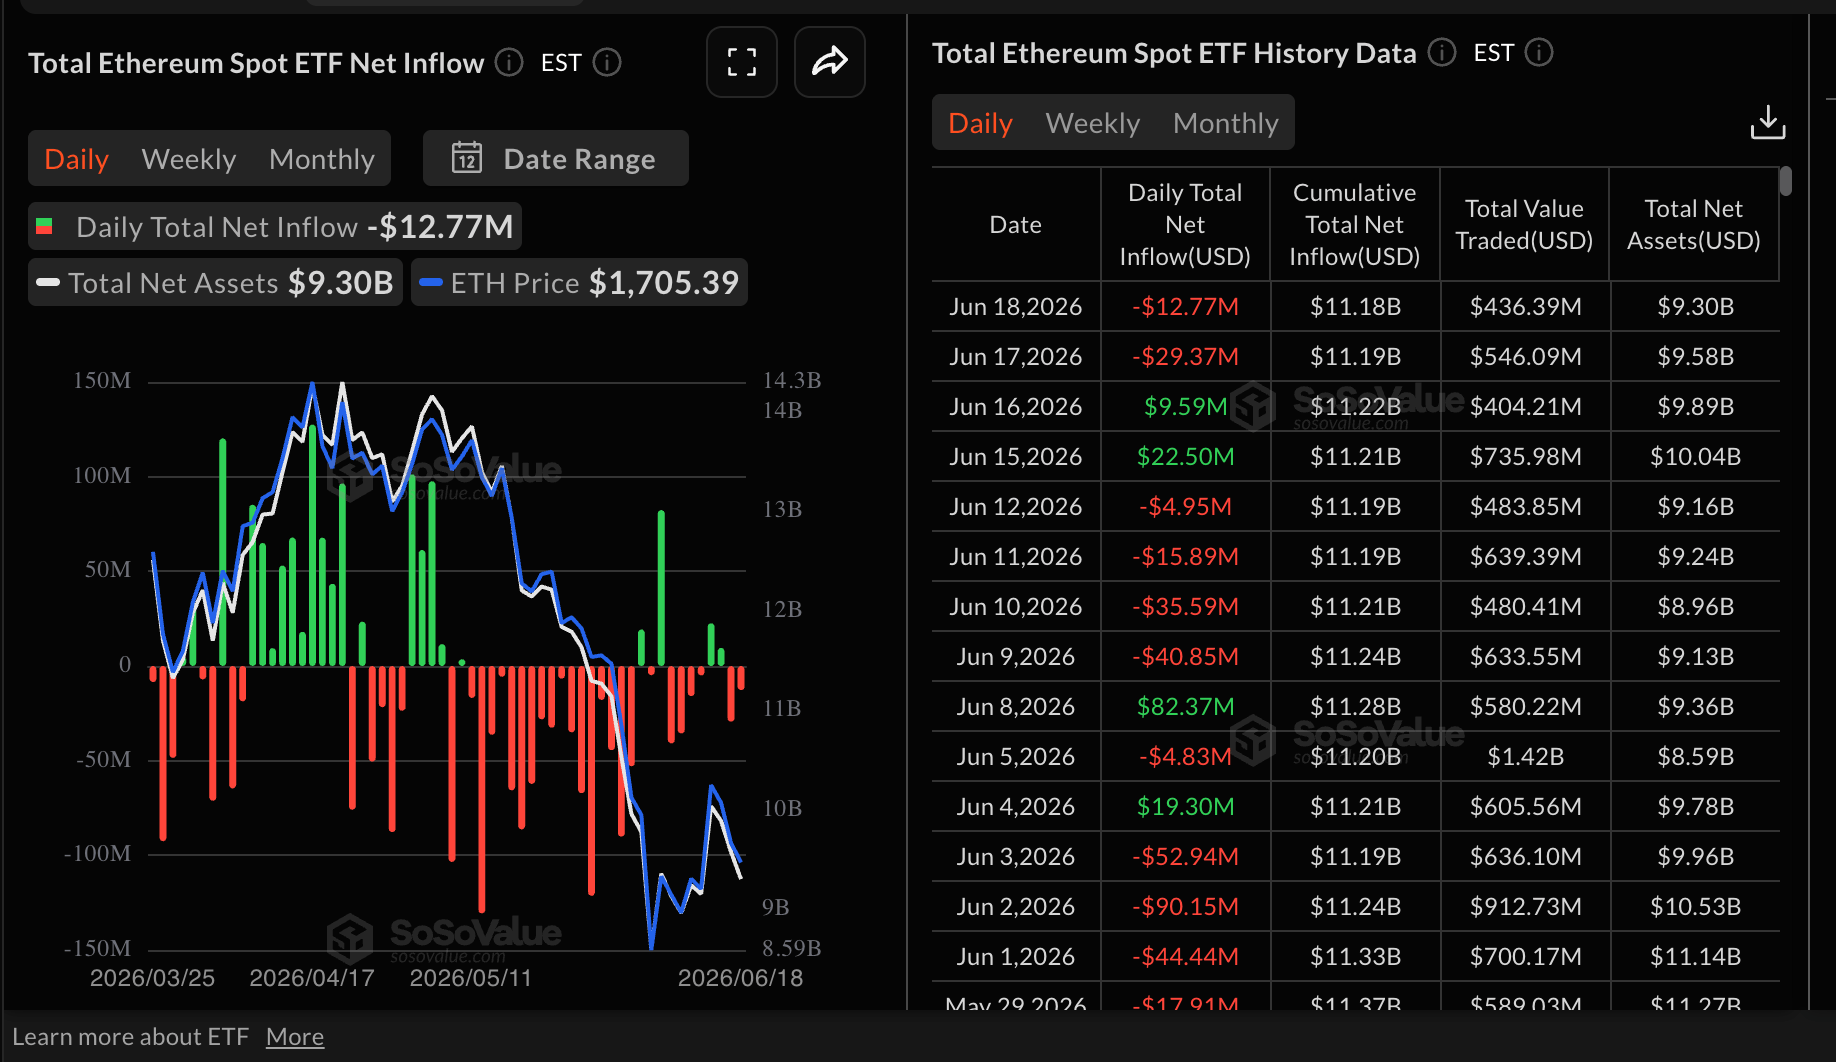
Ethereum spot ETFs extended the drawdown with approximately $13 million in outflows on Thursday and $29 million the previous day. SoSoValue data shows cumulative inflows falling to $11.18 billion from $11.19 billion in the same period. Assets under management average $9.3 billion.
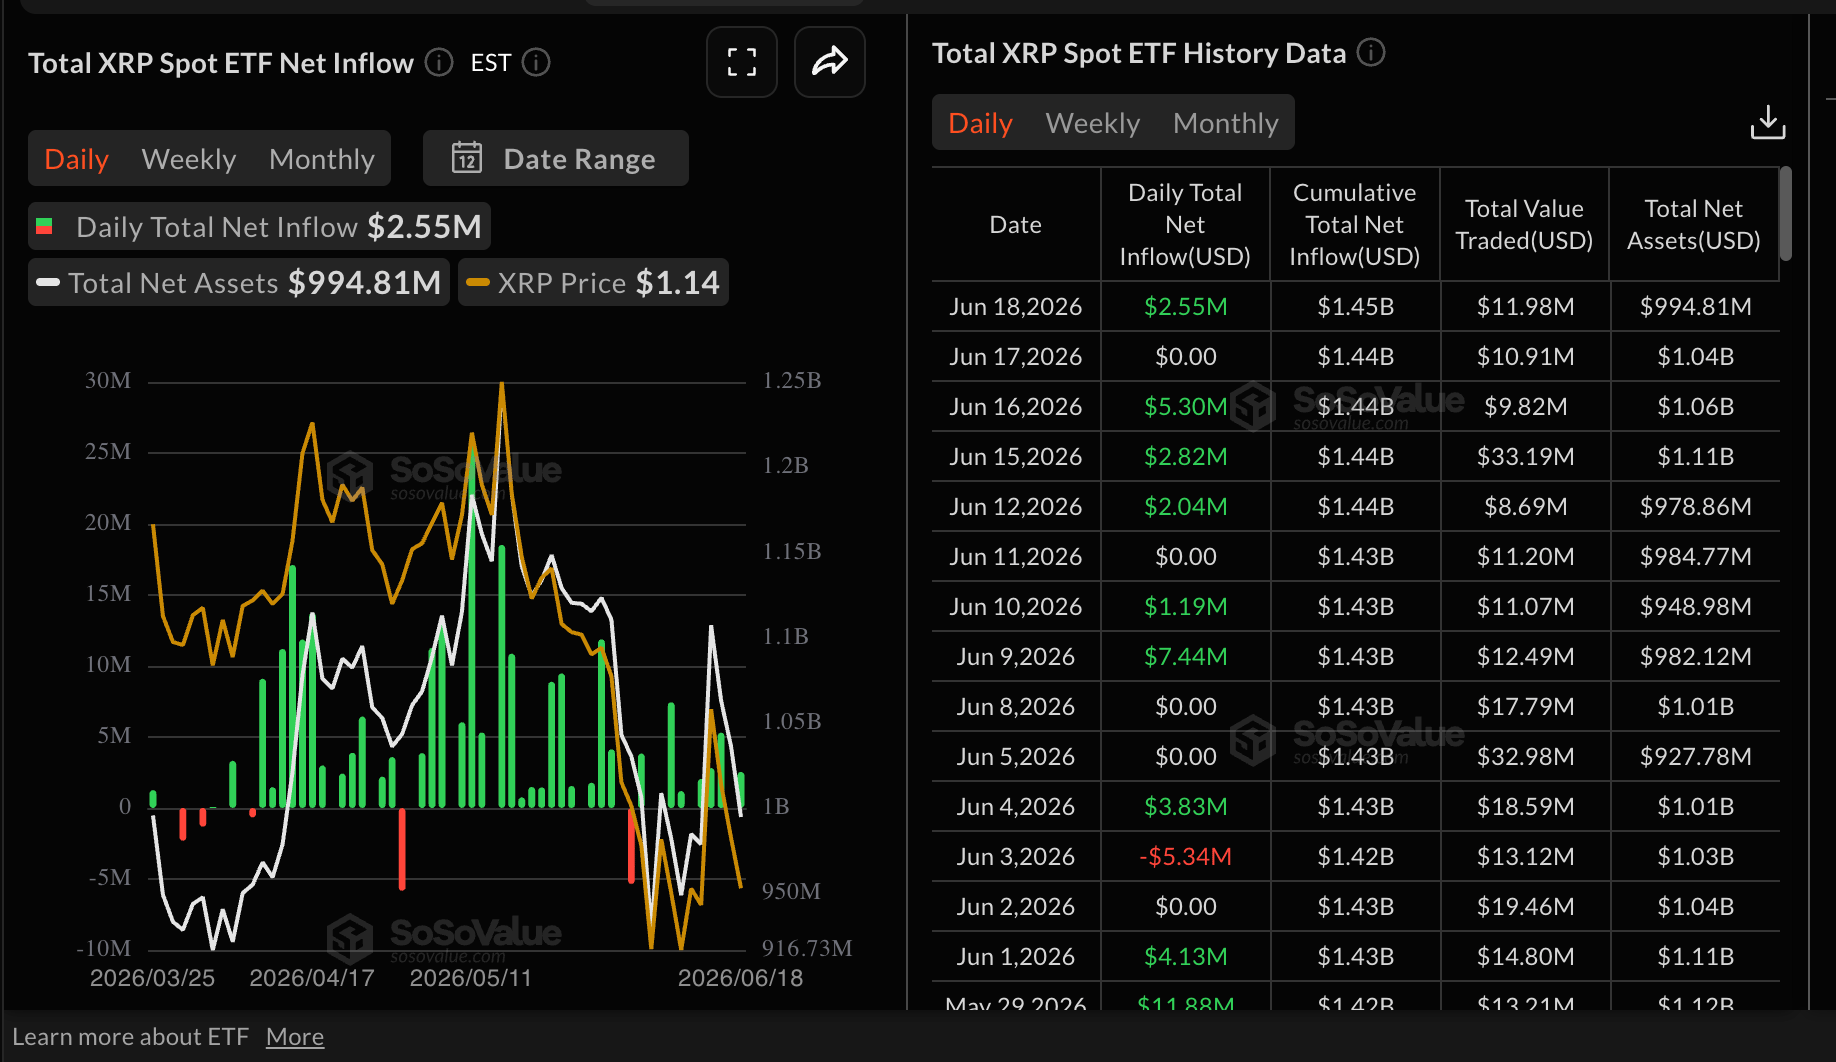
Meanwhile, XRP spot ETFs outpaced both Bitcoin and Ethereum, attracting $2.55 million in inflows on Thursday. Despite mild inflows, headwinds outweigh demand, leaving the token vulnerable to further losses in the spot and derivatives markets.
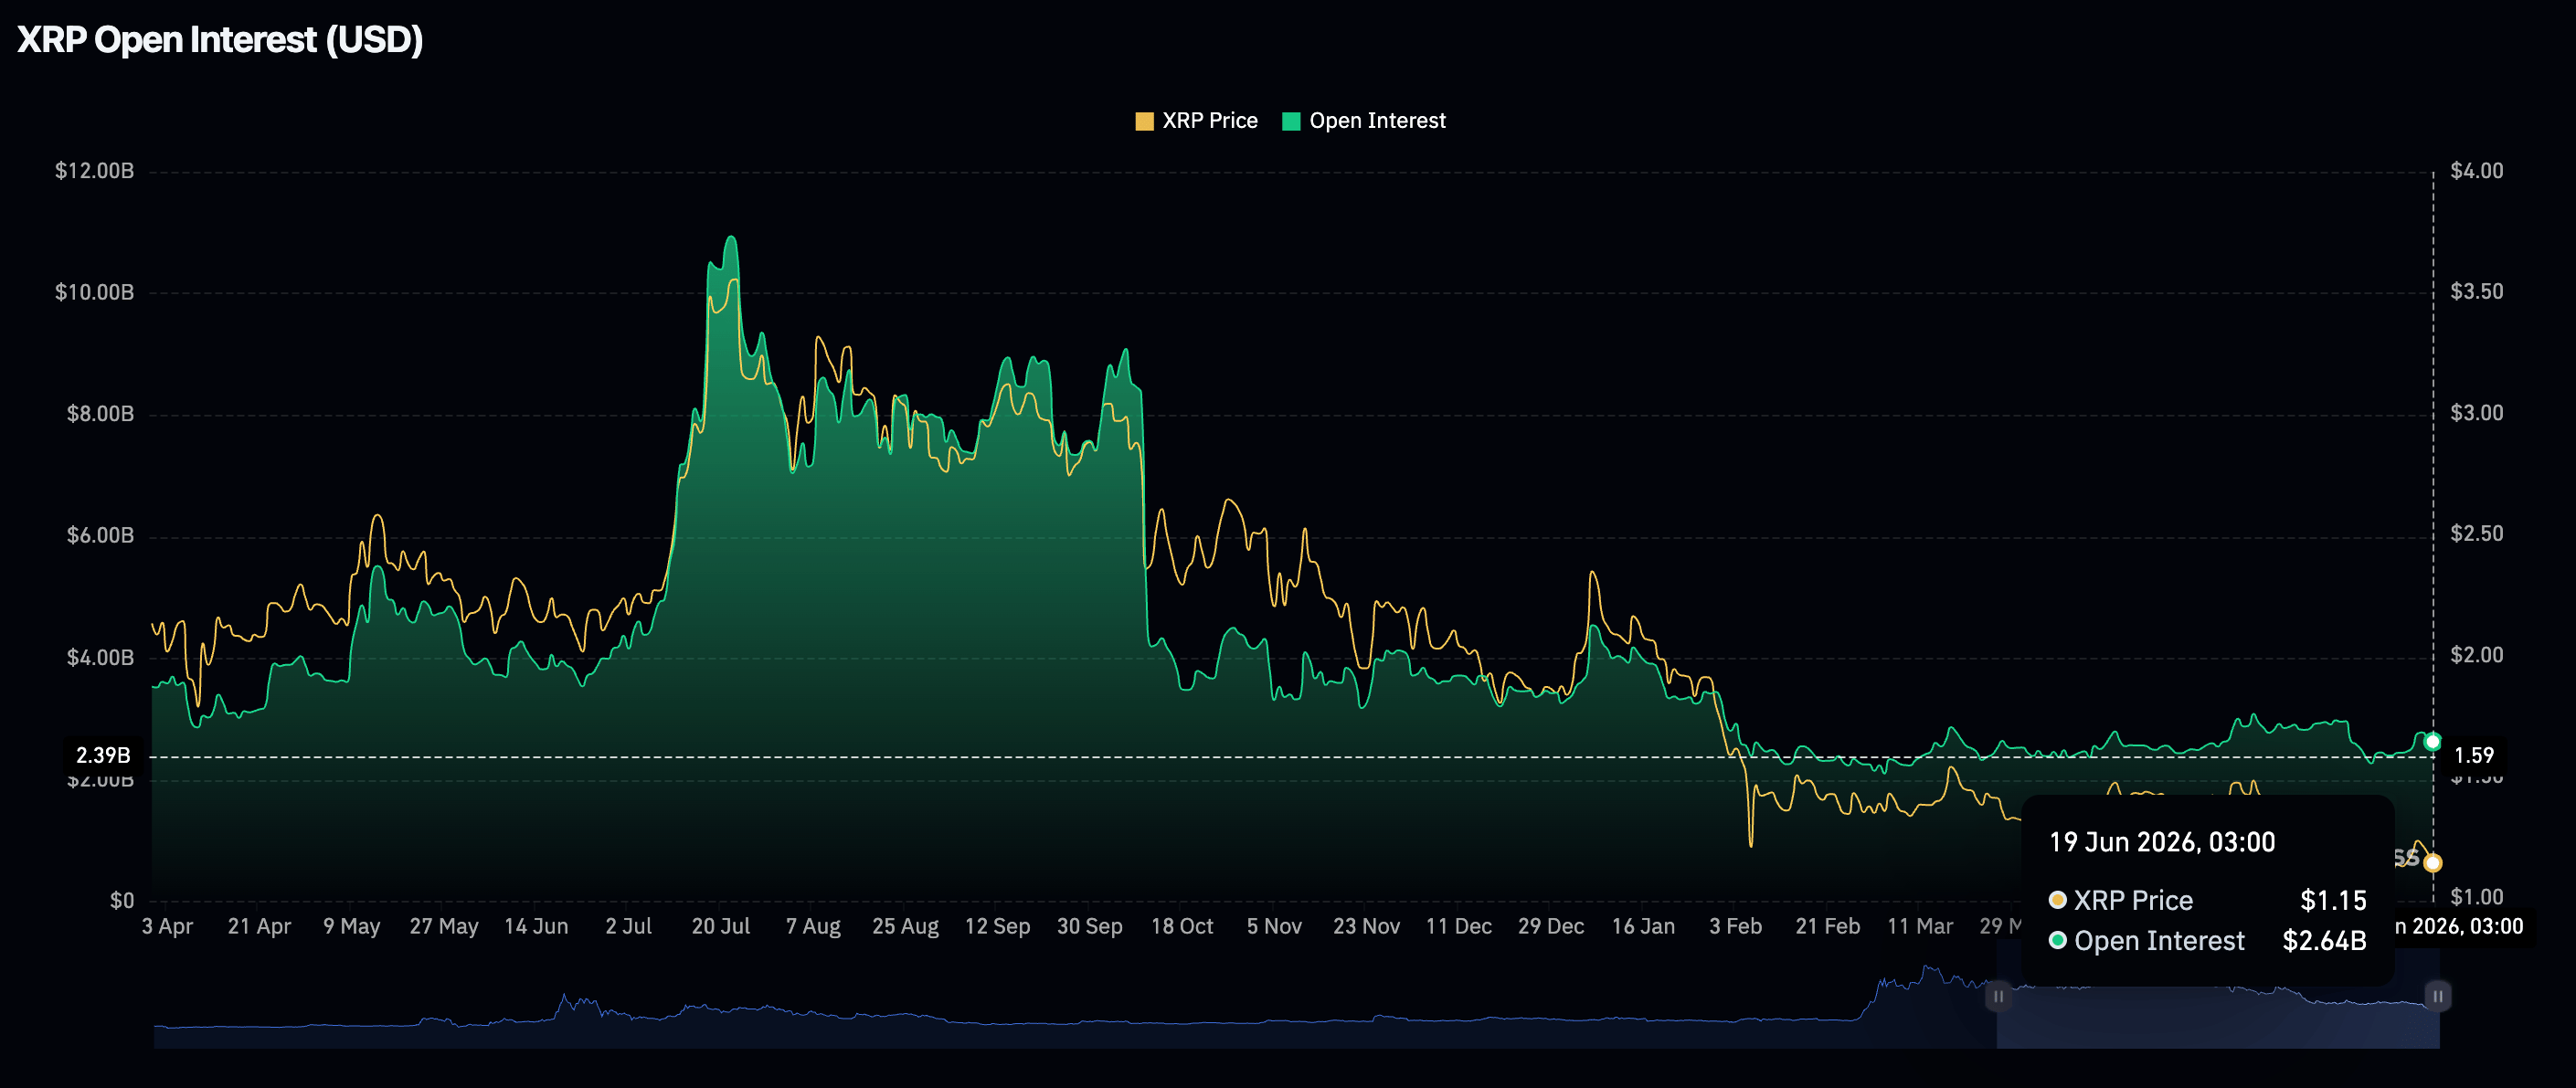
Retail demand has cooled further with futures Open Interest (OI) falling to $2.64 billion on Friday, from $2.77 billion the day before. Since the rejection at $1.28 on Monday, traders have leaned toward reducing exposure, contributing to the selling pressure.
Price analysis: Bitcoin falls as technicals weaken
Bitcoin trades at above $62,500, keeping a bearish near-term tone as it sits beneath a dense band of moving average resistance. The spot price remains below the 50-day Exponential Moving Average (EMA) at $69,715 the 100-day EMA at $72,610 and the 200-day EMA at $77,977, suggesting rallies are likely to be capped while these levels stay overhead.
The Bollinger Bands show BTC trading below the midline at $64,549, with the upper band much higher at $70,812, underscoring a corrective structure.
Meanwhile, the Moving Average Convergence Divergence (MACD) histogram is in positive territory on the daily chart, while the Money Flow Index (MFI) near 54 signals neutral-to-firm buying interest.
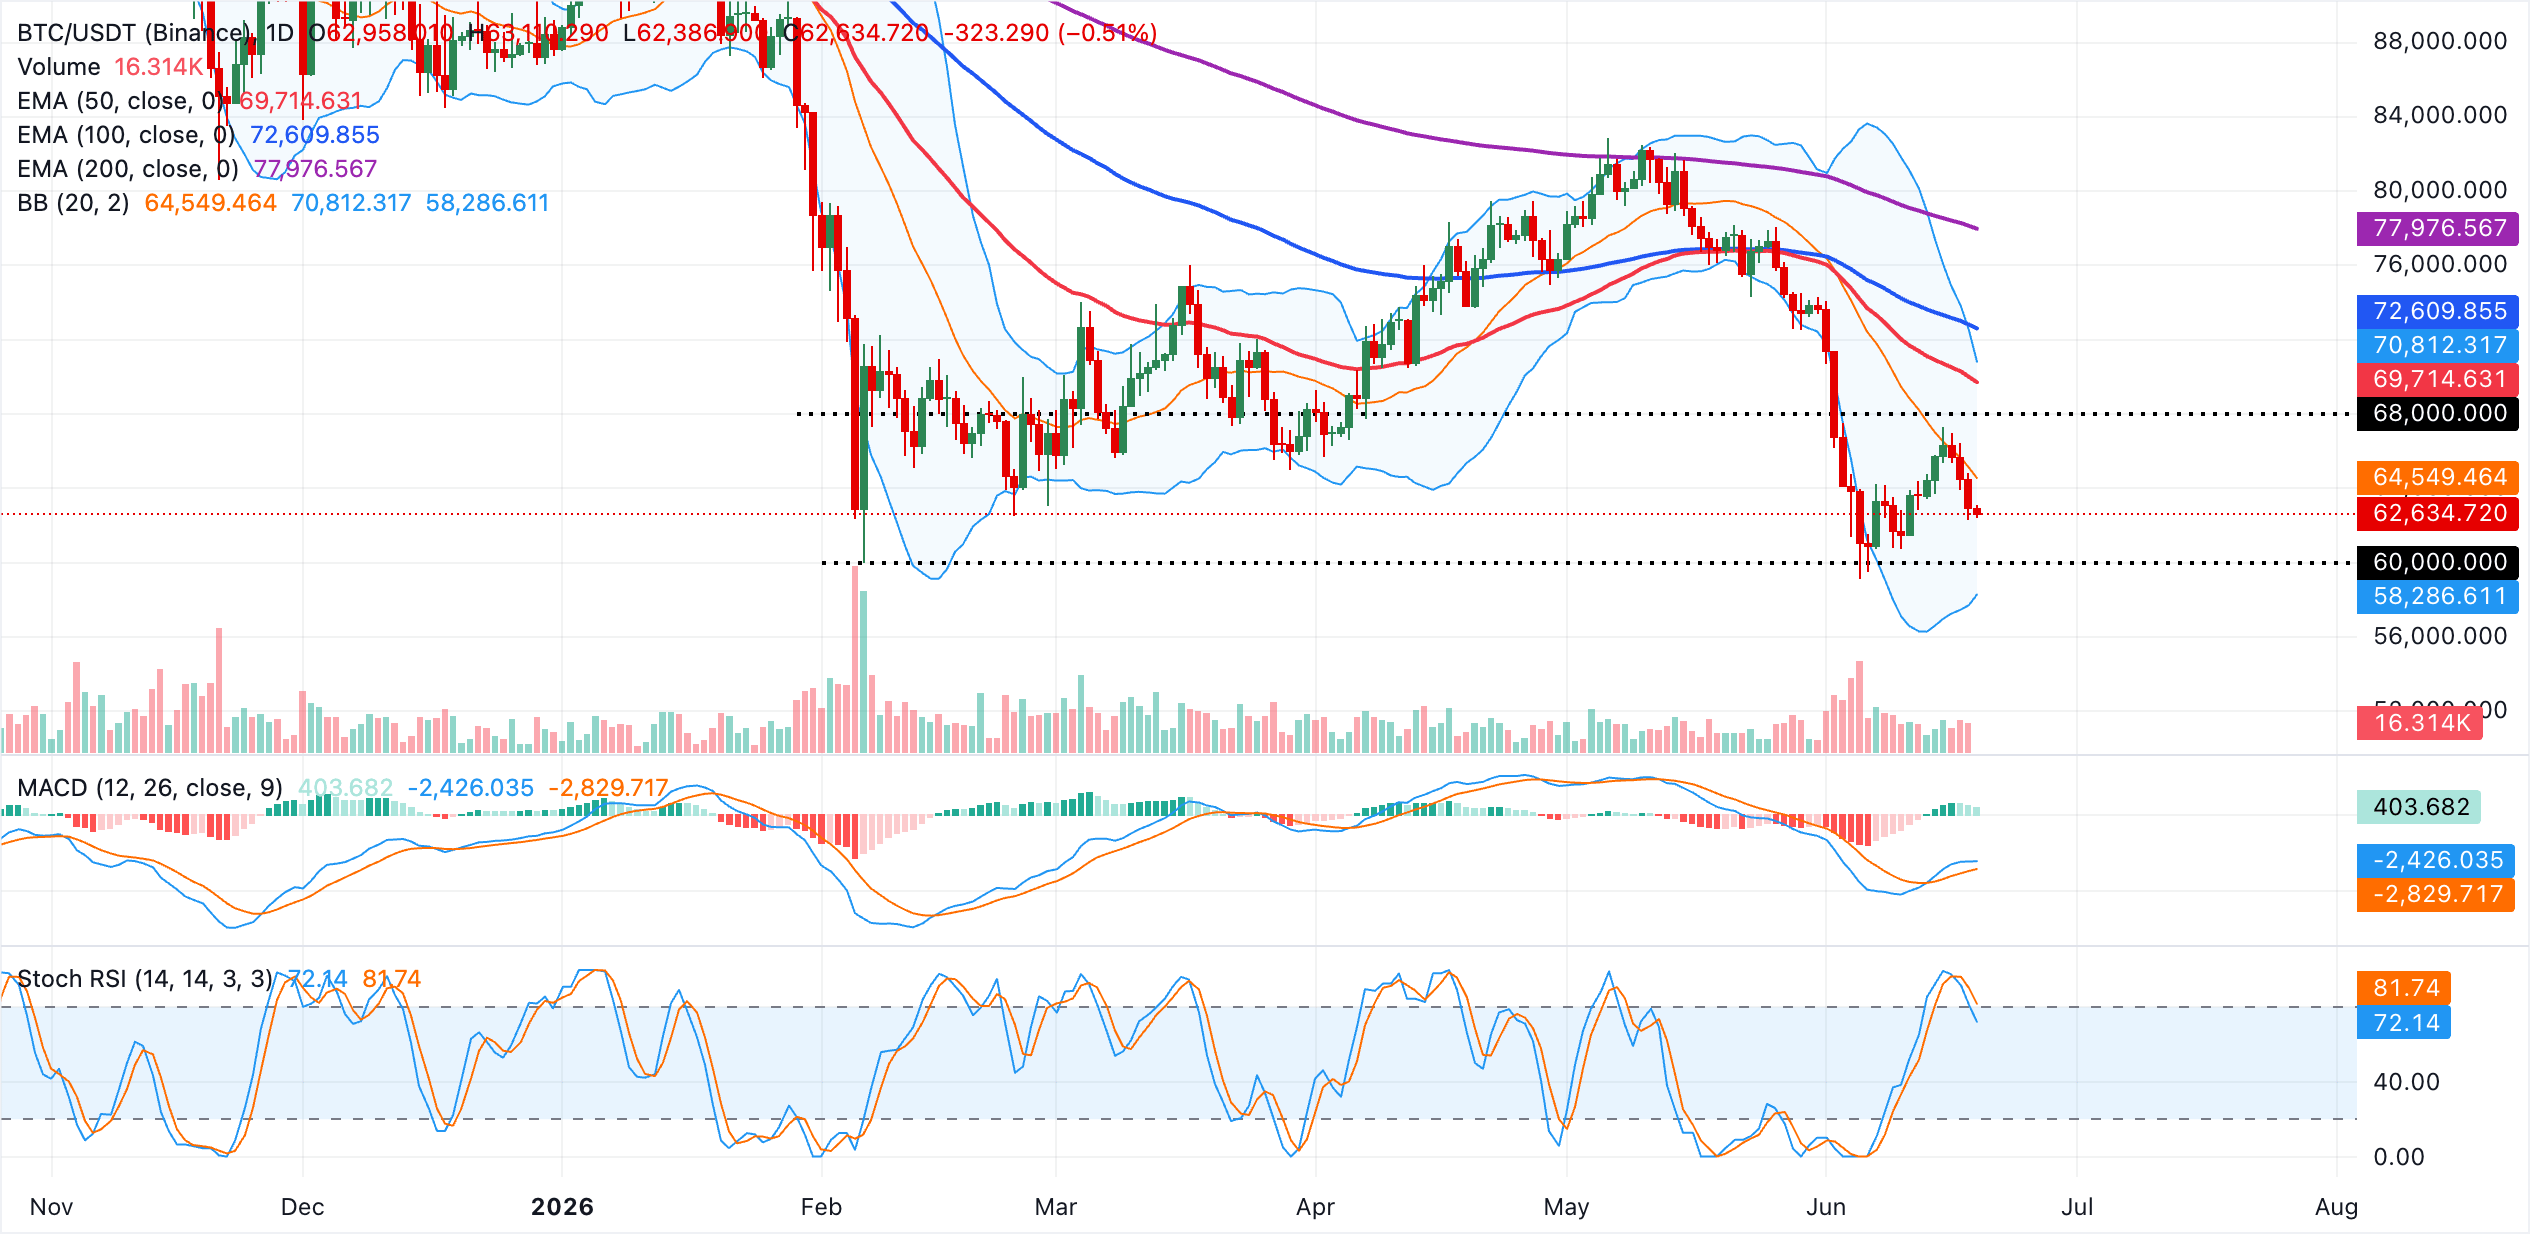
On the topside, initial resistance lies at the Bollinger midline band around $64,549, followed by the 50-day EMA near $69,715 and the Bollinger upper band close to $70,812. Beyond that level, the 100-day EMA at $72,610 and the 200-day EMA near $77,977 form a broader bearish barrier that would need to be reclaimed to negate the current downside bias.
Looking down, the first notable support lies at $60,000, a psychological level, followed by the Bollinger lower band at roughly $58,287, where buyers could attempt to stabilize the decline if selling pressure resumes.
Altcoins technical outlook: Ethereum and XRP risk a deeper bearish leg
Ethereum trades at $1,695, extending a bearish bias as price holds well under the 50-day, 100-day and 200-day EMAs clustered from roughly $1,934 to $2,359. The MACD has turned firmly positive with the histogram above zero on the daily chart, hinting at improving momentum, but this recovery remains capped while spot trades beneath the stacked daily EMAs.
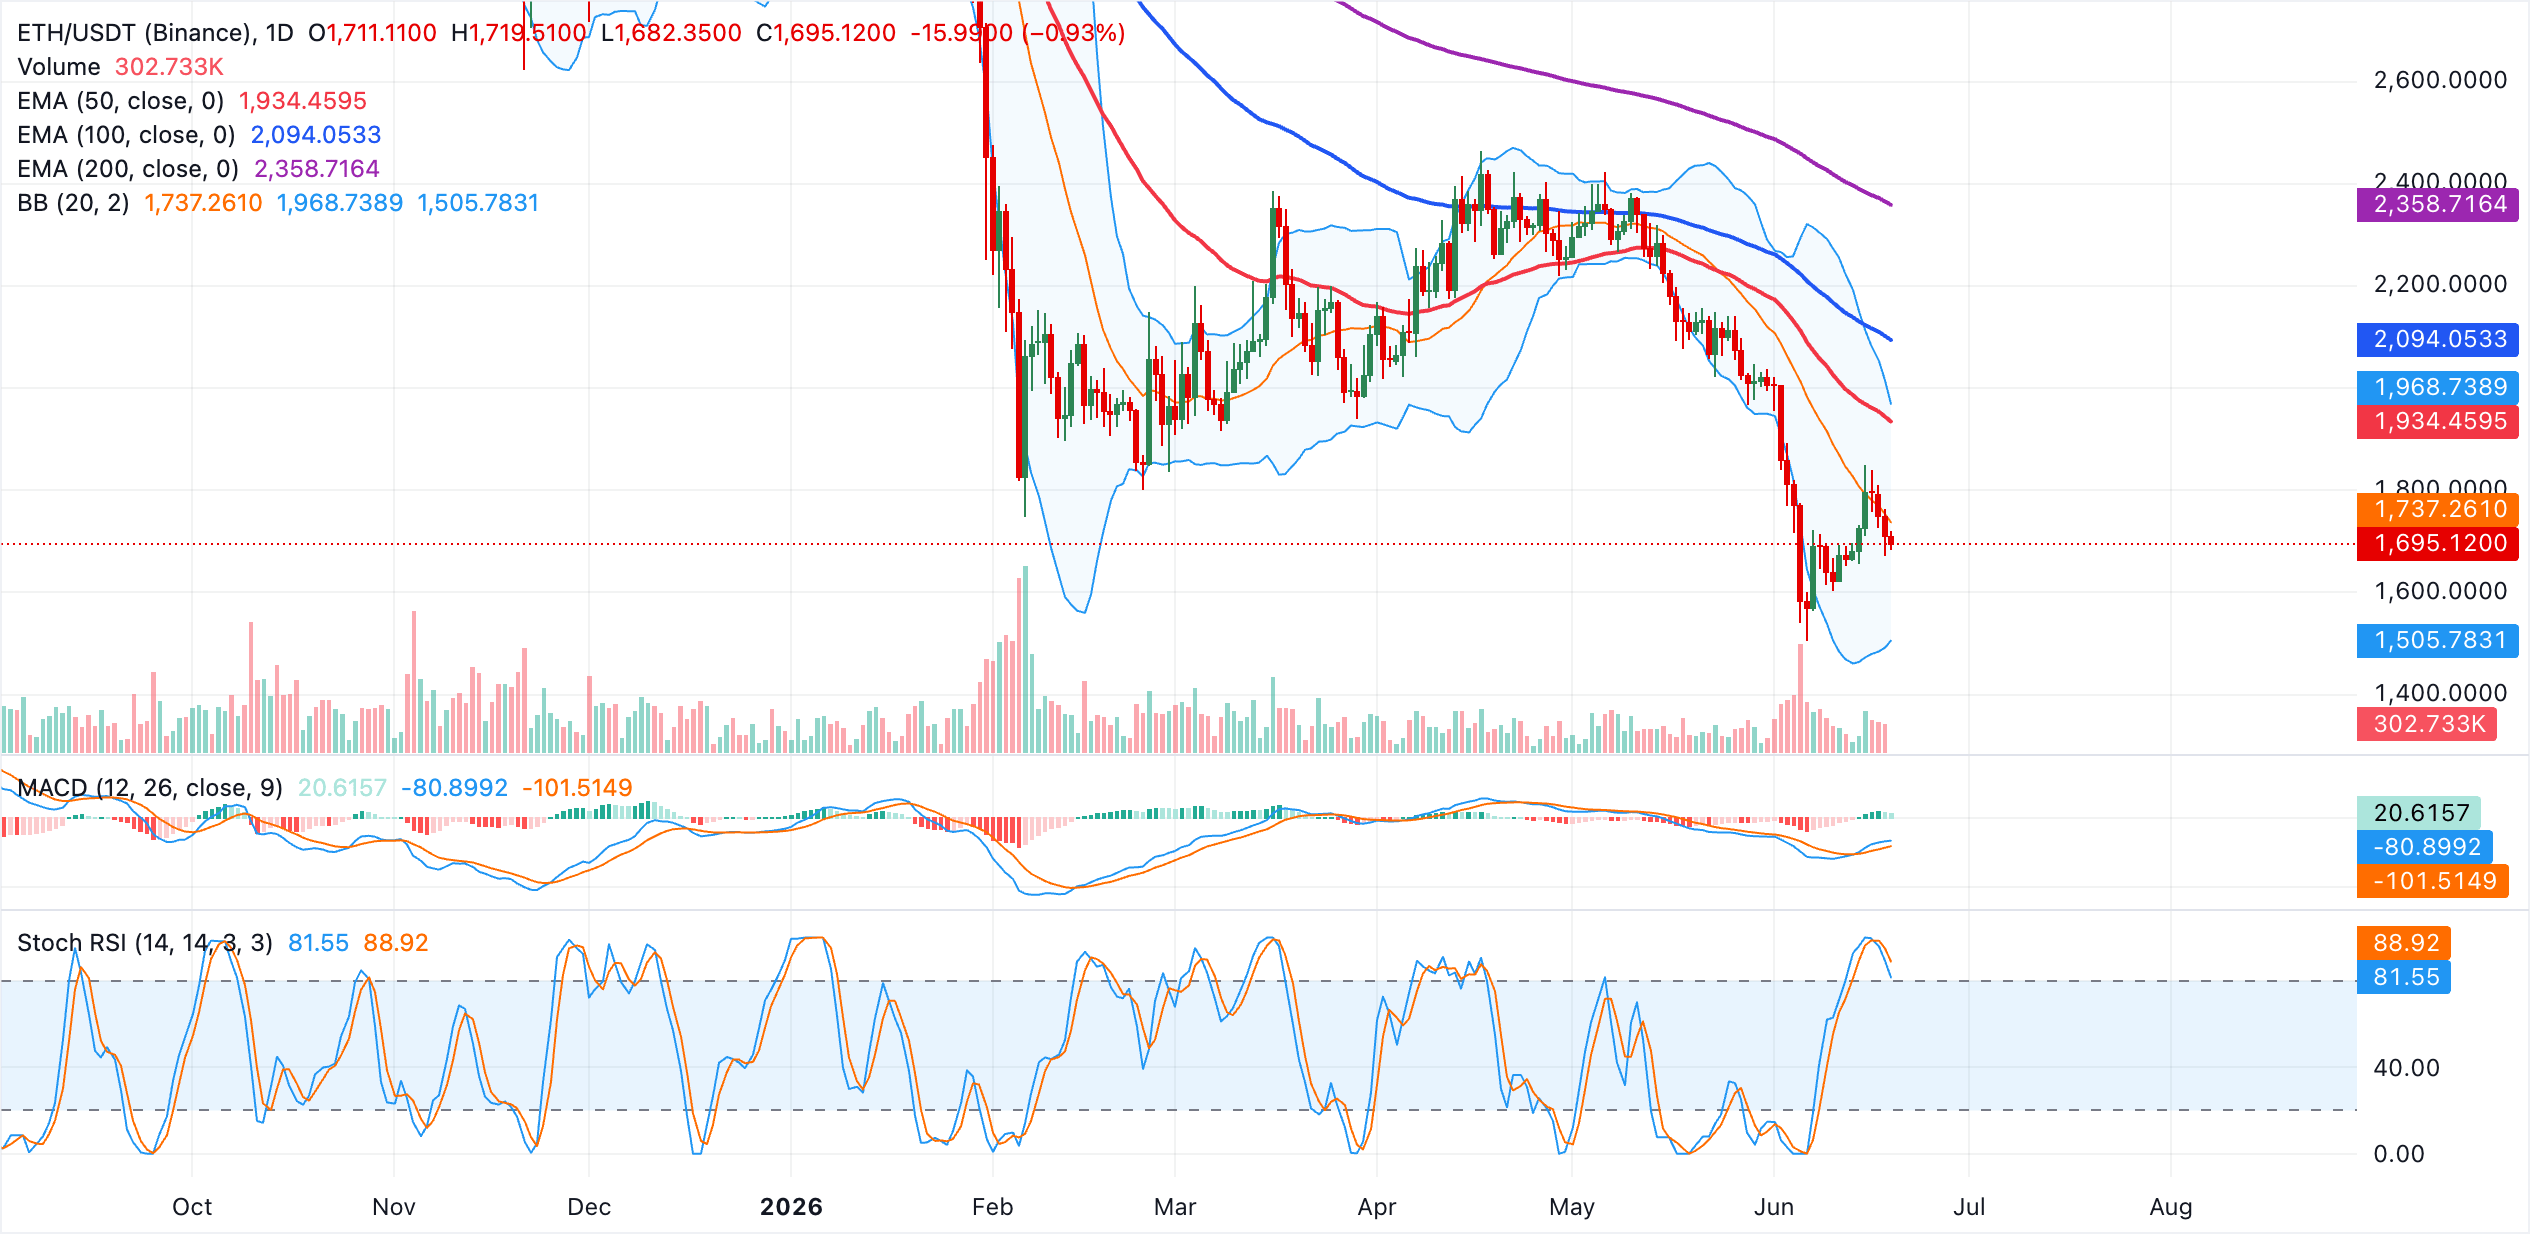
On the topside, initial resistance is seen at the Bollinger middle band near $1,737, with further hurdles at the Bollinger upper band around $1,969, followed by the 50-day EMA near $1,934 and the more significant 100-day and 200-day EMAs at approximately $2,094 and $2,359 respectively.
The Bollinger lower band at about $1,506 forms the next notable support, and a decisive break beneath this zone would likely expose ETH to a deeper corrective phase despite the currently constructive MACD backdrop.
XRP, on the other hand, trades above $1.12. The pair sits below the 50-day, 100-day and 200-day EMAs at $1.27, $1.36 and $1.58 respectively, keeping the broader technical tone bearish despite the recent bounce. Momentum retains an improved structure, with the MACD histogram slightly positive on the daily chart and the Stochastic Relative Strength Index (RSI) hovering around 69, hinting that the latest recovery could extend but remains constrained by a dense overhead supply zone.
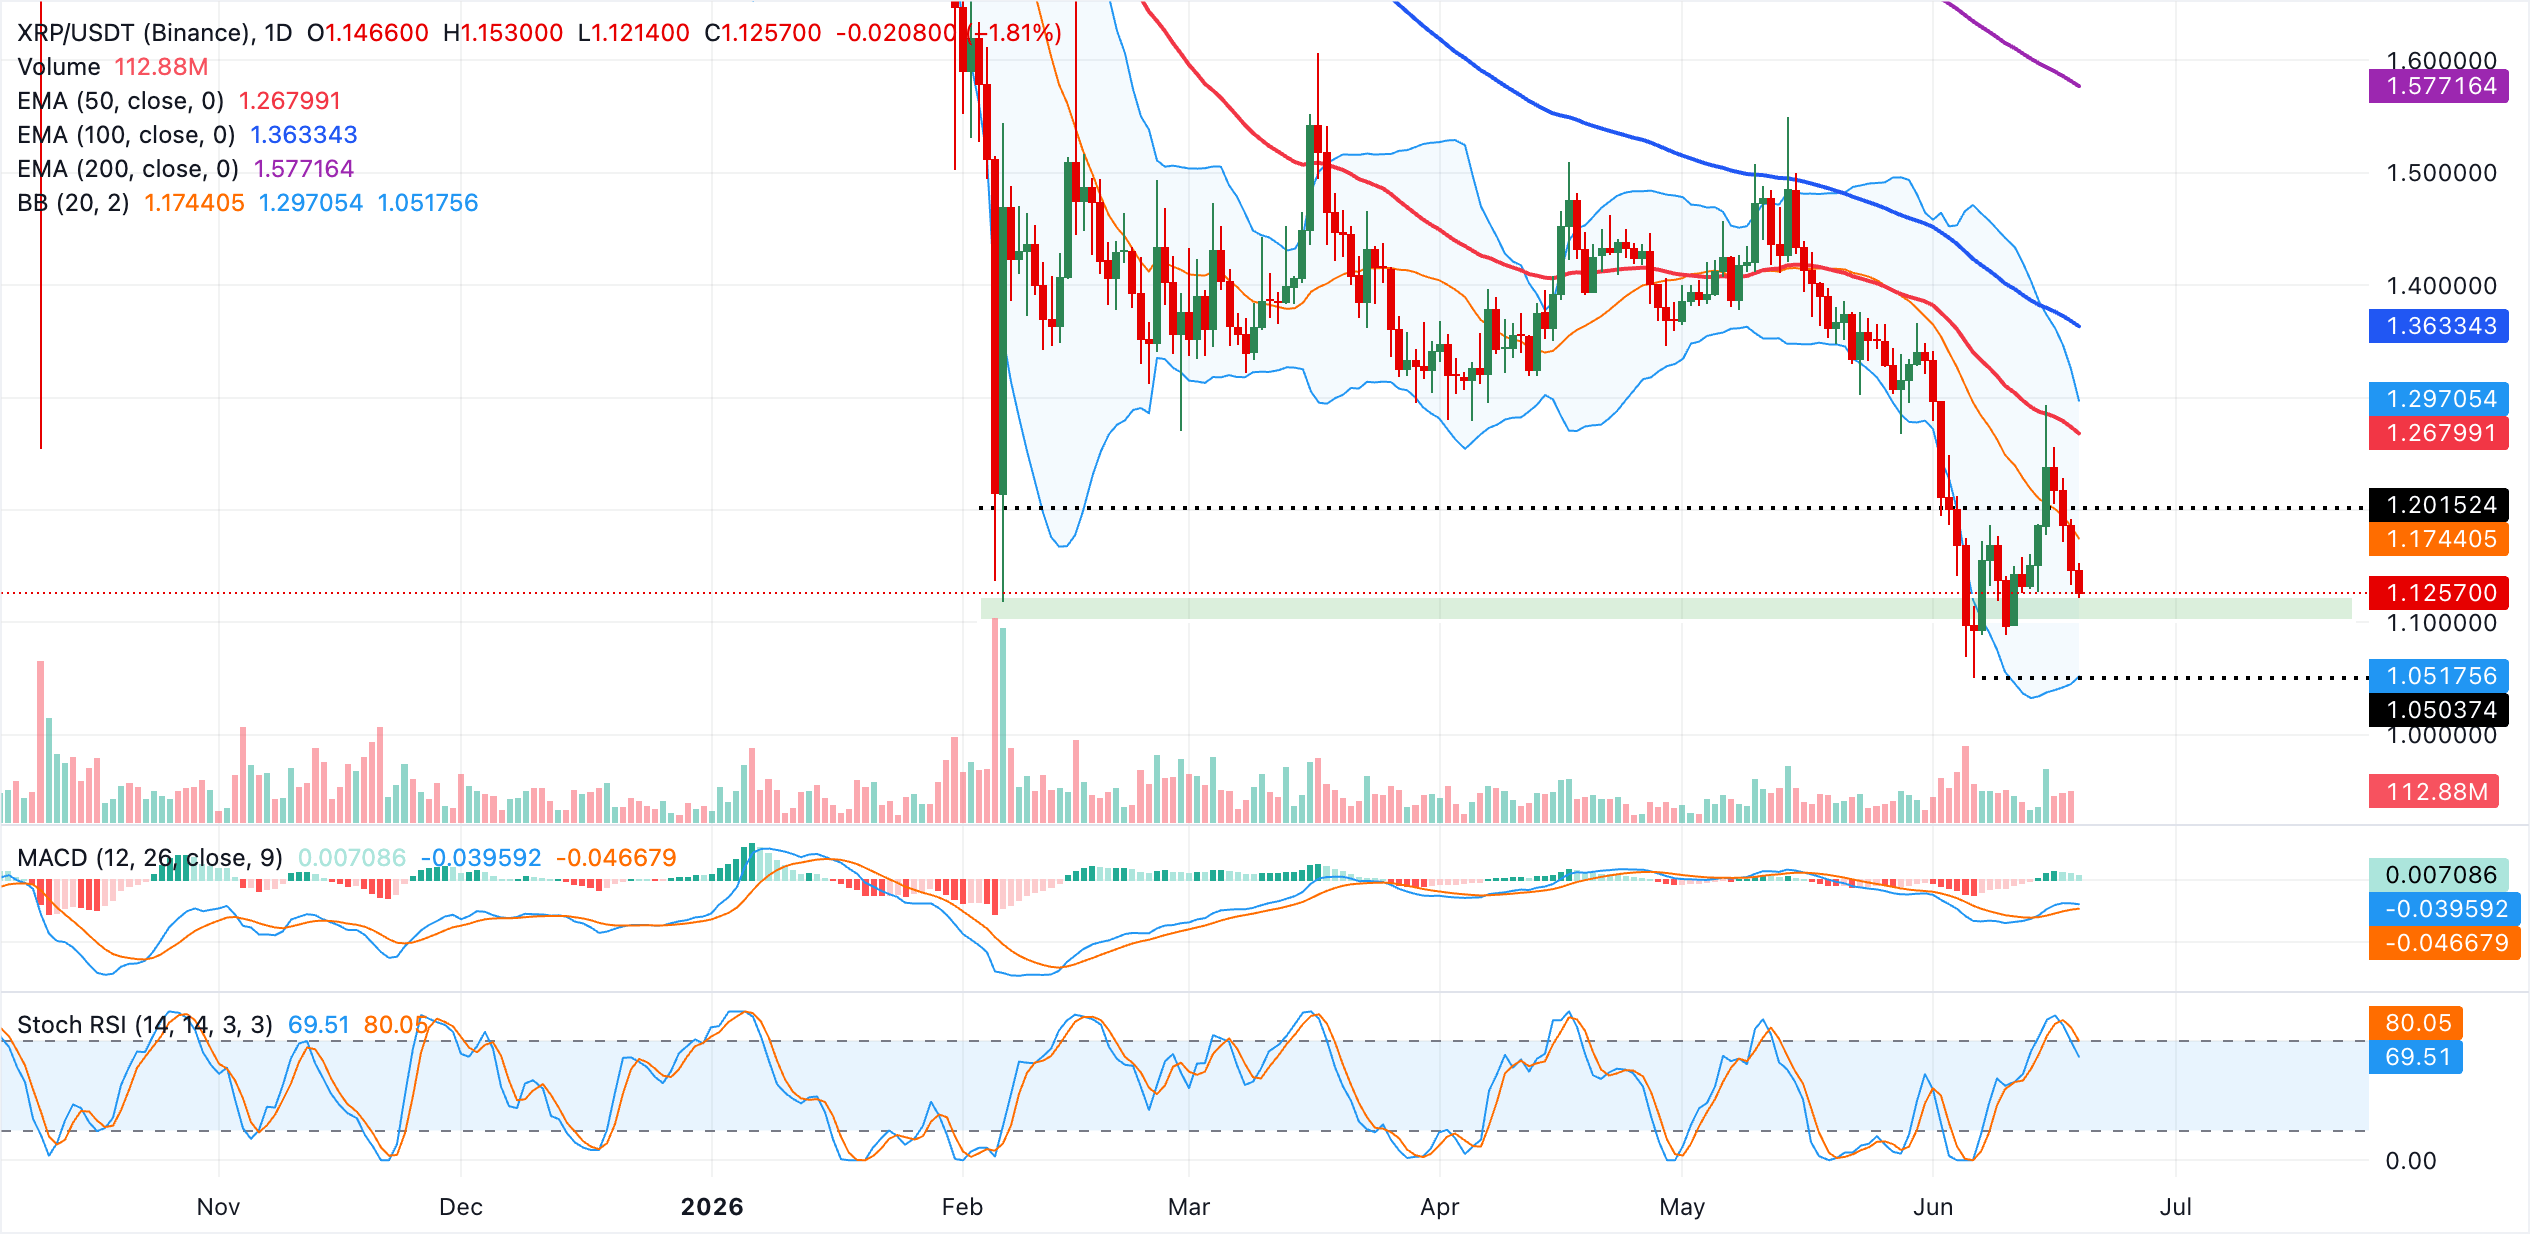
XRP's initial resistance is aligned with the Bollinger Bands’ middle level near $1.17, with further barriers at the 50-day EMA around $1.27 and the upper Bollinger band close to $1.30. Above that supply range, the 100-day EMA at $1.36 and the 200-day EMA near $1.58 form a broader bearish cap. On the downside, the lower Bollinger band at approximately $1.05 offers the first notable support. A daily close below this line would expose the pair to a deeper corrective phase.
(The technical analysis of this story was written with the help of an AI tool.)
Bitcoin, altcoins, stablecoins FAQs
Bitcoin is the largest cryptocurrency by market capitalization, a virtual currency designed to serve as money. This form of payment cannot be controlled by any one person, group, or entity, which eliminates the need for third-party participation during financial transactions.
Altcoins are any cryptocurrency apart from Bitcoin, but some also regard Ethereum as a non-altcoin because it is from these two cryptocurrencies that forking happens. If this is true, then Litecoin is the first altcoin, forked from the Bitcoin protocol and, therefore, an “improved” version of it.
Stablecoins are cryptocurrencies designed to have a stable price, with their value backed by a reserve of the asset it represents. To achieve this, the value of any one stablecoin is pegged to a commodity or financial instrument, such as the US Dollar (USD), with its supply regulated by an algorithm or demand. The main goal of stablecoins is to provide an on/off-ramp for investors willing to trade and invest in cryptocurrencies. Stablecoins also allow investors to store value since cryptocurrencies, in general, are subject to volatility.
Bitcoin dominance is the ratio of Bitcoin's market capitalization to the total market capitalization of all cryptocurrencies combined. It provides a clear picture of Bitcoin’s interest among investors. A high BTC dominance typically happens before and during a bull run, in which investors resort to investing in relatively stable and high market capitalization cryptocurrency like Bitcoin. A drop in BTC dominance usually means that investors are moving their capital and/or profits to altcoins in a quest for higher returns, which usually triggers an explosion of altcoin rallies.

Hơn một triệu người dùng dựa vào FXStreet để có dữ liệu thị trường thời gian thực, công cụ biểu đồ, góc nhìn chuyên gia và tin tức Forex. Lịch kinh tế toàn diện và các hội thảo web giáo dục giúp nhà giao dịch luôn cập nhật và đưa ra quyết định có tính toán. FXStreet có khoảng 60 nhân sự, chia giữa trụ sở Barcelona và nhiều khu vực toàn cầu.
Đọc thêm


