
Crypto Today: Bitcoin leads recovery, while Ethereum and XRP try to shake off the bearish pressure
Bởi Vishal Dixit
Đã cập nhật: 1 May 2026


BÀI VIẾT PHỔ BIẾN

The broader cryptocurrency market shows a mild recovery on Friday, with Bitcoin (BTC) rising above $77,000, up from Wednesday’s low of $74,937. Altcoins, including Ethereum (ETH) and Ripple (XRP), align with Bitcoin’s near-term recovery but lack momentum.
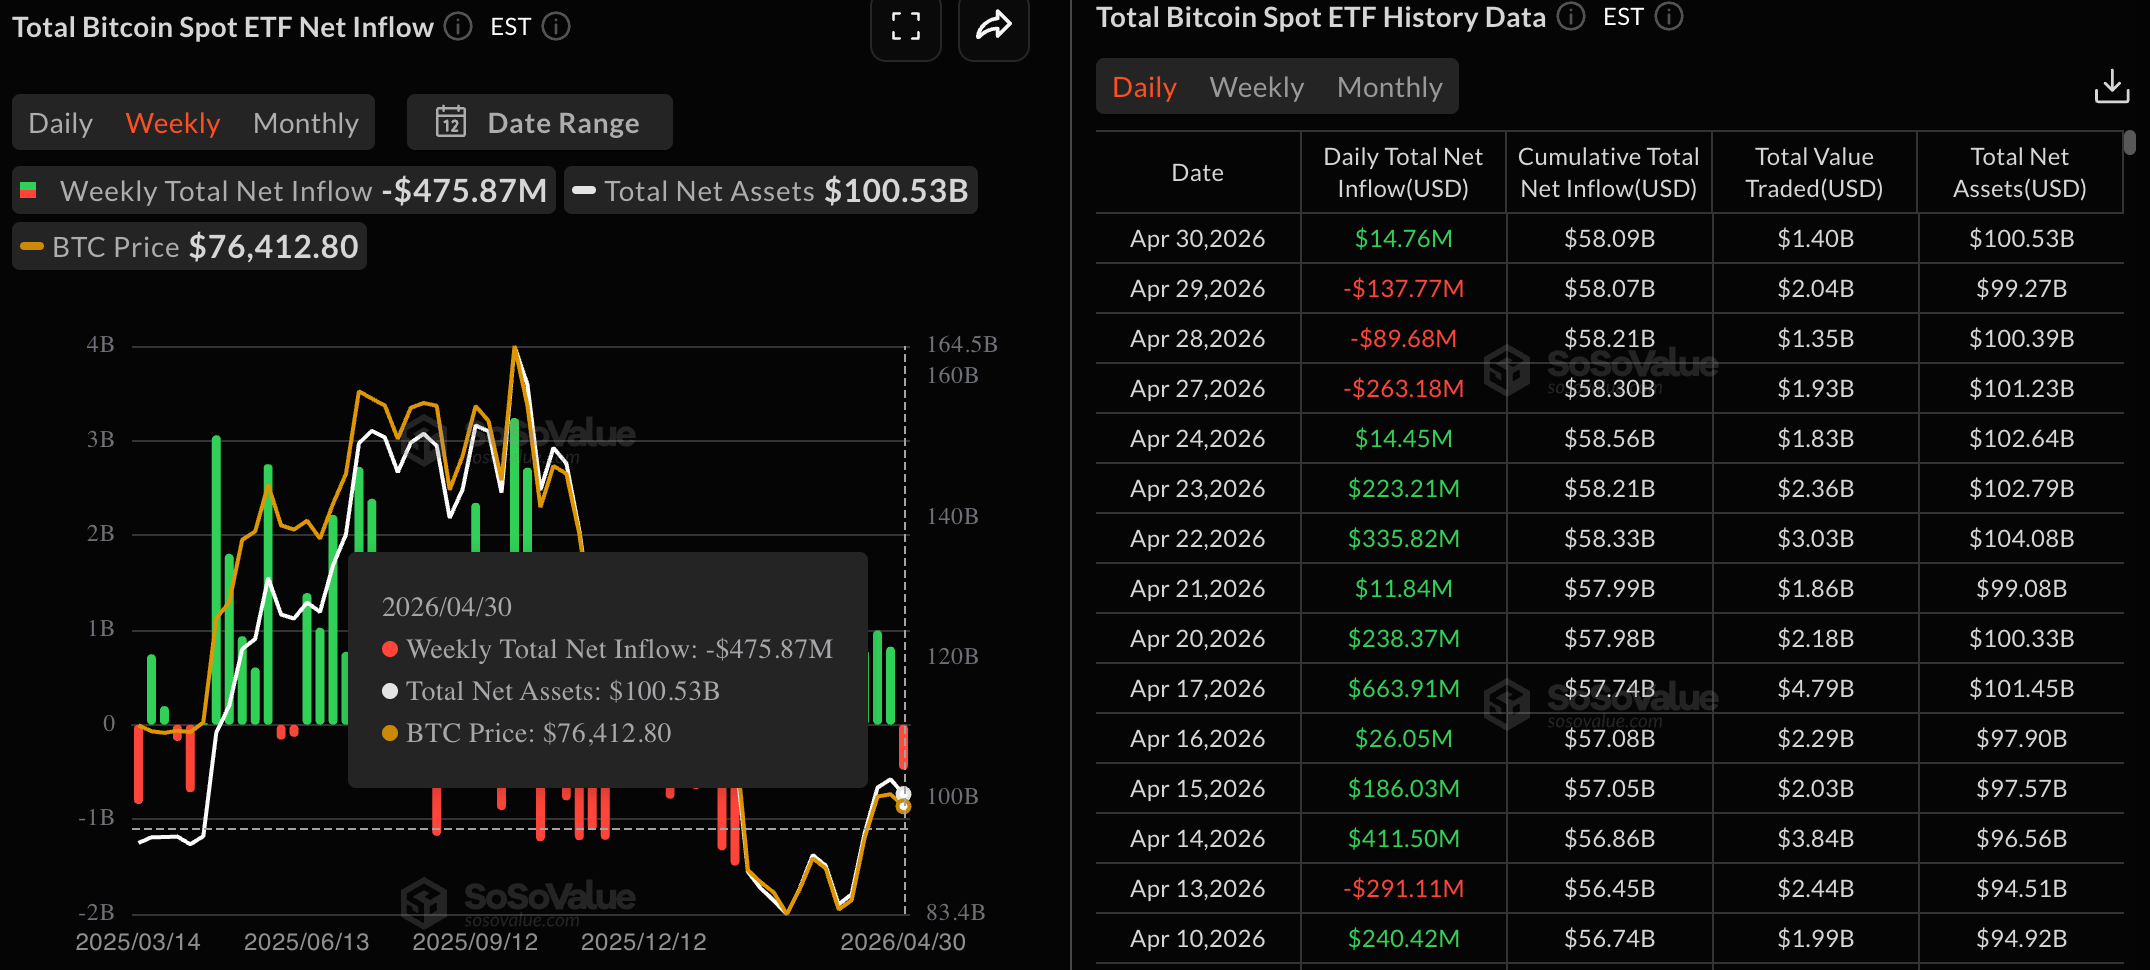
- Bitcoin extends its bounce back from the 100-day EMA, supported by mild ETF inflows after three days of withdrawals.
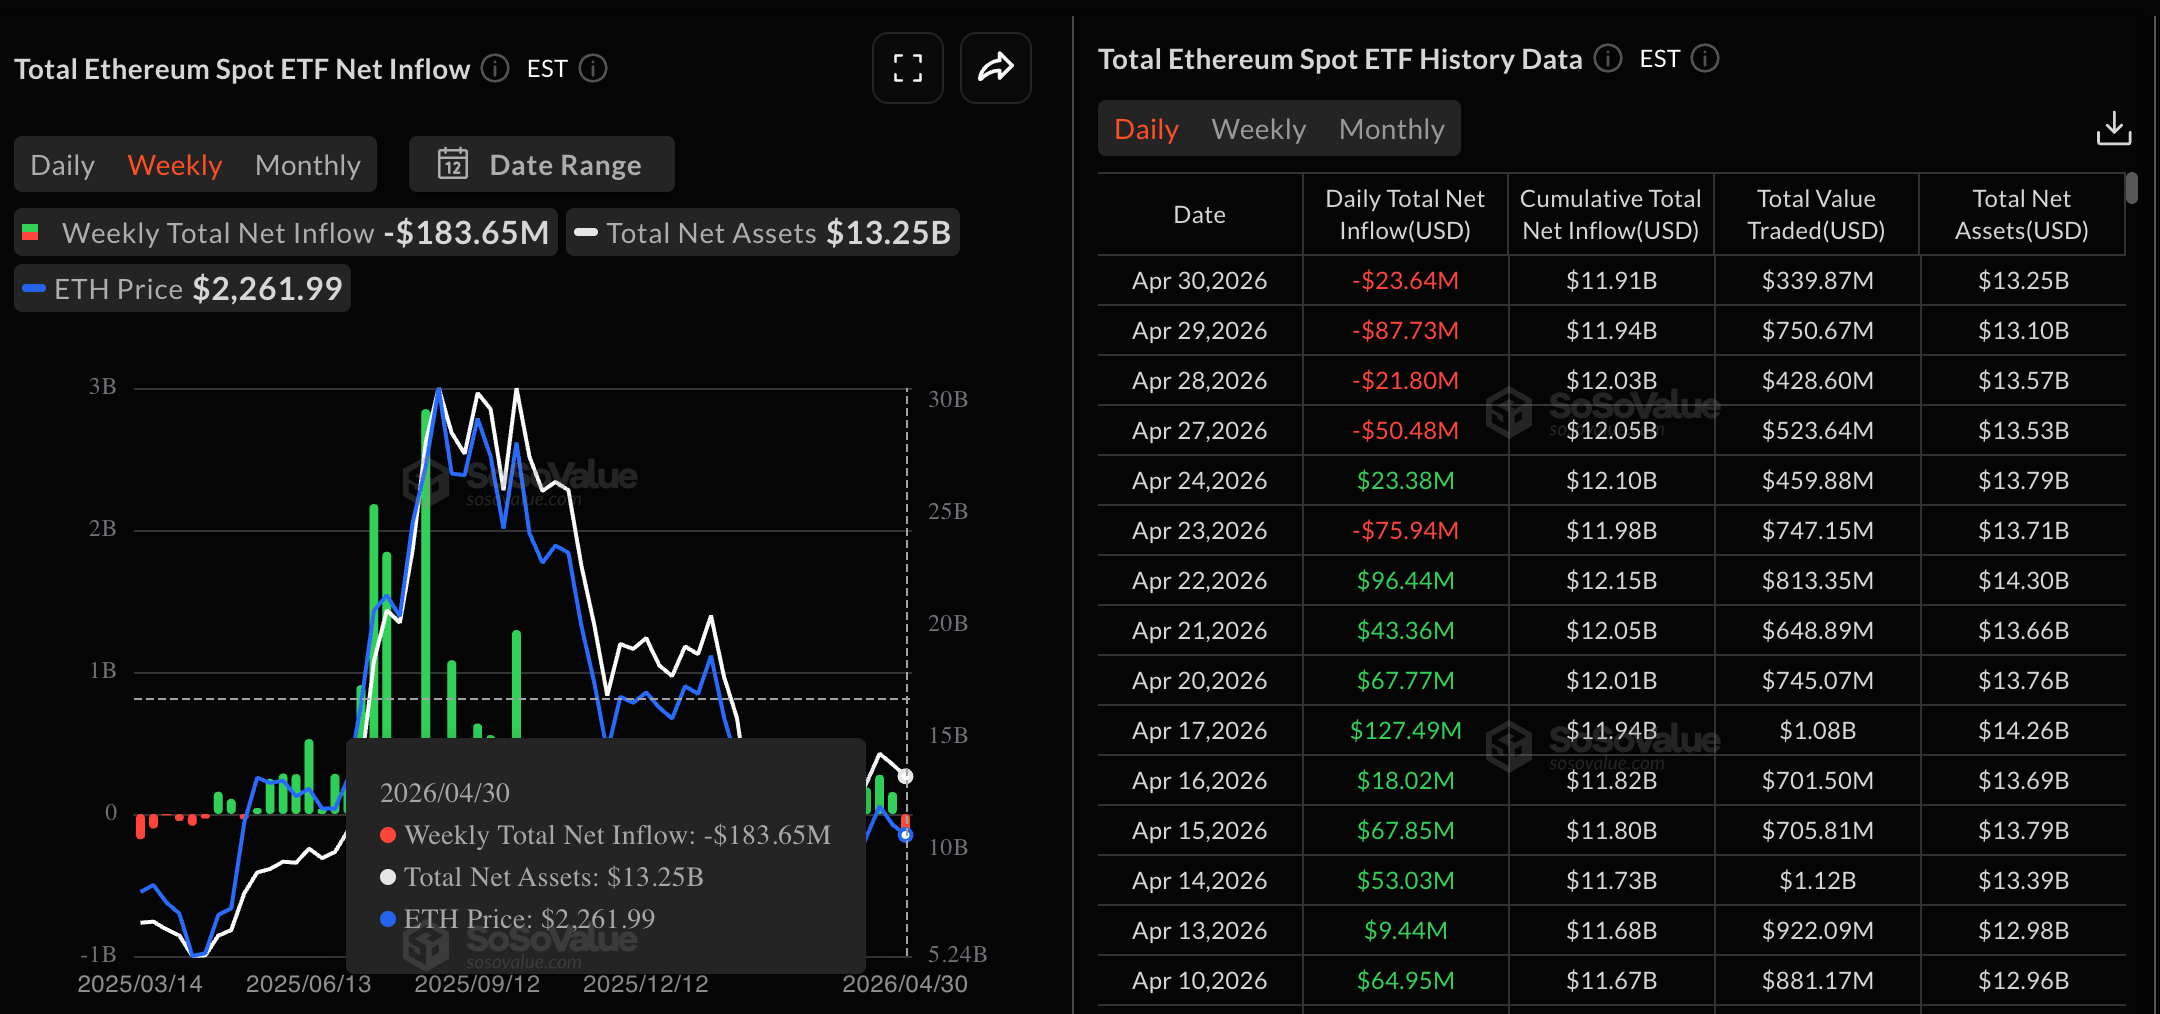
- Ethereum hovers below $2,300, holding above its 50-day EMA, as ETFs record four consecutive days of outflows.
- XRP shows intraday gains so far on Friday, but the downside risks persist after a four-day bearish slump.
The broader cryptocurrency market shows a mild recovery on Friday, with Bitcoin (BTC) rising above $77,000, up from Wednesday’s low of $74,937. Altcoins, including Ethereum (ETH) and Ripple (XRP), align with Bitcoin’s near-term recovery but lack momentum.
Ethereum hovers below $2,300 while XRP trades around $1.38 as bulls attempt at tightening their grip.
Institutional demand rises for Bitcoin while altcoins ETFs lag
Bitcoin spot Exchange Traded Funds (ETFs) recorded $14.76 million in inflow on Thursday after three days of outflows earlier in the week, limiting the weekly outflow to $475.87 million. A potential inflow on Friday could further ease institutional downside pressure, but an outflow could nudge markets down on the weekend.
On the other hand, Ethereum ETFs have recorded four consecutive days of outflows so far this week, amounting to a total of $183.65 through Thursday. Still, the cumulative inflows stand at $11.91 billion, maintaining a long-term confidence with net assets under management at $13.25 billion.
Meanwhile, the XRP ETFs erased the weekly inflows, recording $5.83 million in outflows on Thursday, while net assets under management remain at $1.04 billion, with cumulative flows totaling $1.29 billion.
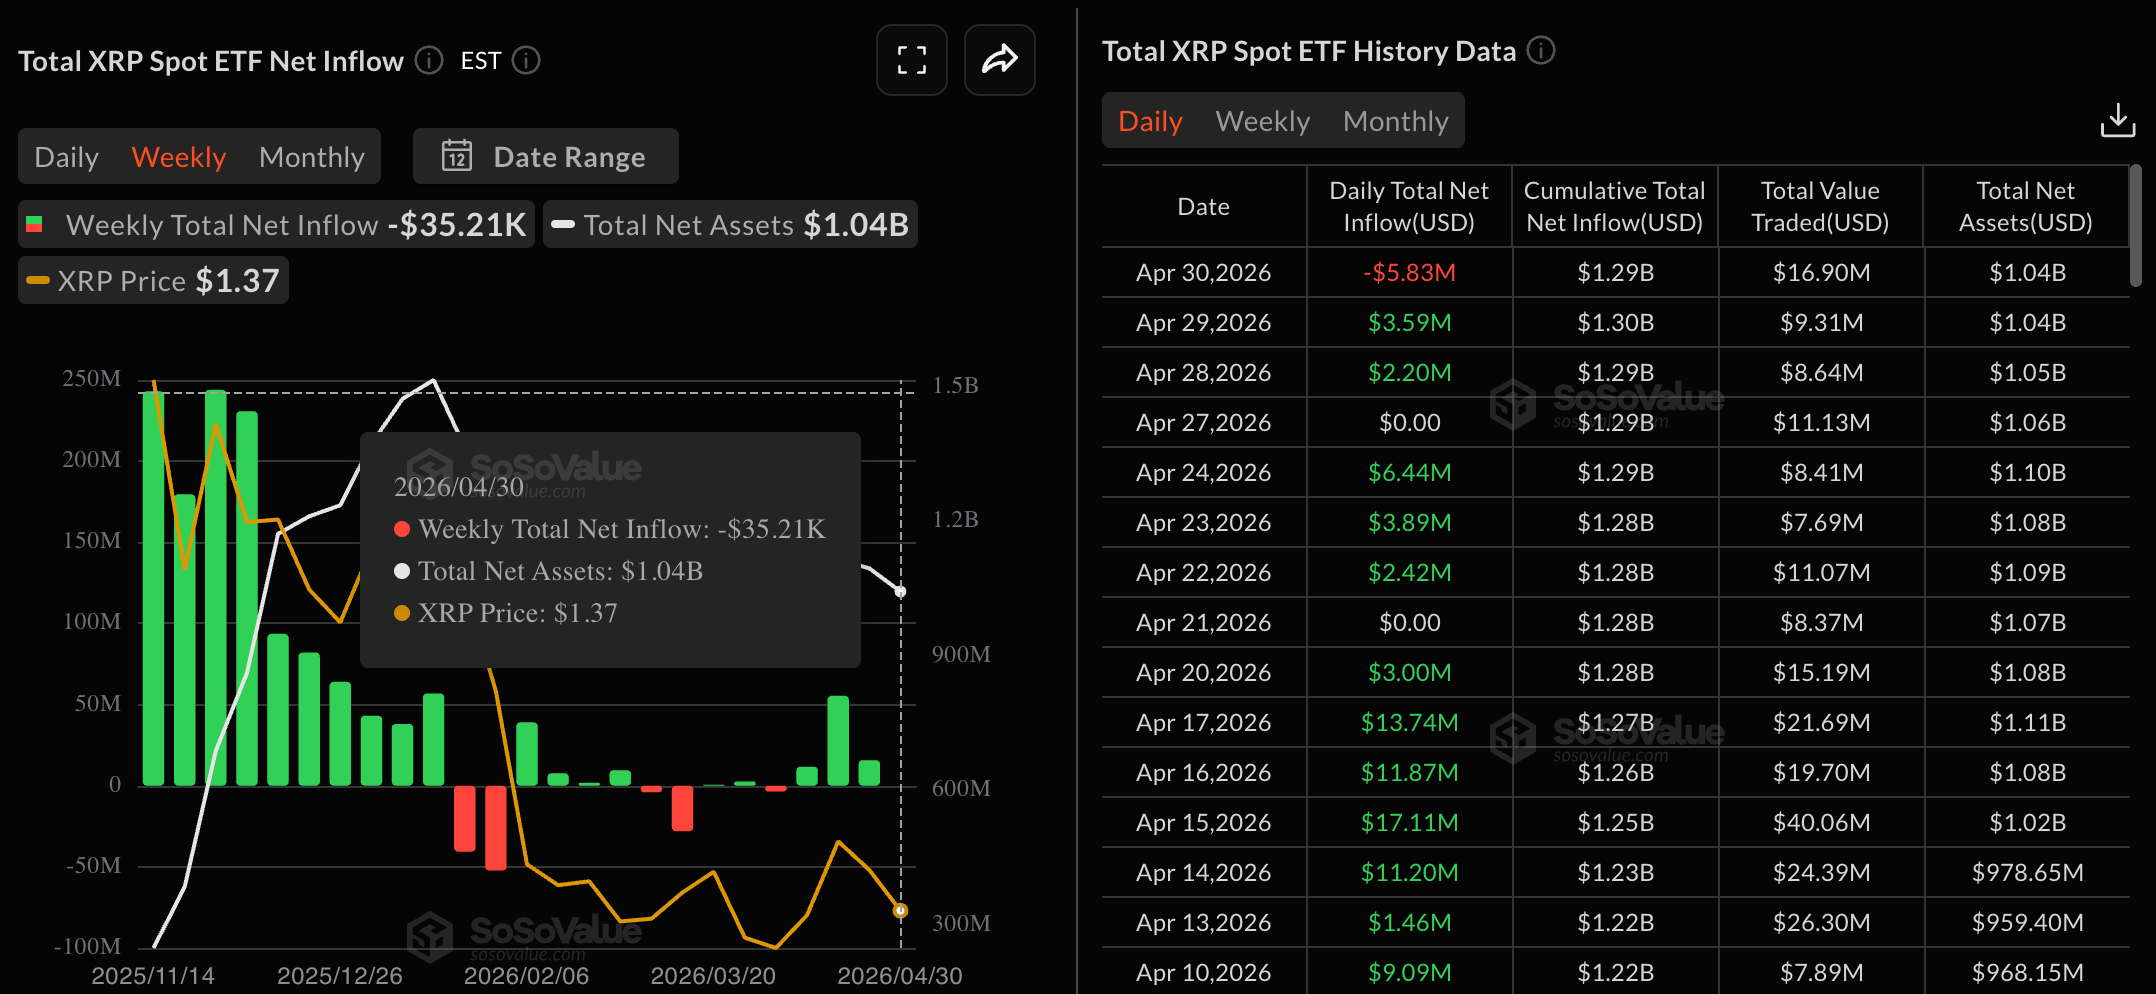
Chart of the day: Bitcoin extends rebound as momentum builds
Bitcoin retains a bullish near-term bias as price holds well above the 50-day and 100-day Exponential Moving Averages (EMAs) at roughly $73,815 and $75,751. This positioning suggests the broader uptrend remains intact despite a recent loss of momentum.
The Relative Strength Index (RSI) at 58 on the daily chart is in constructive but not overbought territory, while the Moving Average Convergence Divergence (MACD) line has slipped below the signal line, flipping the histograms to negative. This hints at a corrective phase within the prevailing bullish structure rather than a full-fledged trend reversal.
Looking up, the 200-day EMA near $82,658 is the next significant resistance close to a rising trendline that bulls would need to reclaim to extend the advance toward fresh highs.
On the flip side, initial support is seen around the 100-day EMA at $75,751, followed by the 50-day EMA at $73,815, with the prior uptrend support region around $68,737 likely to act as a deeper structural floor if profit-taking accelerates.
Altcoins technical outlook: Ethereum and XRP show a slow recovery
Ethereum is holding above the 50-period Exponential Moving Average (EMA) at $2,245 at press time on Friday, but still well below the 200-period EMA at $2,560, which keeps the broader trend capped while allowing a modest constructive tone in the near term.
The RSI at 51 hints at neutral to slightly positive momentum, though the MACD line declines below the signal line with expanding negative histogram bars, suggesting that upside attempts may lack strong follow-through for now.
On the topside, initial resistance is seen at the 50% Fibonacci retracement of the broader downswing near $2,597, close to the 200-day EMA higher up at $2,560 acting as a more significant barrier that would need to be reclaimed to revive a sustained bullish trend.
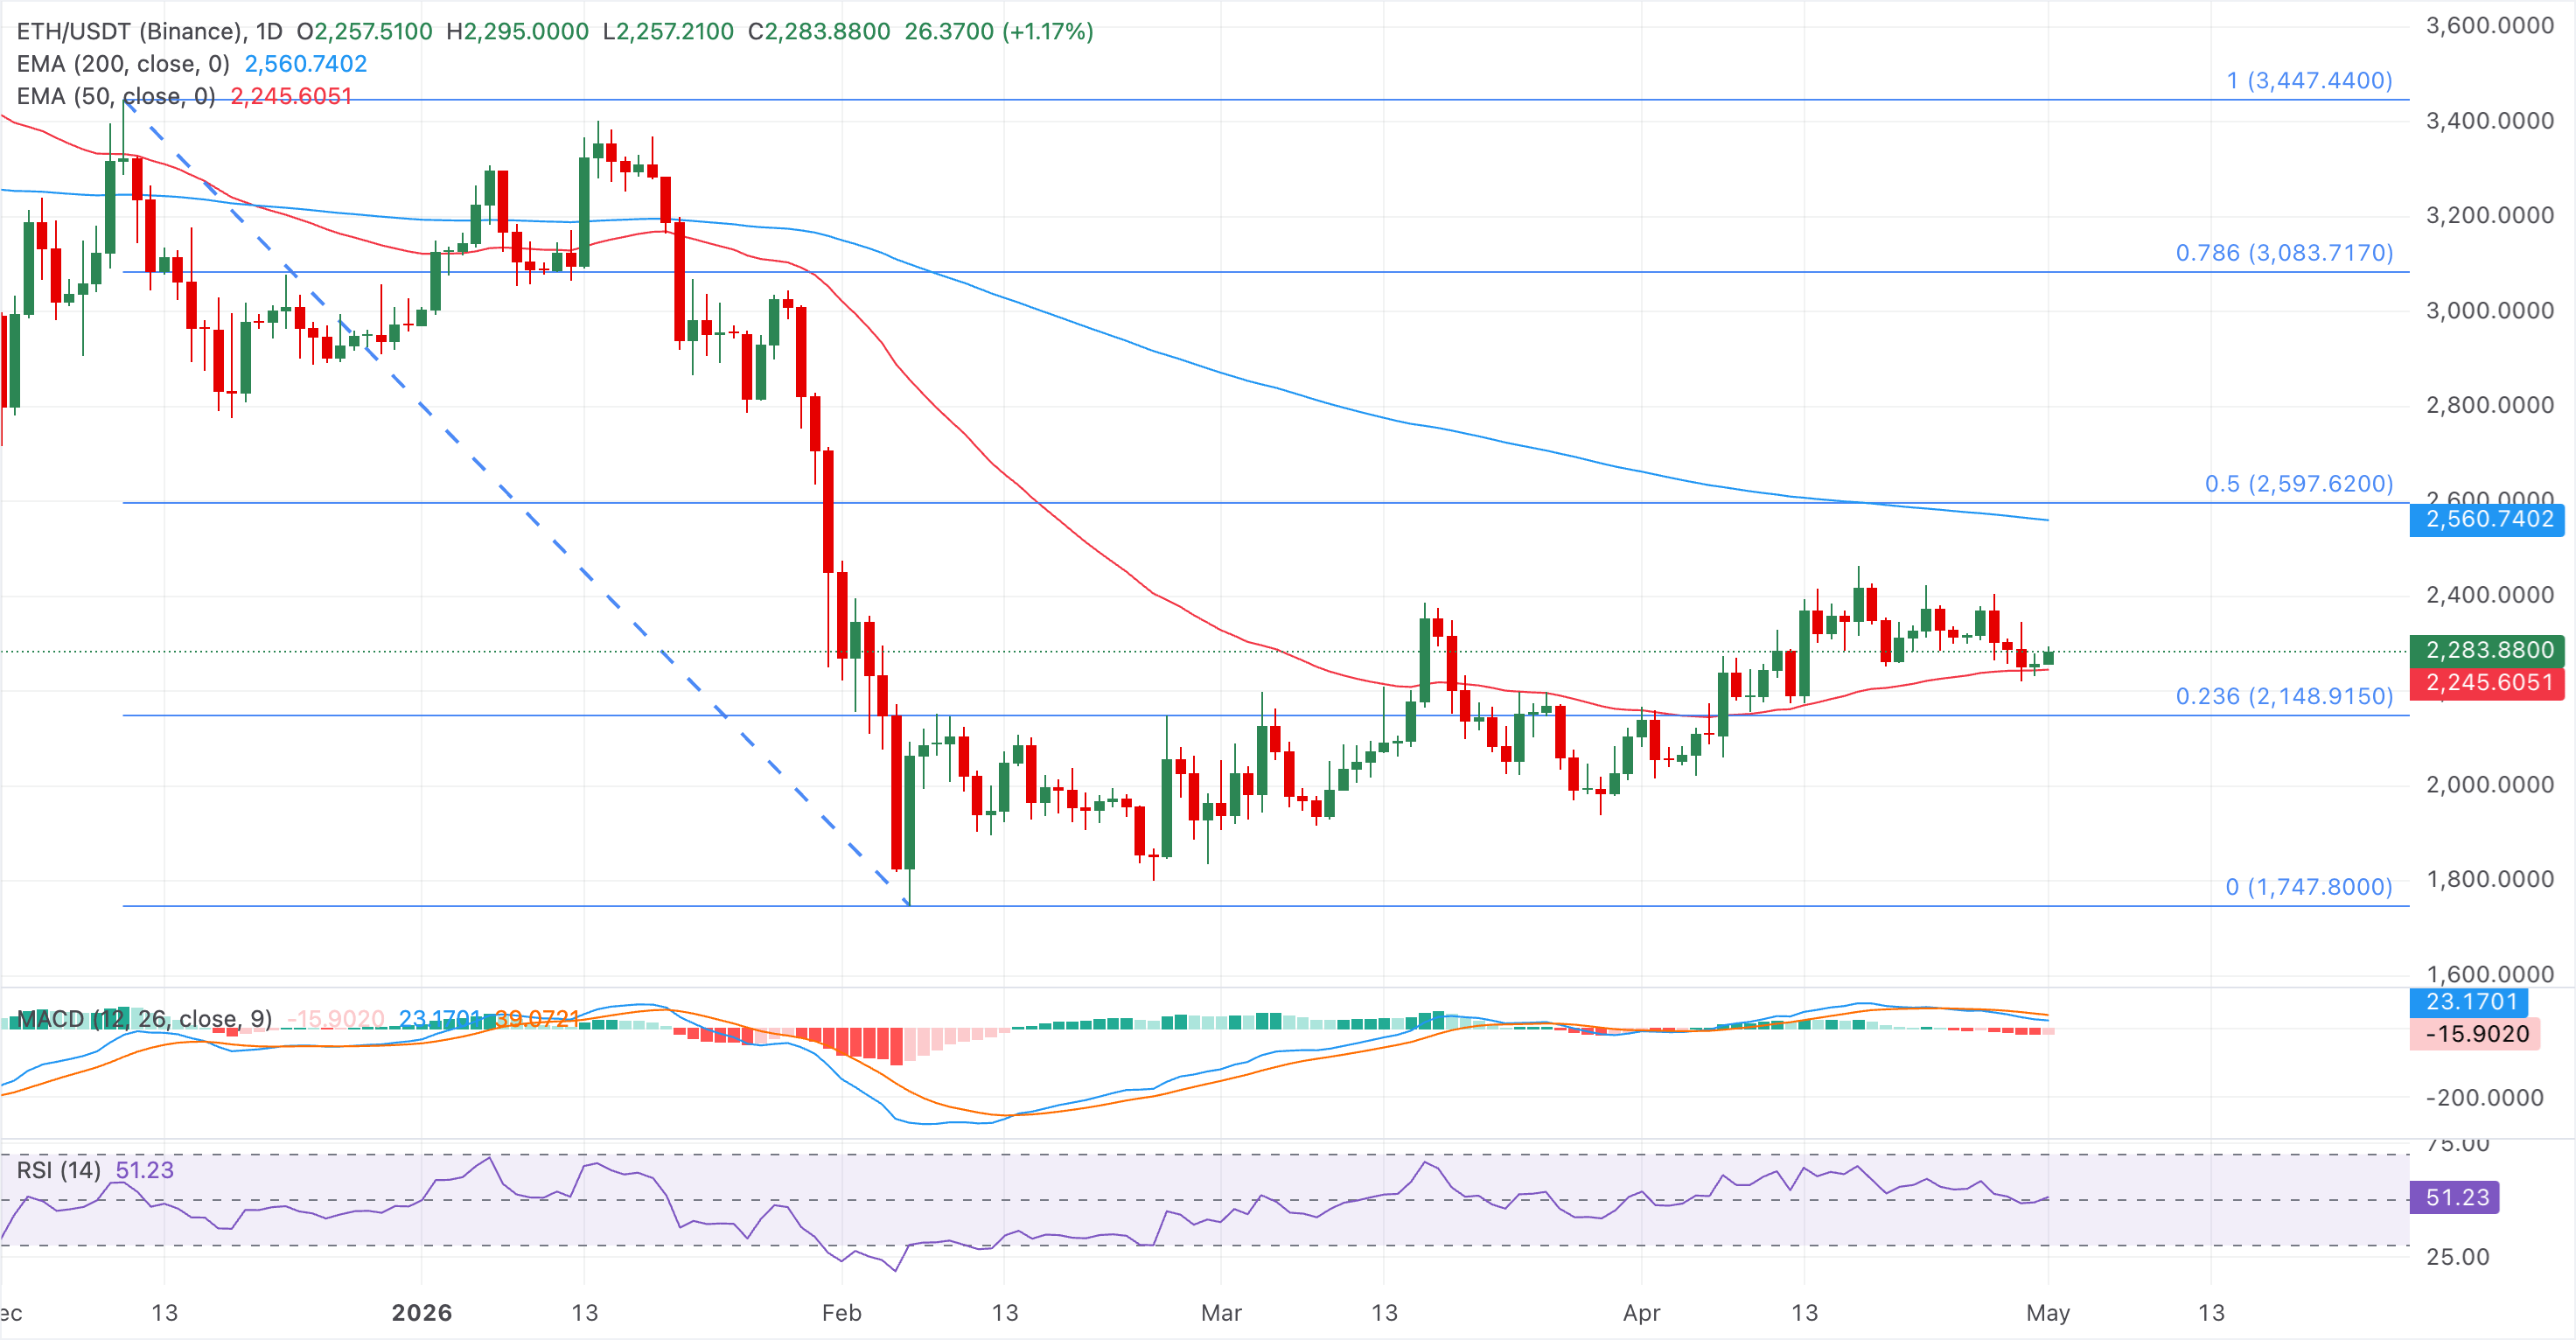
Looking down, immediate support is provided by the 50-day EMA at $2,245, ahead of a deeper cushion at the 23.6% Fibonacci level around $2,148, where buyers would be expected to show more interest if a pullback extends.
In the case of Ripple, the near-term bias is modestly bearish as XRP holds below the 50-day EMA at $1.4089 and well under the 200-day EMA at $1.7645. The MACD line sits slightly below the signal line with a negative reading of histograms, while the RSI hovers around 46, together hinting at fading upside momentum.
Initial resistance is reinforced by the 50-day EMA at 1.4089, and a more significant barrier emerges near the 200-day EMA at 1.7645, where any sustained break would be needed to ease the broader bearish tone.
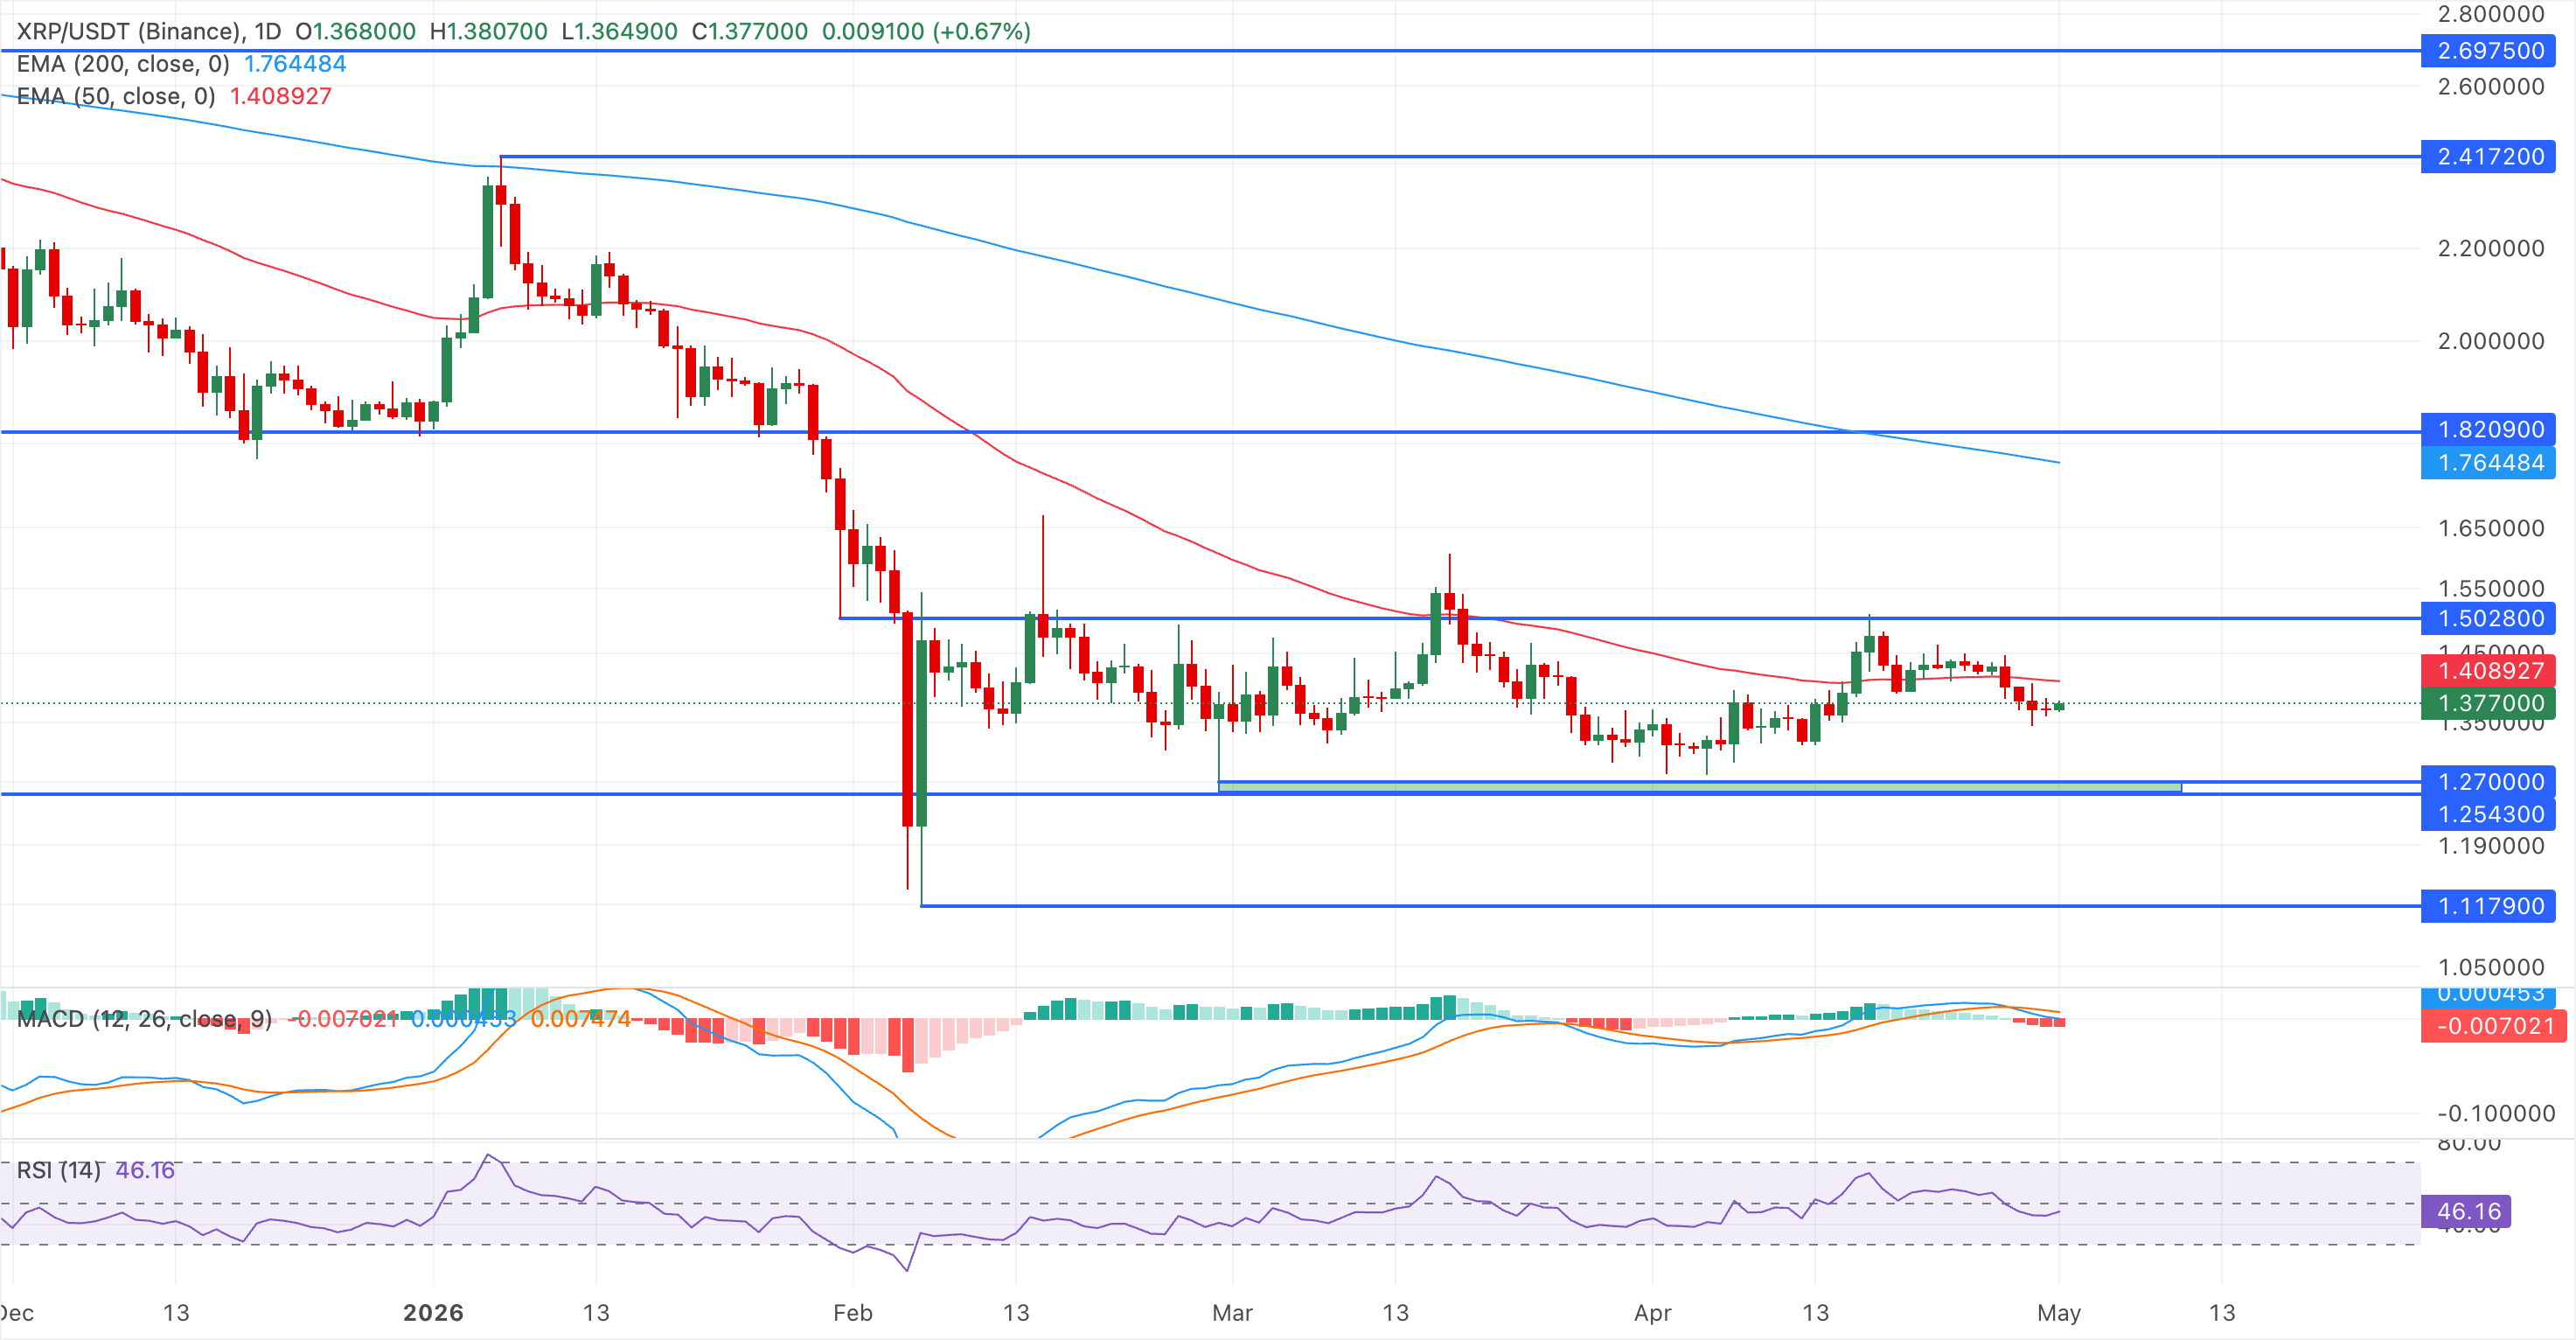
However, a bearish close to the day could extend the XRP decline toward the $1.2500-$1.2700 support zone.
(The technical analysis of this story was written with the help of an AI tool.)

Hơn một triệu người dùng dựa vào FXStreet để có dữ liệu thị trường thời gian thực, công cụ biểu đồ, góc nhìn chuyên gia và tin tức Forex. Lịch kinh tế toàn diện và các hội thảo web giáo dục giúp nhà giao dịch luôn cập nhật và đưa ra quyết định có tính toán. FXStreet có khoảng 60 nhân sự, chia giữa trụ sở Barcelona và nhiều khu vực toàn cầu.
Đọc thêm


