
Dogecoin Price Forecast: DOGE in a clear bearish spiral risks losing another battle for survival
Bởi Vishal Dixit
Đã cập nhật: 29 Jun 2026


BÀI VIẾT PHỔ BIẾN

Dogecoin (DOGE) price remains in an extended downward trend, as the broader market risk-off sentiment weighs down on DOGE derivatives. From a technical viewpoint, DOGE risks deeper corrections as bearish momentum remains dominant despite indicators flashing oversold conditions.
- Dogecoin extends losses on Monday, approaching a key support level near $0.0700.
- Mixed derivative signals lean bearish amid broader market risk-off sentiment.
- The technical outlook for DOGE highlights further downside as bearish momentum, though oversold, remains dominant.
Dogecoin (DOGE) price remains in an extended downward trend, as the broader market risk-off sentiment weighs down on DOGE derivatives. From a technical viewpoint, DOGE risks deeper corrections as bearish momentum remains dominant despite indicators flashing oversold conditions.
Broader market risk-off sentiment weighs down on DOGE
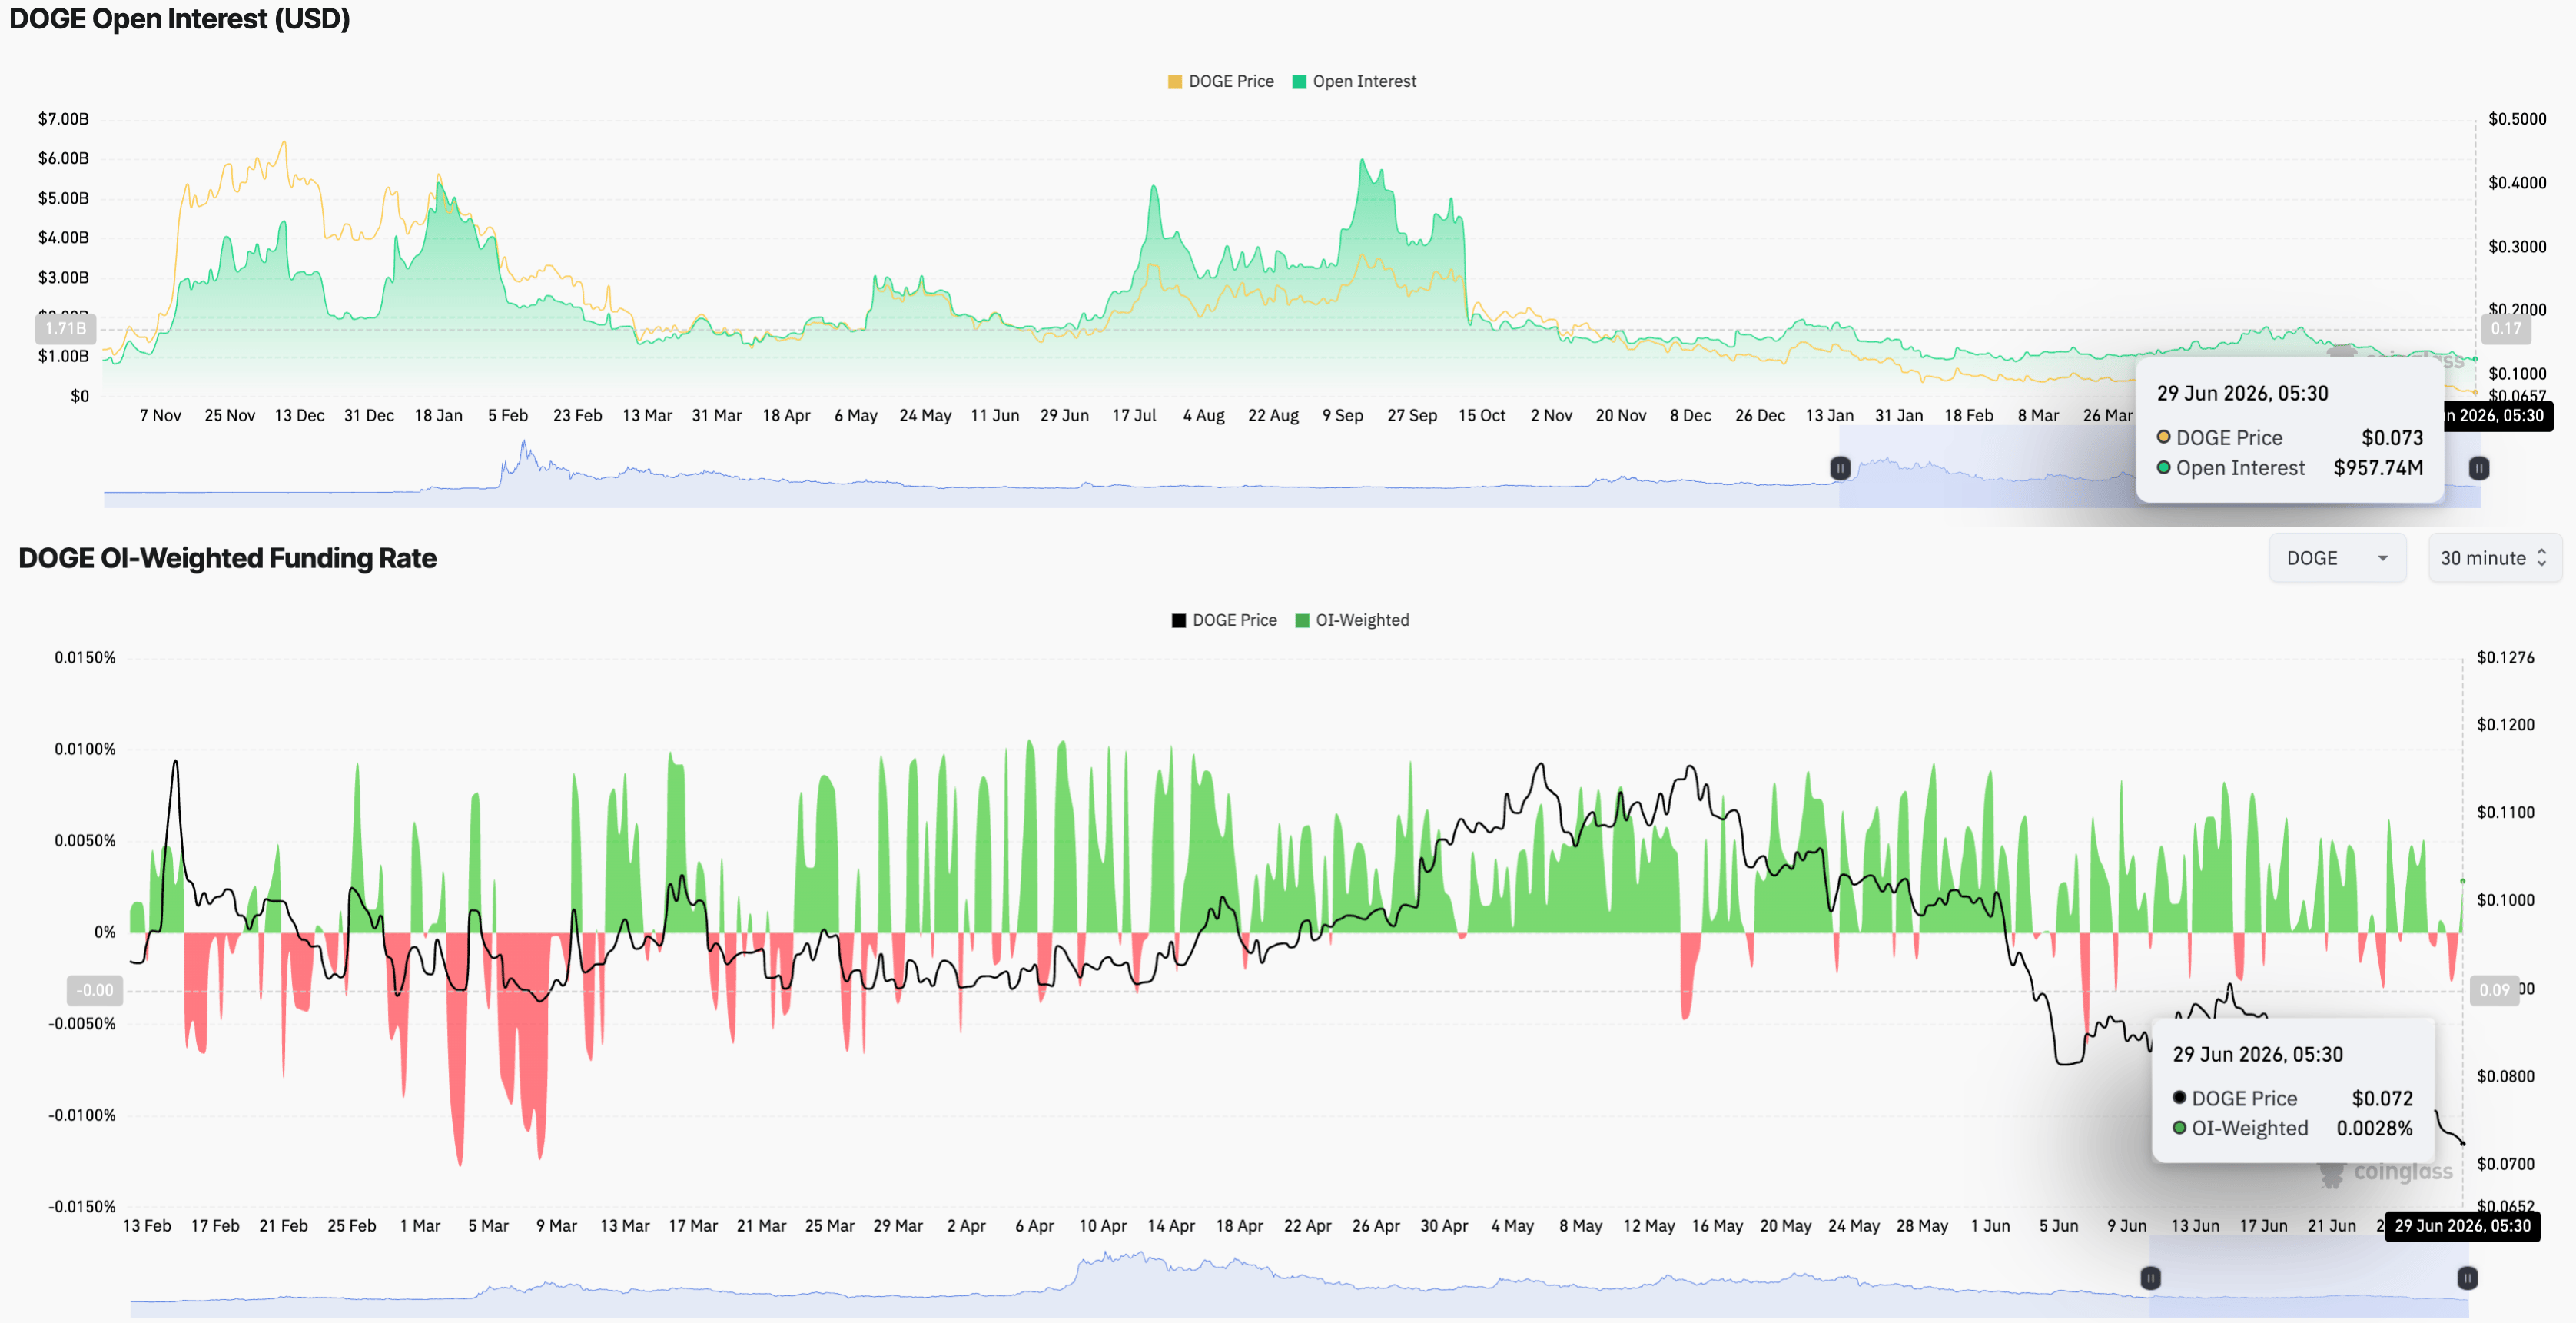
Bearish grip tightens over the broader crypto market with Bitcoin (BTC) struggling for direction below $60,000 and CoinMarketCap’s Fear and Greed Index around 15 on Monday, well into the “Extreme Fear” zone. CoinGlass data shows a steady decline in DOGE futures Open Interest (OI) to $957.74 million on Monday, down from $1.76 billion on May 15, suggesting a positional easing as traders derisk.
The funding rate of around 0.0029% on Monday remains volatile and near zero, suggesting a short-term bullish bias amid a broad mixed consensus among traders.
Will DOGE hold its ground at $0.070?
Dogecoin edges lower toward $0.0700 at press time on Thursday, extending a clear bearish trend for over six weeks. The 50- and 200-day Exponential Moving Averages (EMAs) at $0.0885 and $0.1111, respectively, coupled with a downward trendline near $0.0826, keep Dogecoin rallies contained.
Momentum indicators on the daily chart hint at persistent downside pressure. The Moving Average Convergence Divergence (MACD) is below its signal line in negative territory, reinforcing a bearish bias despite an oversold Relative Strength Index (RSI) near 23.
On the downside, immediate support emerges at $0.0700, with a deeper floor seen at $0.0642, where buyers would need to step in to prevent a more pronounced bearish continuation.
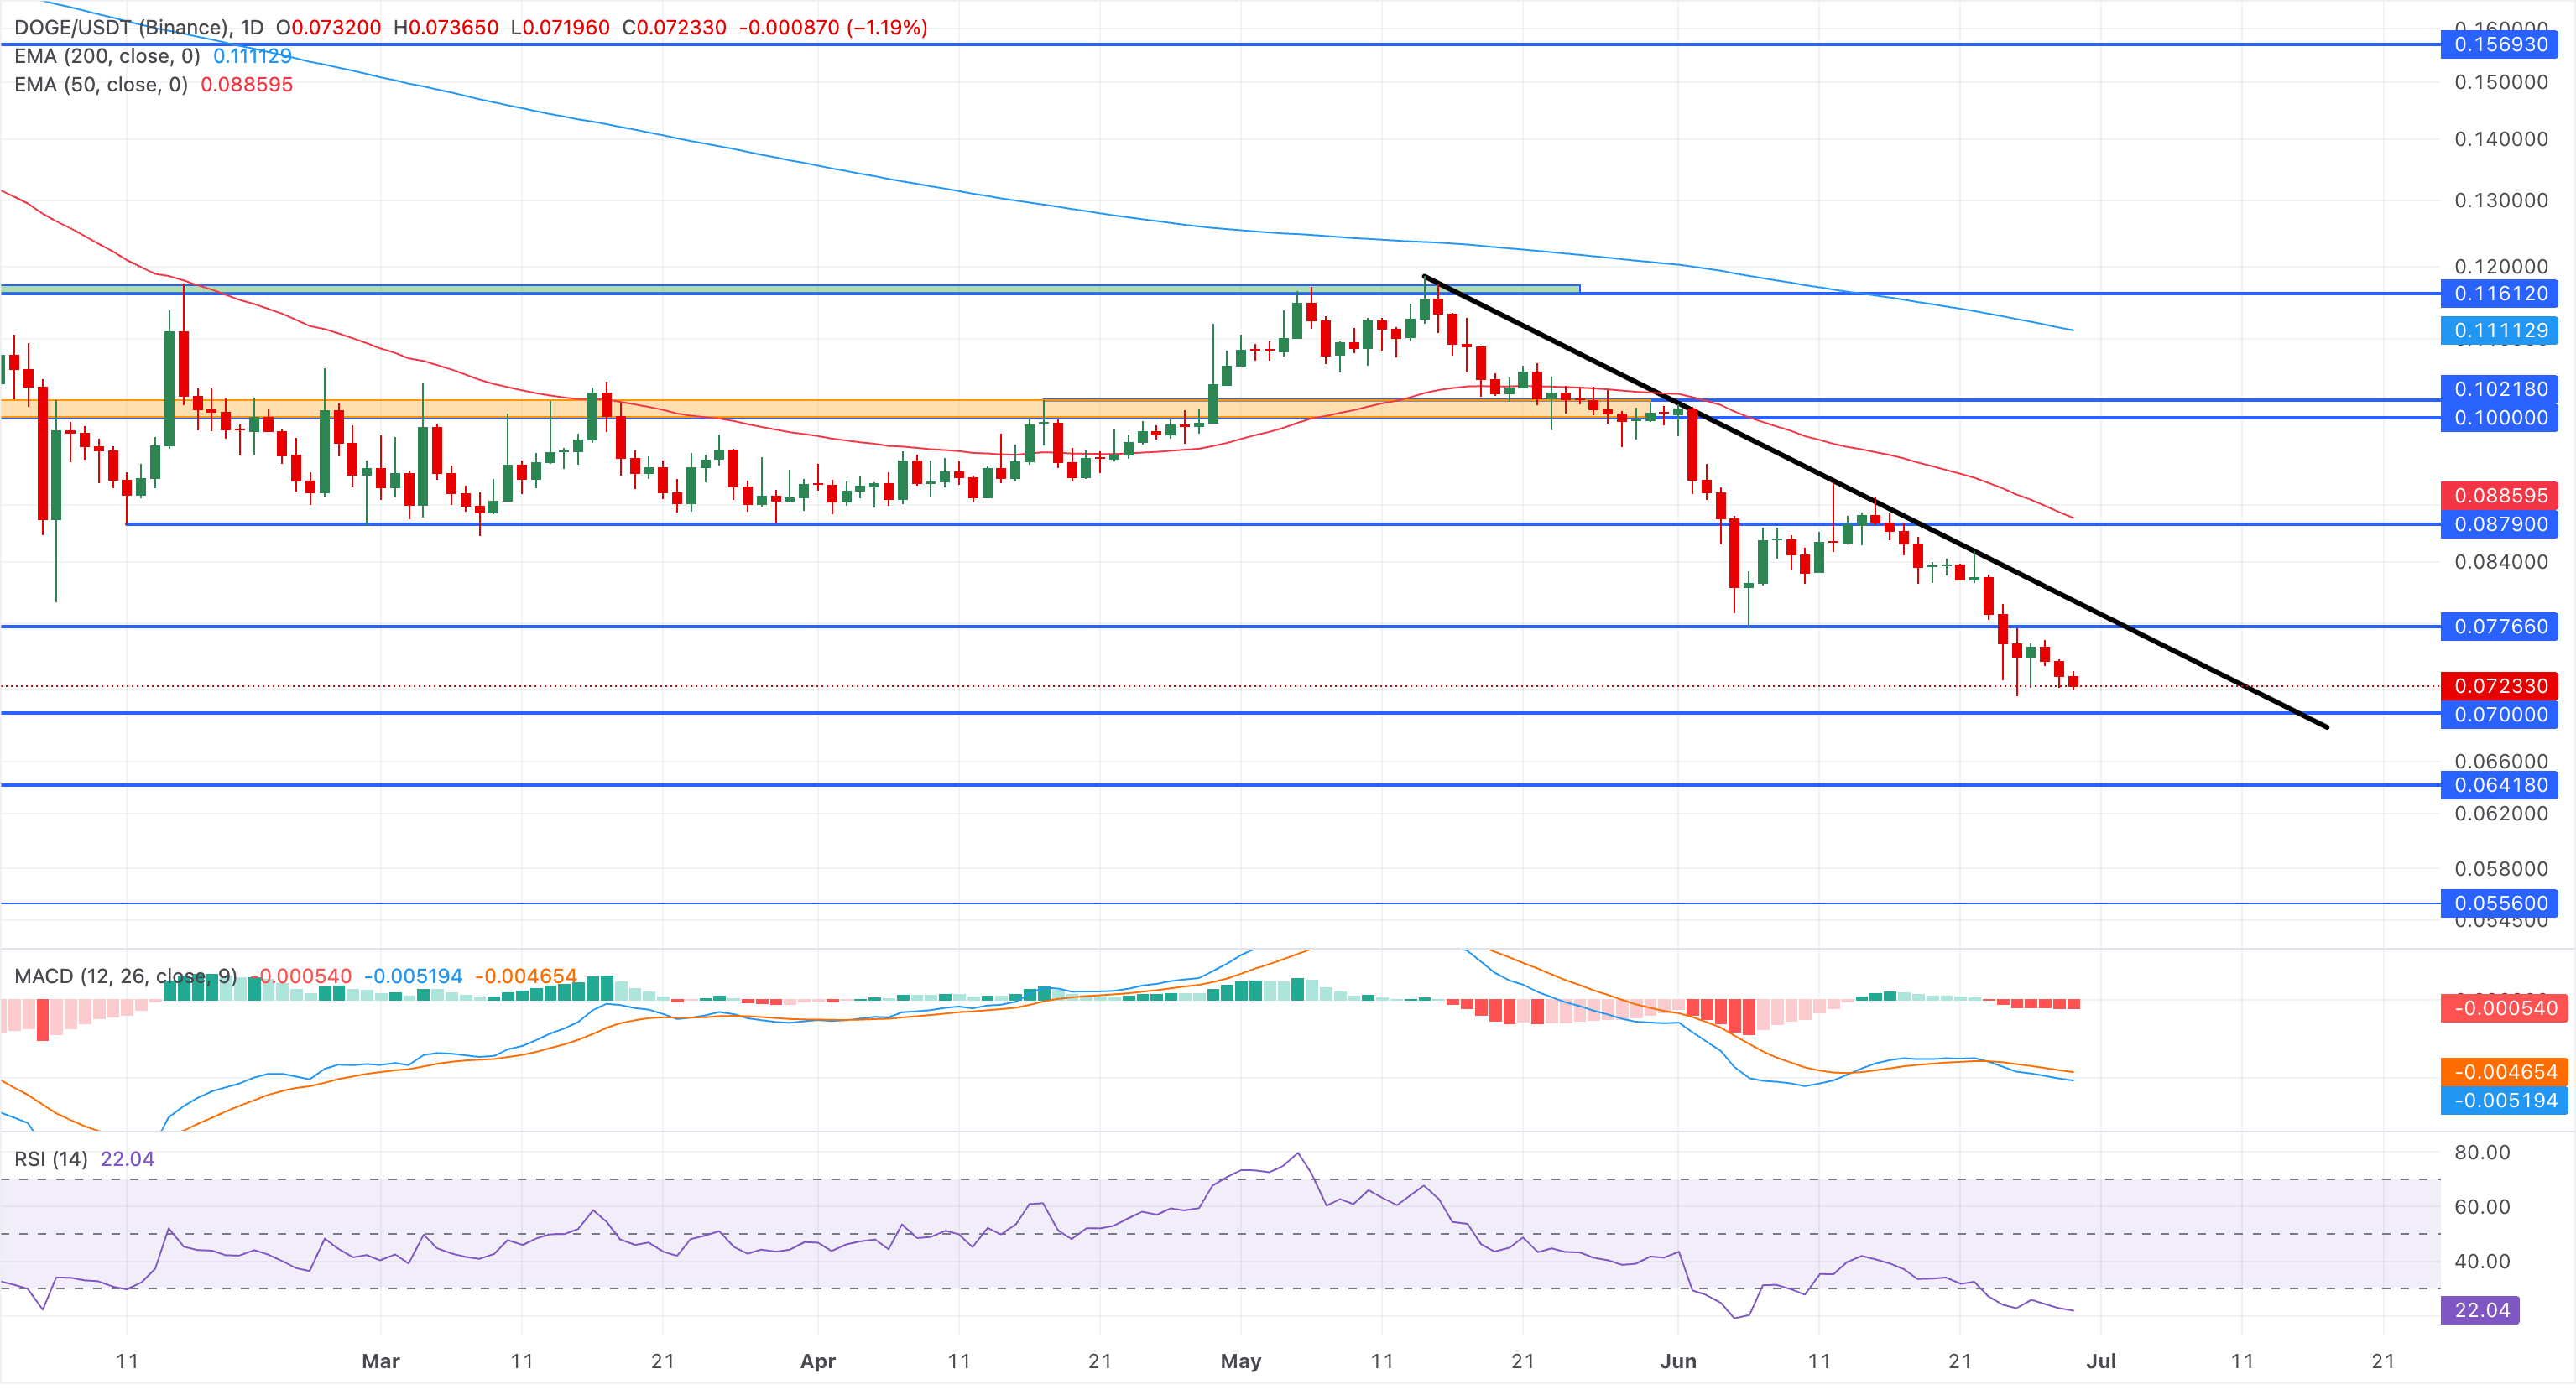
On the topside, initial resistance is at $0.0777, ahead of the former trendline break near $0.0826, as a more distant cap if recovery extends.
(The technical analysis of this story was written with the help of an AI tool.)
Cryptocurrency metrics FAQs
The developer or creator of each cryptocurrency decides on the total number of tokens that can be minted or issued. Only a certain number of these assets can be minted by mining, staking or other mechanisms. This is defined by the algorithm of the underlying blockchain technology. On the other hand, circulating supply can also be decreased via actions such as burning tokens, or mistakenly sending assets to addresses of other incompatible blockchains.
Market capitalization is the result of multiplying the circulating supply of a certain asset by the asset’s current market value.
Trading volume refers to the total number of tokens for a specific asset that has been transacted or exchanged between buyers and sellers within set trading hours, for example, 24 hours. It is used to gauge market sentiment, this metric combines all volumes on centralized exchanges and decentralized exchanges. Increasing trading volume often denotes the demand for a certain asset as more people are buying and selling the cryptocurrency.
Funding rates are a concept designed to encourage traders to take positions and ensure perpetual contract prices match spot markets. It defines a mechanism by exchanges to ensure that future prices and index prices periodic payments regularly converge. When the funding rate is positive, the price of the perpetual contract is higher than the mark price. This means traders who are bullish and have opened long positions pay traders who are in short positions. On the other hand, a negative funding rate means perpetual prices are below the mark price, and hence traders with short positions pay traders who have opened long positions.

Hơn một triệu người dùng dựa vào FXStreet để có dữ liệu thị trường thời gian thực, công cụ biểu đồ, góc nhìn chuyên gia và tin tức Forex. Lịch kinh tế toàn diện và các hội thảo web giáo dục giúp nhà giao dịch luôn cập nhật và đưa ra quyết định có tính toán. FXStreet có khoảng 60 nhân sự, chia giữa trụ sở Barcelona và nhiều khu vực toàn cầu.
Đọc thêm


