
Dogecoin Price Forecast: DOGE retreats amid mixed market sentiment and derivatives activity
Bởi Vishal Dixit
Đã cập nhật: 7 May 2026


BÀI VIẾT PHỔ BIẾN

Dogecoin (DOGE) price is trading in the red at press time on Thursday, extending the 2% loss from the previous day. The first-ever meme coin is losing retail interest amid indecisive broader market sentiment, even as inflows from DOGE-focused Exchange Traded Funds (ETFs) continue.
- Dogecoin extends losses on Thursday after reversing from the overhead resistance zone near $0.1160.
- DOGE futures activity reflects waning bullish sentiment while ETFs record their second consecutive day of inflows.
- The technical outlook for DOGE is mildly bearish as price could retest its 50-day EMA near the $0.1000 psychological threshold.
Dogecoin (DOGE) price is trading in the red at press time on Thursday, extending the 2% loss from the previous day. The first-ever meme coin is losing retail interest amid indecisive broader market sentiment, even as inflows from DOGE-focused Exchange Traded Funds (ETFs) continue. Technically, DOGE flashes mild bearish signals, targeting the crucial 50-day Exponential Moving Average (EMA) support at $0.1003.
Dogecoin futures activity shifts despite ETF inflows
Dogecoin, a high-risk, speculation-driven, volatile meme coin, keeps the leverage-linked trading activity on the edge. CoinGlass data shows the DOGE futures Open Interest (OI) is down 11% over the last 24 hours to $1.57 billion, suggesting an intense positional unwinding. Liquidation data shows $8.71 million in positions wiped out over the same period, led by $6.82 million in long liquidations, suggesting that mainly bullish positions triggered the margin call.
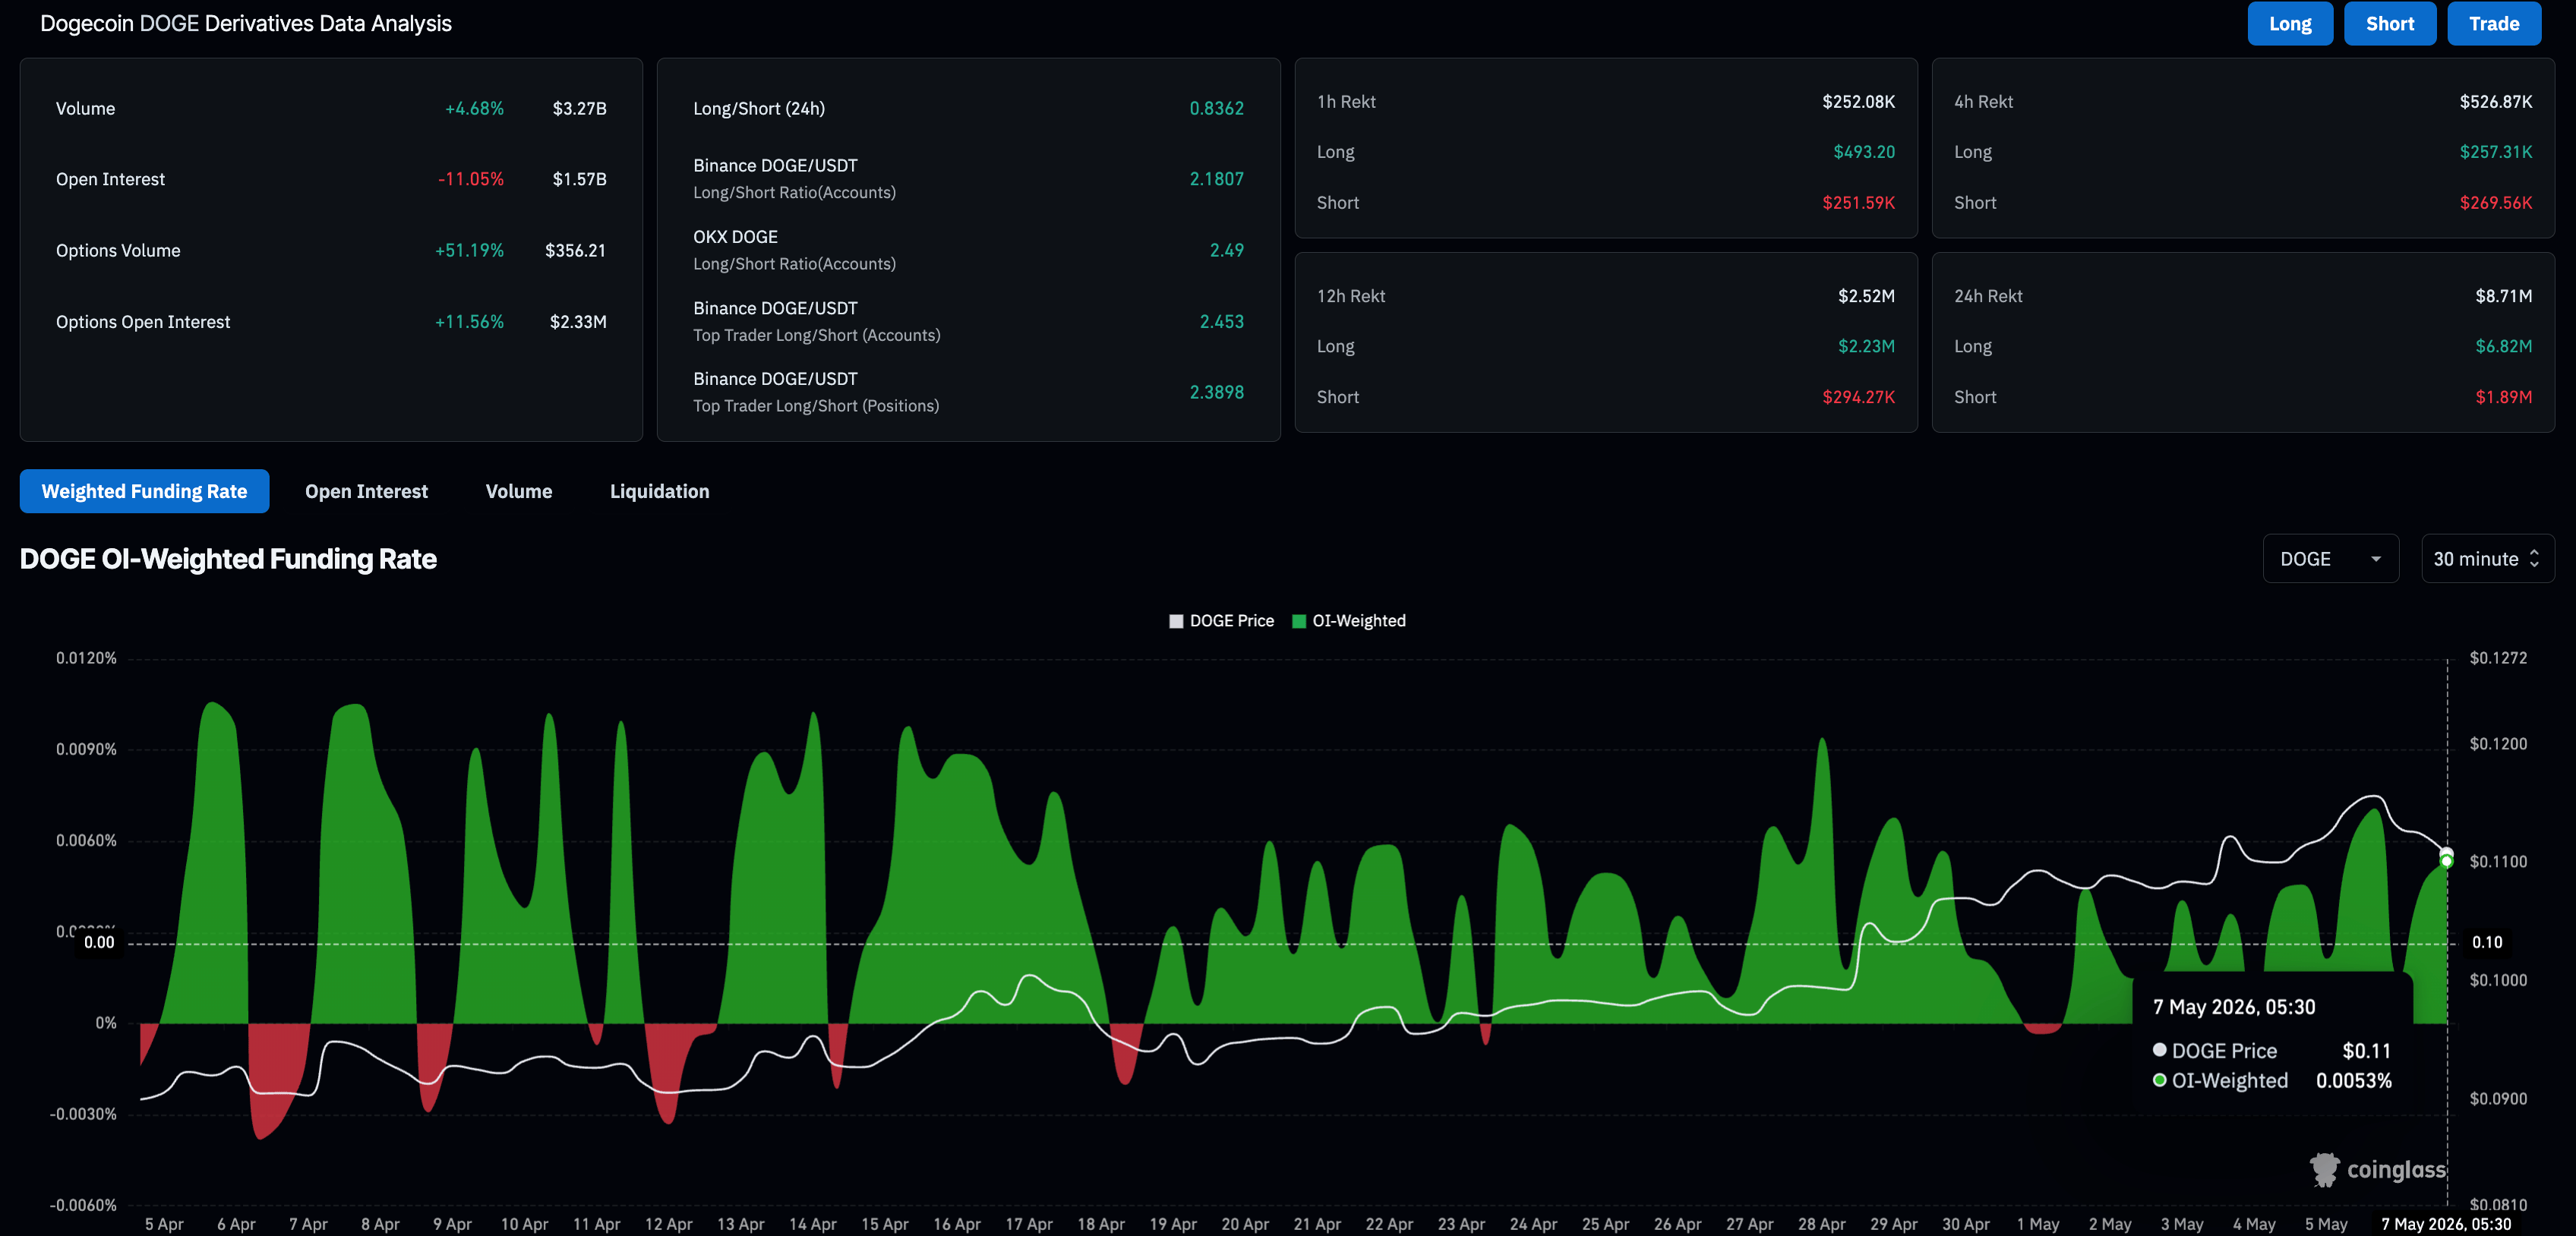
Still, the funding rate remains positive at 0.0053%, which typically indicates bullish sentiment among traders to take long positions at a premium. However, in the case of Dogecoin, this positive funding rate provides an incentive for short sellers to go short.
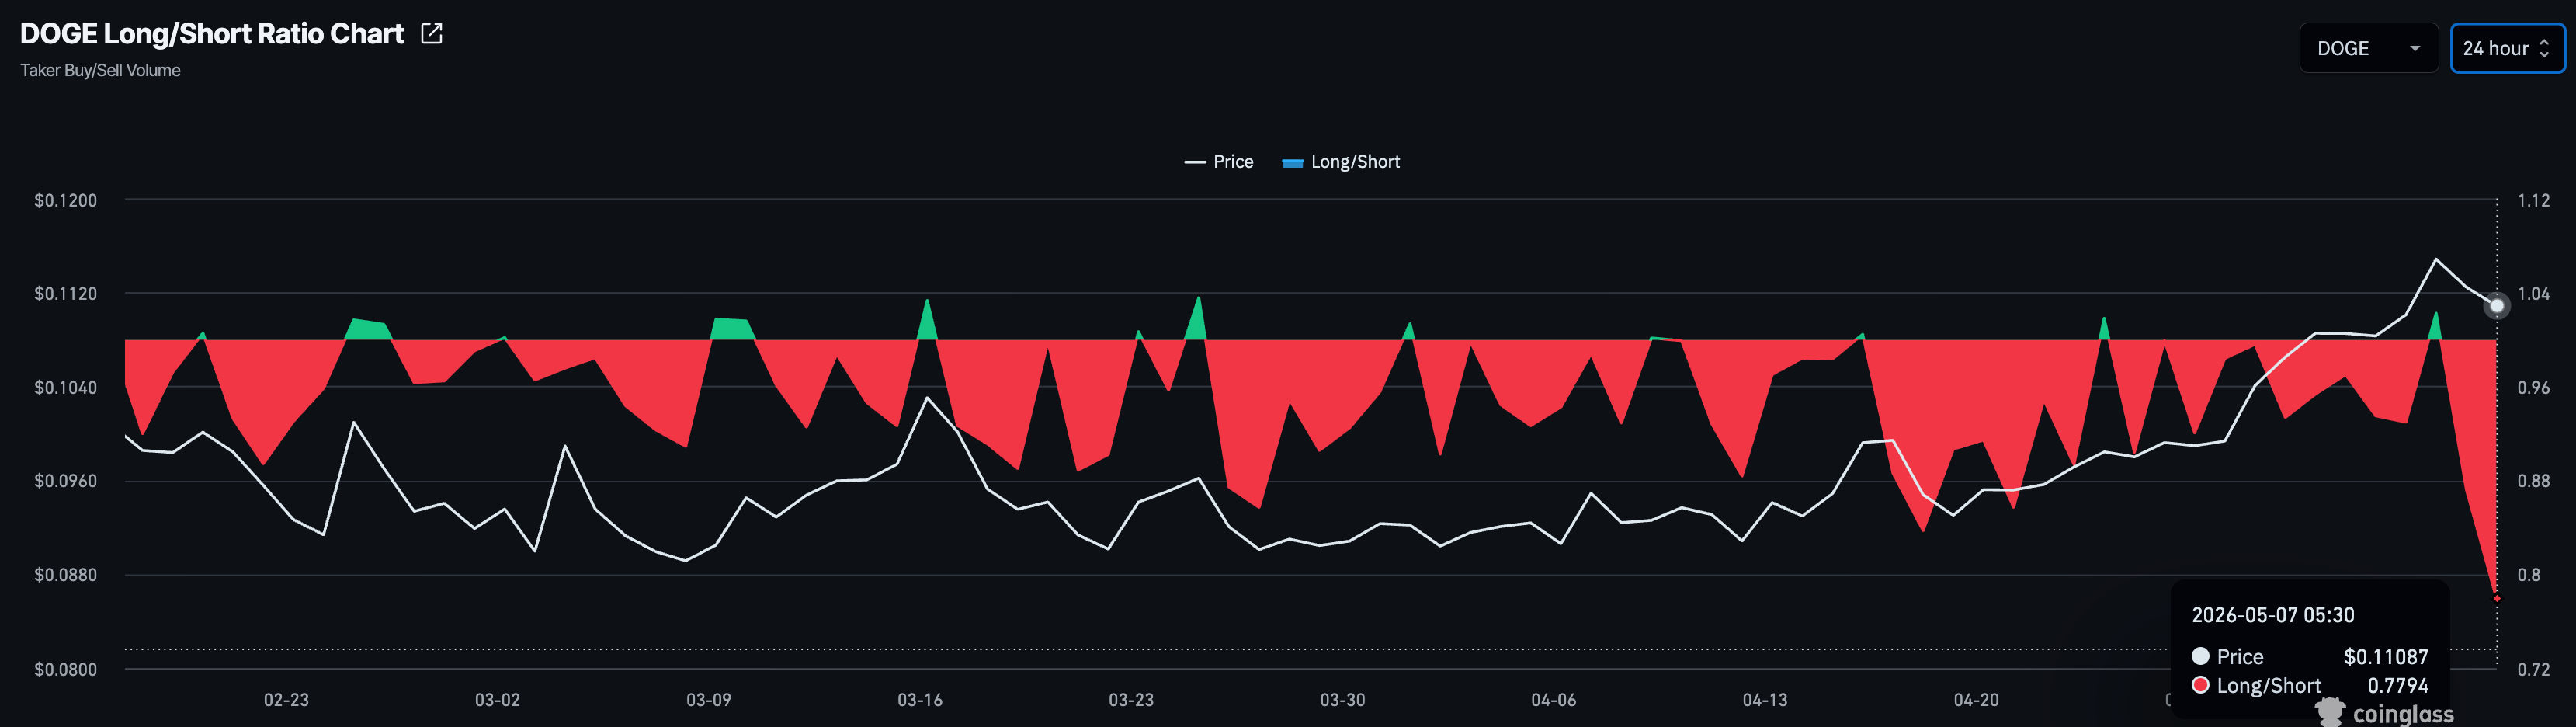
The long-to-short ratio of 0.7794 suggests that the number of active short positions outweighs the bullish activity.
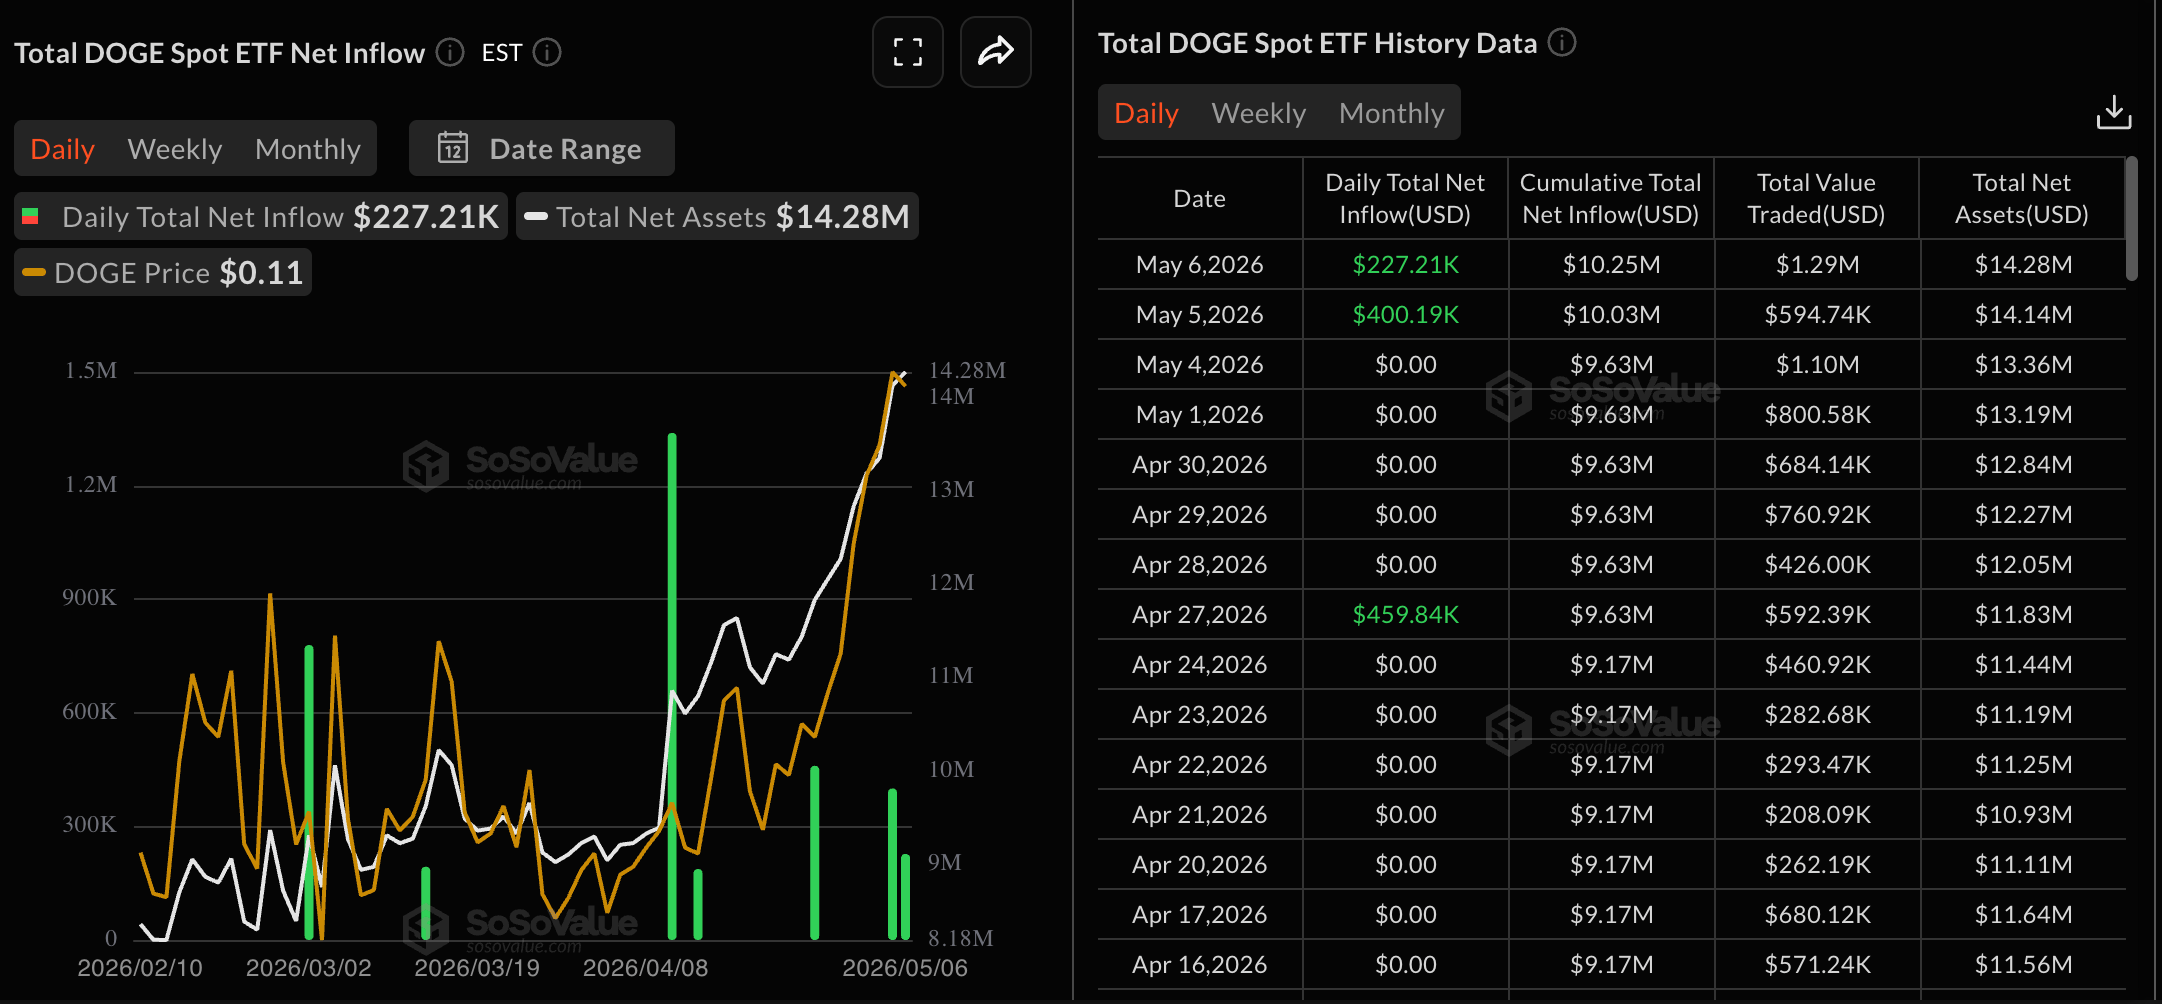
On the institutional side, the DOGE-focused ETFs recorded $227,210 in inflows on Wednesday, after $400,190 the previous day. These two consecutive days of positive activity imply institutional confidence, which could support further upside in DOGE.
Technical outlook: Will Dogecoin sustain above $0.1000?
Dogecoin sustains above $0.1000 at press time on Thursday, holding above the 50-day Exponential Moving Average (EMA) at $0.1000 and keeping a constructive near-term bias, while the 200-day EMA at $0.1241 acts as the next key upside barrier.
Momentum conditions support the bullish tone, with the Relative Strength Index (RSI) hovering near 68 on the daily price chart and the Moving Average Convergence Divergence (MACD) line staying in positive territory, suggesting that buying pressure remains dominant even as overbought conditions start to build.
On the topside, immediate resistance lies in the zone near $0.1160, followed by the 200-day EMA around $0.1241. A daily close above this level would open the door to a stronger recovery phase toward higher swing highs.
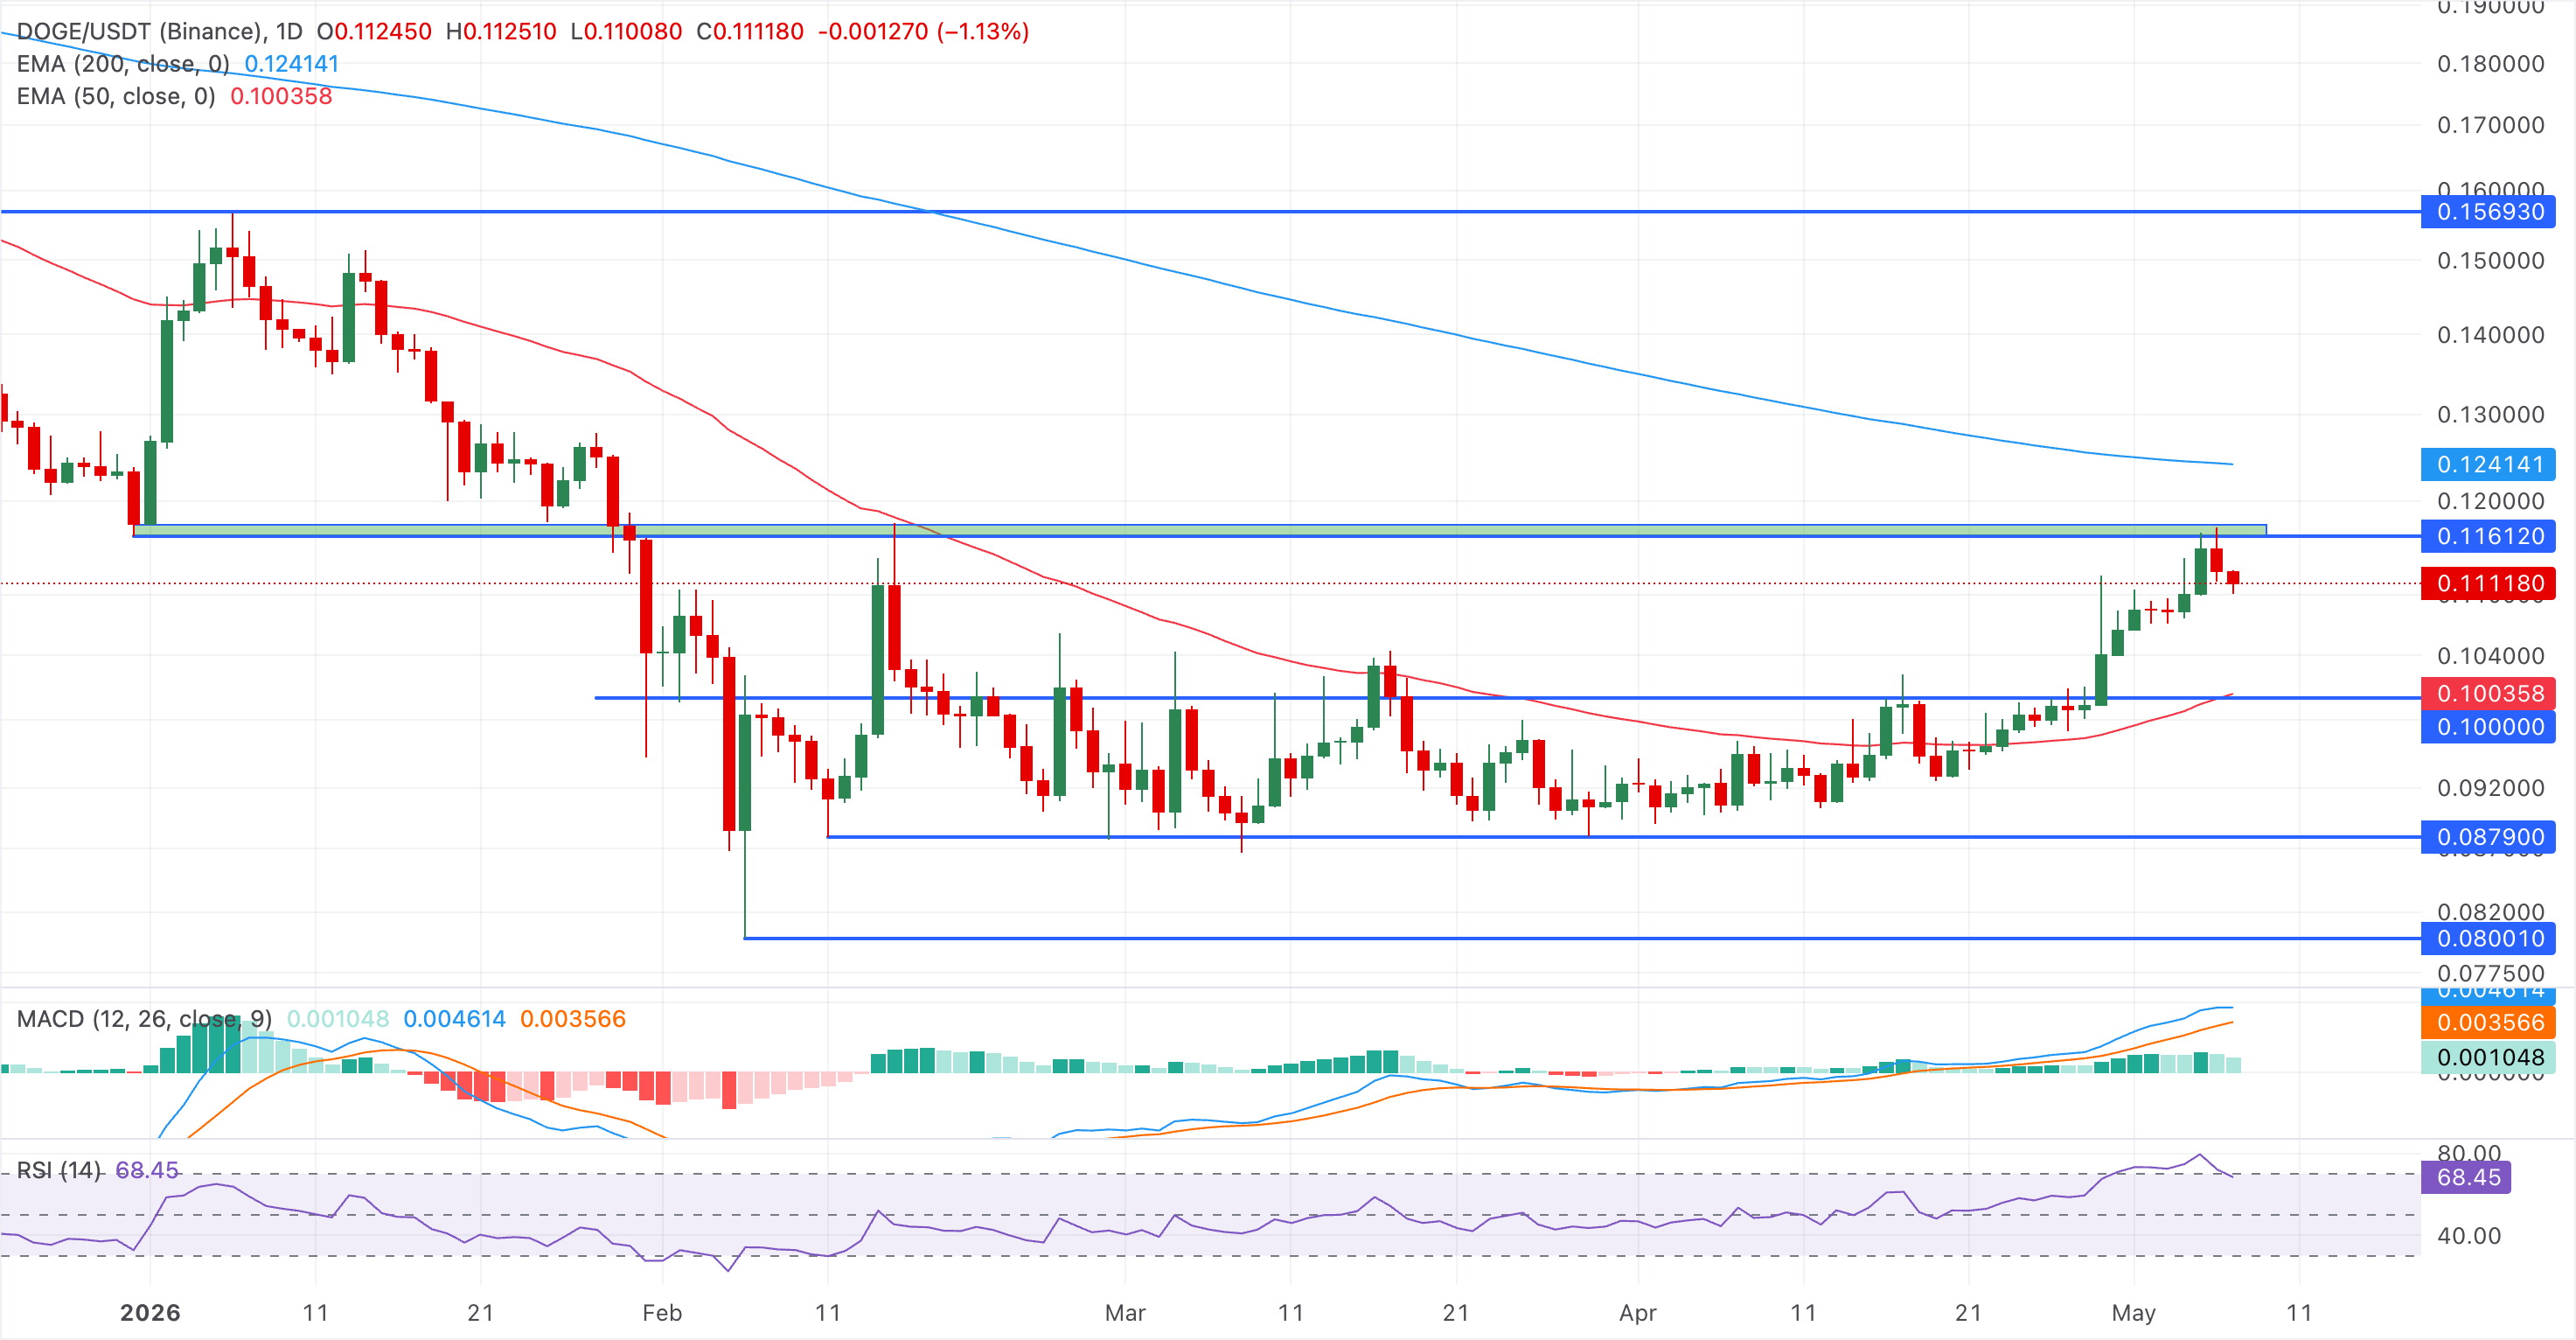
On the downside, initial support is seen at the 50-day EMA at $0.1003, and as long as DOGE/USDT holds above the $0.1000 threshold, pullbacks are likely to be treated as corrective pauses within the prevailing bullish sequence.
(The technical analysis of this story was written with the help of an AI tool.)

Hơn một triệu người dùng dựa vào FXStreet để có dữ liệu thị trường thời gian thực, công cụ biểu đồ, góc nhìn chuyên gia và tin tức Forex. Lịch kinh tế toàn diện và các hội thảo web giáo dục giúp nhà giao dịch luôn cập nhật và đưa ra quyết định có tính toán. FXStreet có khoảng 60 nhân sự, chia giữa trụ sở Barcelona và nhiều khu vực toàn cầu.
Đọc thêm


