
Dow Jones Industrial Average edges higher as Middle East confusion lingers
Bởi Joshua Gibson
Ngày xuất bản: 24 Mar 2026 | Ngày chỉnh sửa: 24 Mar 2026


BÀI VIẾT PHỔ BIẾN

The Dow Jones Industrial Average eked out a modest gain on Tuesday, adding around 40 points after a volatile premarket session, as markets struggled to build on Monday's sharp rebound. The S&P 500 dipped 0.1% while the Nasdaq Composite dropped 0.5%, weighed down by weakness in tech names.
- The Dow Jones Industrial Average gained around 40 points on Tuesday while the S&P 500 slipped 0.1% and the Nasdaq Composite fell 0.5%.
- Oil prices resumed their rally as doubts grew over the viability of US-Iran diplomatic talks, with Brent crude jumping back above $100 a barrel.
- Apollo and Ares both capped redemptions on their flagship private credit funds after withdrawal requests surged past their quarterly limits.
- Salesforce and IBM led the Dow lower while Chevron and Walmart provided a floor for the index.
The Dow Jones Industrial Average eked out a modest gain on Tuesday, adding around 40 points after a volatile premarket session, as markets struggled to build on Monday's sharp rebound. The S&P 500 dipped 0.1% while the Nasdaq Composite dropped 0.5%, weighed down by weakness in tech names. Tuesday's session was volatile, with the Dow dipping below 46,000 in early trade before recovering as investors tried to make sense of conflicting signals around the US-Iran situation.
Middle East confusion keeps markets on edge
Monday's 600-point rally in the Dow was fuelled by President Trump's claim that Washington and Tehran had held "very good and productive conversations" on ending the conflict. He also announced a five-day pause on strikes against Iranian power plants and energy infrastructure. However, Iran flatly denied that any direct talks had occurred. The Wall Street Journal reported that the US had engaged with Iran through Middle Eastern intermediaries, but Arab mediators privately expressed doubt that a quick deal was within reach. Adding to the confusion on Tuesday, Israel and Iran continued to exchange strikes, dimming expectations of an imminent de-escalation. Iran struck targets in Israel and Gulf Cooperation Council (GCC) member states, while Israel accelerated attacks on both Iran and Lebanon. On the other side, an Iranian source told CNN that there has been "outreach" between Washington and Tehran, and Pakistan offered to facilitate further discussions. The mixed signals left equities stuck in a holding pattern, with investors unsure of how much of Monday's optimism was warranted.
Oil prices jump as peace premium fades
Oil prices reversed sharply higher on Tuesday after Monday's dramatic plunge. Brent crude futures climbed more than 3% to trade above $103 a barrel, while West Texas Intermediate (WTI) crude jumped roughly 4% to above $91 a barrel. Monday had seen Brent fall about 11% on the back of Trump's de-escalation comments, briefly settling below $100 for the first time in nearly two weeks. The renewed rally reflected growing scepticism that the conflict would end anytime soon. Citi analysts warned that Oil could test $200 a barrel if production disruptions persist through June, calling the supply shock larger than those of the 1970s as a share of global output. Chevron (CVX) was among the top performers in the Dow on Tuesday, adding about 1%. Energy remains the only positive S&P 500 sector since the conflict began, up nearly 32% year to date.
Private credit stress deepens as redemption gates spread
A wave of redemption pressure hit the alternative asset management sector hard on Tuesday. Apollo (APO) disclosed that its $15 billion flagship private credit fund, Apollo Debt Solutions, received withdrawal requests totalling 11.2% of shares outstanding in the first quarter, more than double the fund's 5% quarterly redemption cap. Apollo chose to stick with the 5% limit, meaning redeeming investors will receive roughly 45 cents on the dollar. Ares (ARES) followed suit, announcing that its $10.7 billion Strategic Income Fund also capped redemptions at 5% after clients sought to pull 11.6% of shares. Shares of both Apollo and Ares dropped more than 4% on the session, dragging down peers including Blackstone (BX), KKR (KKR), and Blue Owl Capital (OWL). The redemption wave reflects growing unease around private credit exposure to software companies whose businesses may be disrupted by artificial intelligence, alongside broader concerns about transparency and lending discipline across the $1.8 trillion asset class.
Jefferies rallies on Sumitomo Mitsui takeover speculation
Jefferies (JEF) was a standout gainer on Tuesday, rising about 4% after a Financial Times report that Sumitomo Mitsui Financial Group (SMFG) is working on plans for a possible takeover of the US investment bank. SMFG, Japan's second-largest lender, has reportedly assembled a small internal team to act if Jefferies' depressed share price presents an opportunity. The Japanese bank already holds a roughly 20% economic stake in Jefferies, built up since an initial 4.9% investment in 2021. However, the excitement was tempered somewhat after Bloomberg reported that SMFG has no immediate plans to pursue a deal, and Jefferies has indicated it is not interested in selling at current levels. Jefferies shares have fallen more than 36% year to date amid investor concerns tied to its exposure to collapsed auto-parts supplier First Brands and broader scrutiny of its risk management practices. The company reports earnings on Wednesday.
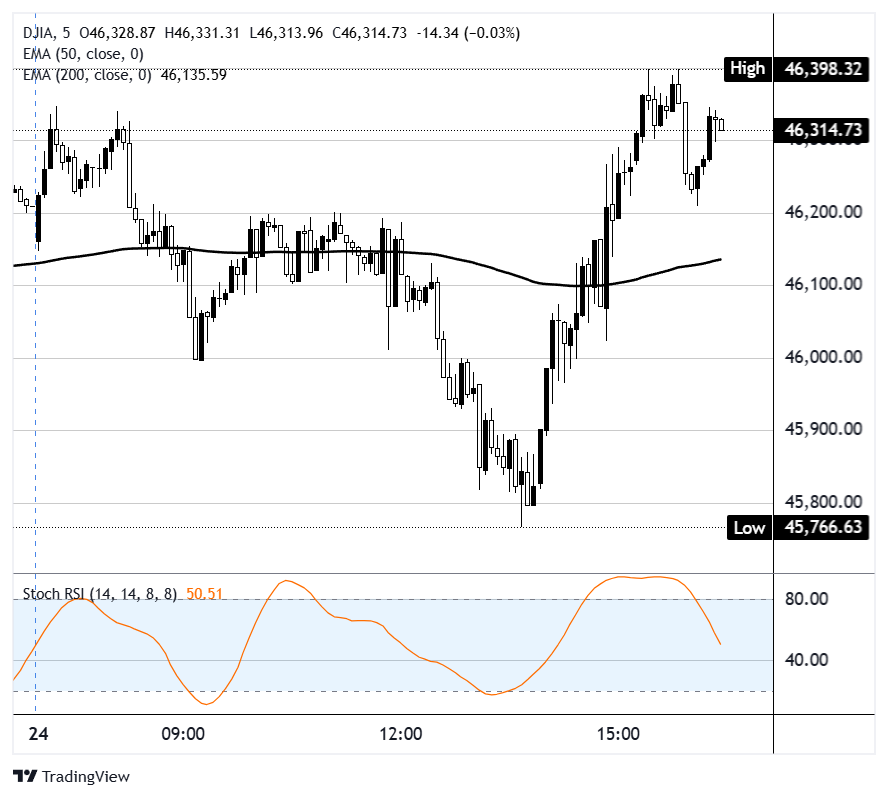
Dow Jones 5-minute chart
Dow Jones FAQs
The Dow Jones Industrial Average, one of the oldest stock market indices in the world, is compiled of the 30 most traded stocks in the US. The index is price-weighted rather than weighted by capitalization. It is calculated by summing the prices of the constituent stocks and dividing them by a factor, currently 0.152. The index was founded by Charles Dow, who also founded the Wall Street Journal. In later years it has been criticized for not being broadly representative enough because it only tracks 30 conglomerates, unlike broader indices such as the S&P 500.
Many different factors drive the Dow Jones Industrial Average (DJIA). The aggregate performance of the component companies revealed in quarterly company earnings reports is the main one. US and global macroeconomic data also contributes as it impacts on investor sentiment. The level of interest rates, set by the Federal Reserve (Fed), also influences the DJIA as it affects the cost of credit, on which many corporations are heavily reliant. Therefore, inflation can be a major driver as well as other metrics which impact the Fed decisions.
Dow Theory is a method for identifying the primary trend of the stock market developed by Charles Dow. A key step is to compare the direction of the Dow Jones Industrial Average (DJIA) and the Dow Jones Transportation Average (DJTA) and only follow trends where both are moving in the same direction. Volume is a confirmatory criteria. The theory uses elements of peak and trough analysis. Dow’s theory posits three trend phases: accumulation, when smart money starts buying or selling; public participation, when the wider public joins in; and distribution, when the smart money exits.
There are a number of ways to trade the DJIA. One is to use ETFs which allow investors to trade the DJIA as a single security, rather than having to buy shares in all 30 constituent companies. A leading example is the SPDR Dow Jones Industrial Average ETF (DIA). DJIA futures contracts enable traders to speculate on the future value of the index and Options provide the right, but not the obligation, to buy or sell the index at a predetermined price in the future. Mutual funds enable investors to buy a share of a diversified portfolio of DJIA stocks thus providing exposure to the overall index.

Hơn một triệu người dùng dựa vào FXStreet để có dữ liệu thị trường thời gian thực, công cụ biểu đồ, góc nhìn chuyên gia và tin tức Forex. Lịch kinh tế toàn diện và các hội thảo web giáo dục giúp nhà giao dịch luôn cập nhật và đưa ra quyết định có tính toán. FXStreet có khoảng 60 nhân sự, chia giữa trụ sở Barcelona và nhiều khu vực toàn cầu.
Đọc thêm


