
DUSK Price Forecast: DUSK extends gains as accumulation rises
Bởi Manish Chhetri
Ngày xuất bản: 24 Mar 2026 | Ngày chỉnh sửa: 24 Mar 2026


BÀI VIẾT PHỔ BIẾN

DUSK (DUSK) price is extending gains, trading above $0.110 on Tuesday, building on a three-day winning streak as bullish sentiment strengthens across the crypto market.
- DUSK price extends its gains on Tuesday, printing three consecutive days of green candlesticks.
- On-chain and derivatives data support a bullish outlook, as holder accumulation increases alongside long positions.
- The technical analysis suggests further upside, with DUSK targeting $0.138.
DUSK (DUSK) price is extending gains, trading above $0.110 on Tuesday, building on a three-day winning streak as bullish sentiment strengthens across the crypto market. Improving sentiment across on-chain and derivatives data supports a positive outlook, while technical analysis hints at further upside targeting $0.138 for DUSK.
On-chain and derivatives data support bullish sentiment
Santiment’s Exchange Flow balance for DUSK shows the net movement of tokens into and out of exchange wallets. The metric shows two downward spikes on Sunday and Monday, which indicates more DUSK left the exchange than entered, indicating less selling pressure from investors. This negative uptick indicates increased buying activity among investors and supports a bullish outlook for DUSK.
 [08-1774327709934-1774327709946.59.33, 24 Mar, 2026].png)
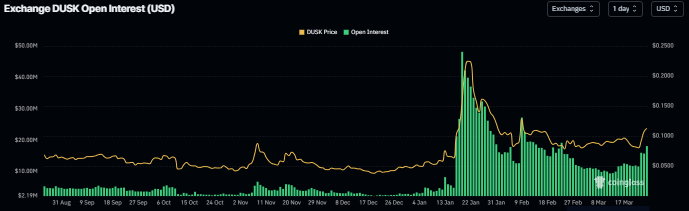
On the derivatives side, CoinGlass’s data shows that the futures’ Open Interest (OI) at exchanges in DUSK reached $18.09 million on Tuesday, up from $11 million on Sunday, levels not seen since February 23. An increasing OI represents new or additional money entering the market and new buying, which could fuel the current DUSK price rally.
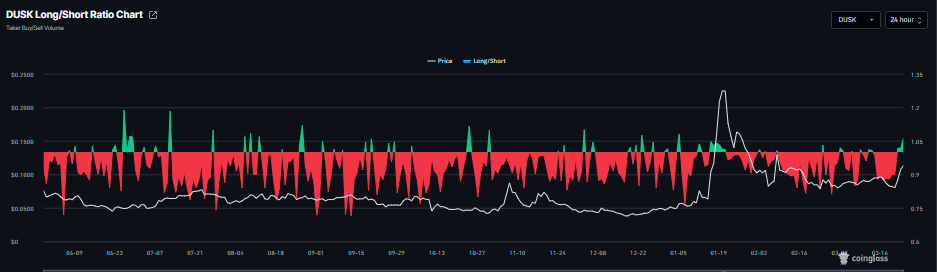
In addition, CoinGlass’s long-to-short ratio for DUSK stands at 1.06 on Tuesday, nearing the highest level over a month. This ratio, being above one, indicates that traders are betting on the DUSK price to rally.
DUSK Price Forecast: DUSK bulls aiming for the $0.138 mark
DUSK is trading above $0.110 as of Tuesday, after surging by over 16% the previous day. The near-term bias is bullish after DUSK extended sharply above the 50-day Exponential Moving Average cluster around $0.090 and reclaimed the 100-day and 200-day EMAs, shifting the broader backdrop to the upside. Rising volume on the breakout compared with prior sessions signals improving participation on the buy side.
The Relative Strength Index (RSI) on the daily chart at 65 approaches overbought territory but still supports sustained upside momentum. The Moving Average Convergence Divergence (MACD) line stands above its signal line and above the zero line, with a widening positive histogram that reinforces strengthening bullish pressure.
Initial support is seen at $0.095, where a prior horizontal floor aligns beneath the 50-day EMA and protects the recent impulsive leg higher, followed by a deeper cushion at $0.080 if a larger correction unfolds.
On the topside, the next resistance level is located at $0.138, marking the immediate upside objective for bulls. A daily close above $0.138 would open room for an extension of the advance, while a break below $0.095 would weaken the bullish structure and expose the lower support band.
-1774327788672-1774327788673.png)
(The technical analysis of this story was written with the help of an AI tool.)

Hơn một triệu người dùng dựa vào FXStreet để có dữ liệu thị trường thời gian thực, công cụ biểu đồ, góc nhìn chuyên gia và tin tức Forex. Lịch kinh tế toàn diện và các hội thảo web giáo dục giúp nhà giao dịch luôn cập nhật và đưa ra quyết định có tính toán. FXStreet có khoảng 60 nhân sự, chia giữa trụ sở Barcelona và nhiều khu vực toàn cầu.
Đọc thêm


