
Ethereum Price Forecast: ETH slides below $2,300 following pressure from break-even sellers and short traders
Bởi Michael Ebiekutan
Đã cập nhật: 7 May 2026


BÀI VIẾT PHỔ BIẾN

Ethereum (ETH) is down 2% on Thursday following signs of selling pressure across key onchain metrics.
Ethereum price today: $2,280
- Ethereum has failed to rise above the $2,300-$2,500 range, as this region is dense with realized prices across several investor cohorts.
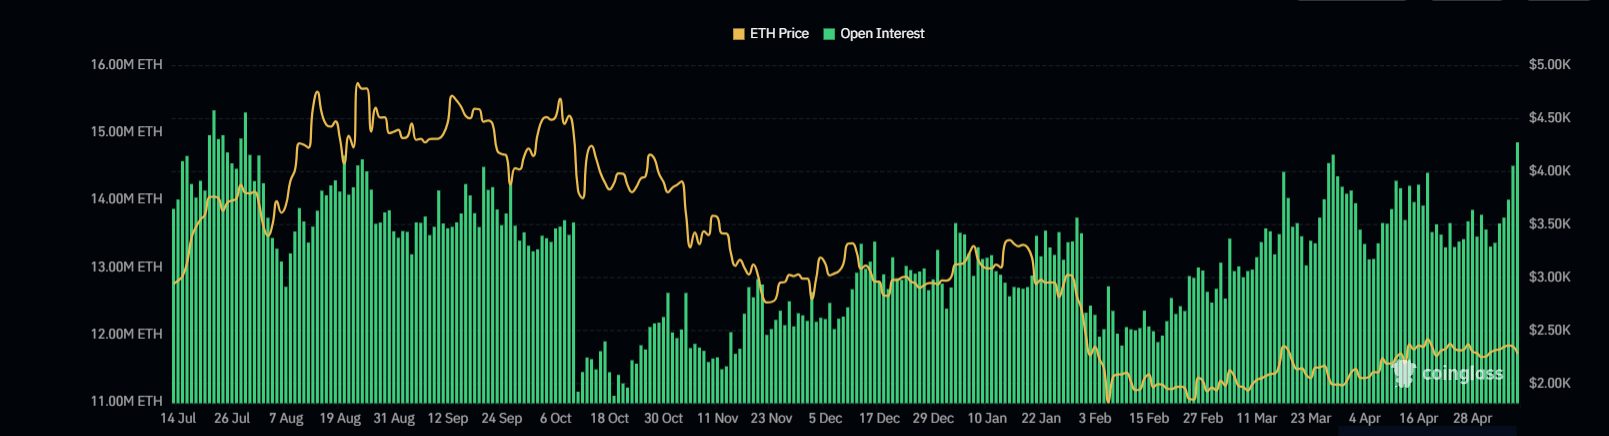
- Open interest climbed to 14.85 million ETH as prices declined, indicating a rapid buildup of short positions.
- ETH saw a rejection near $2,400 as it slid below the 100-day EMA.
Ethereum (ETH) is down 2% on Thursday following signs of selling pressure across key onchain metrics.
Notably, the $2,300-$2,500 range has proven to be a key distribution zone over the past month, outweighing demand at every attempt to rise above the level.
The zone is a critical resistance as it houses the realized price or average onchain cost basis of several cohorts, including whales — wallets with a balance of 10K-100K ETH — and retailers — wallets holding 100-1K and 1K-10K ETH. The realized price of staked ETH also lies within the range.
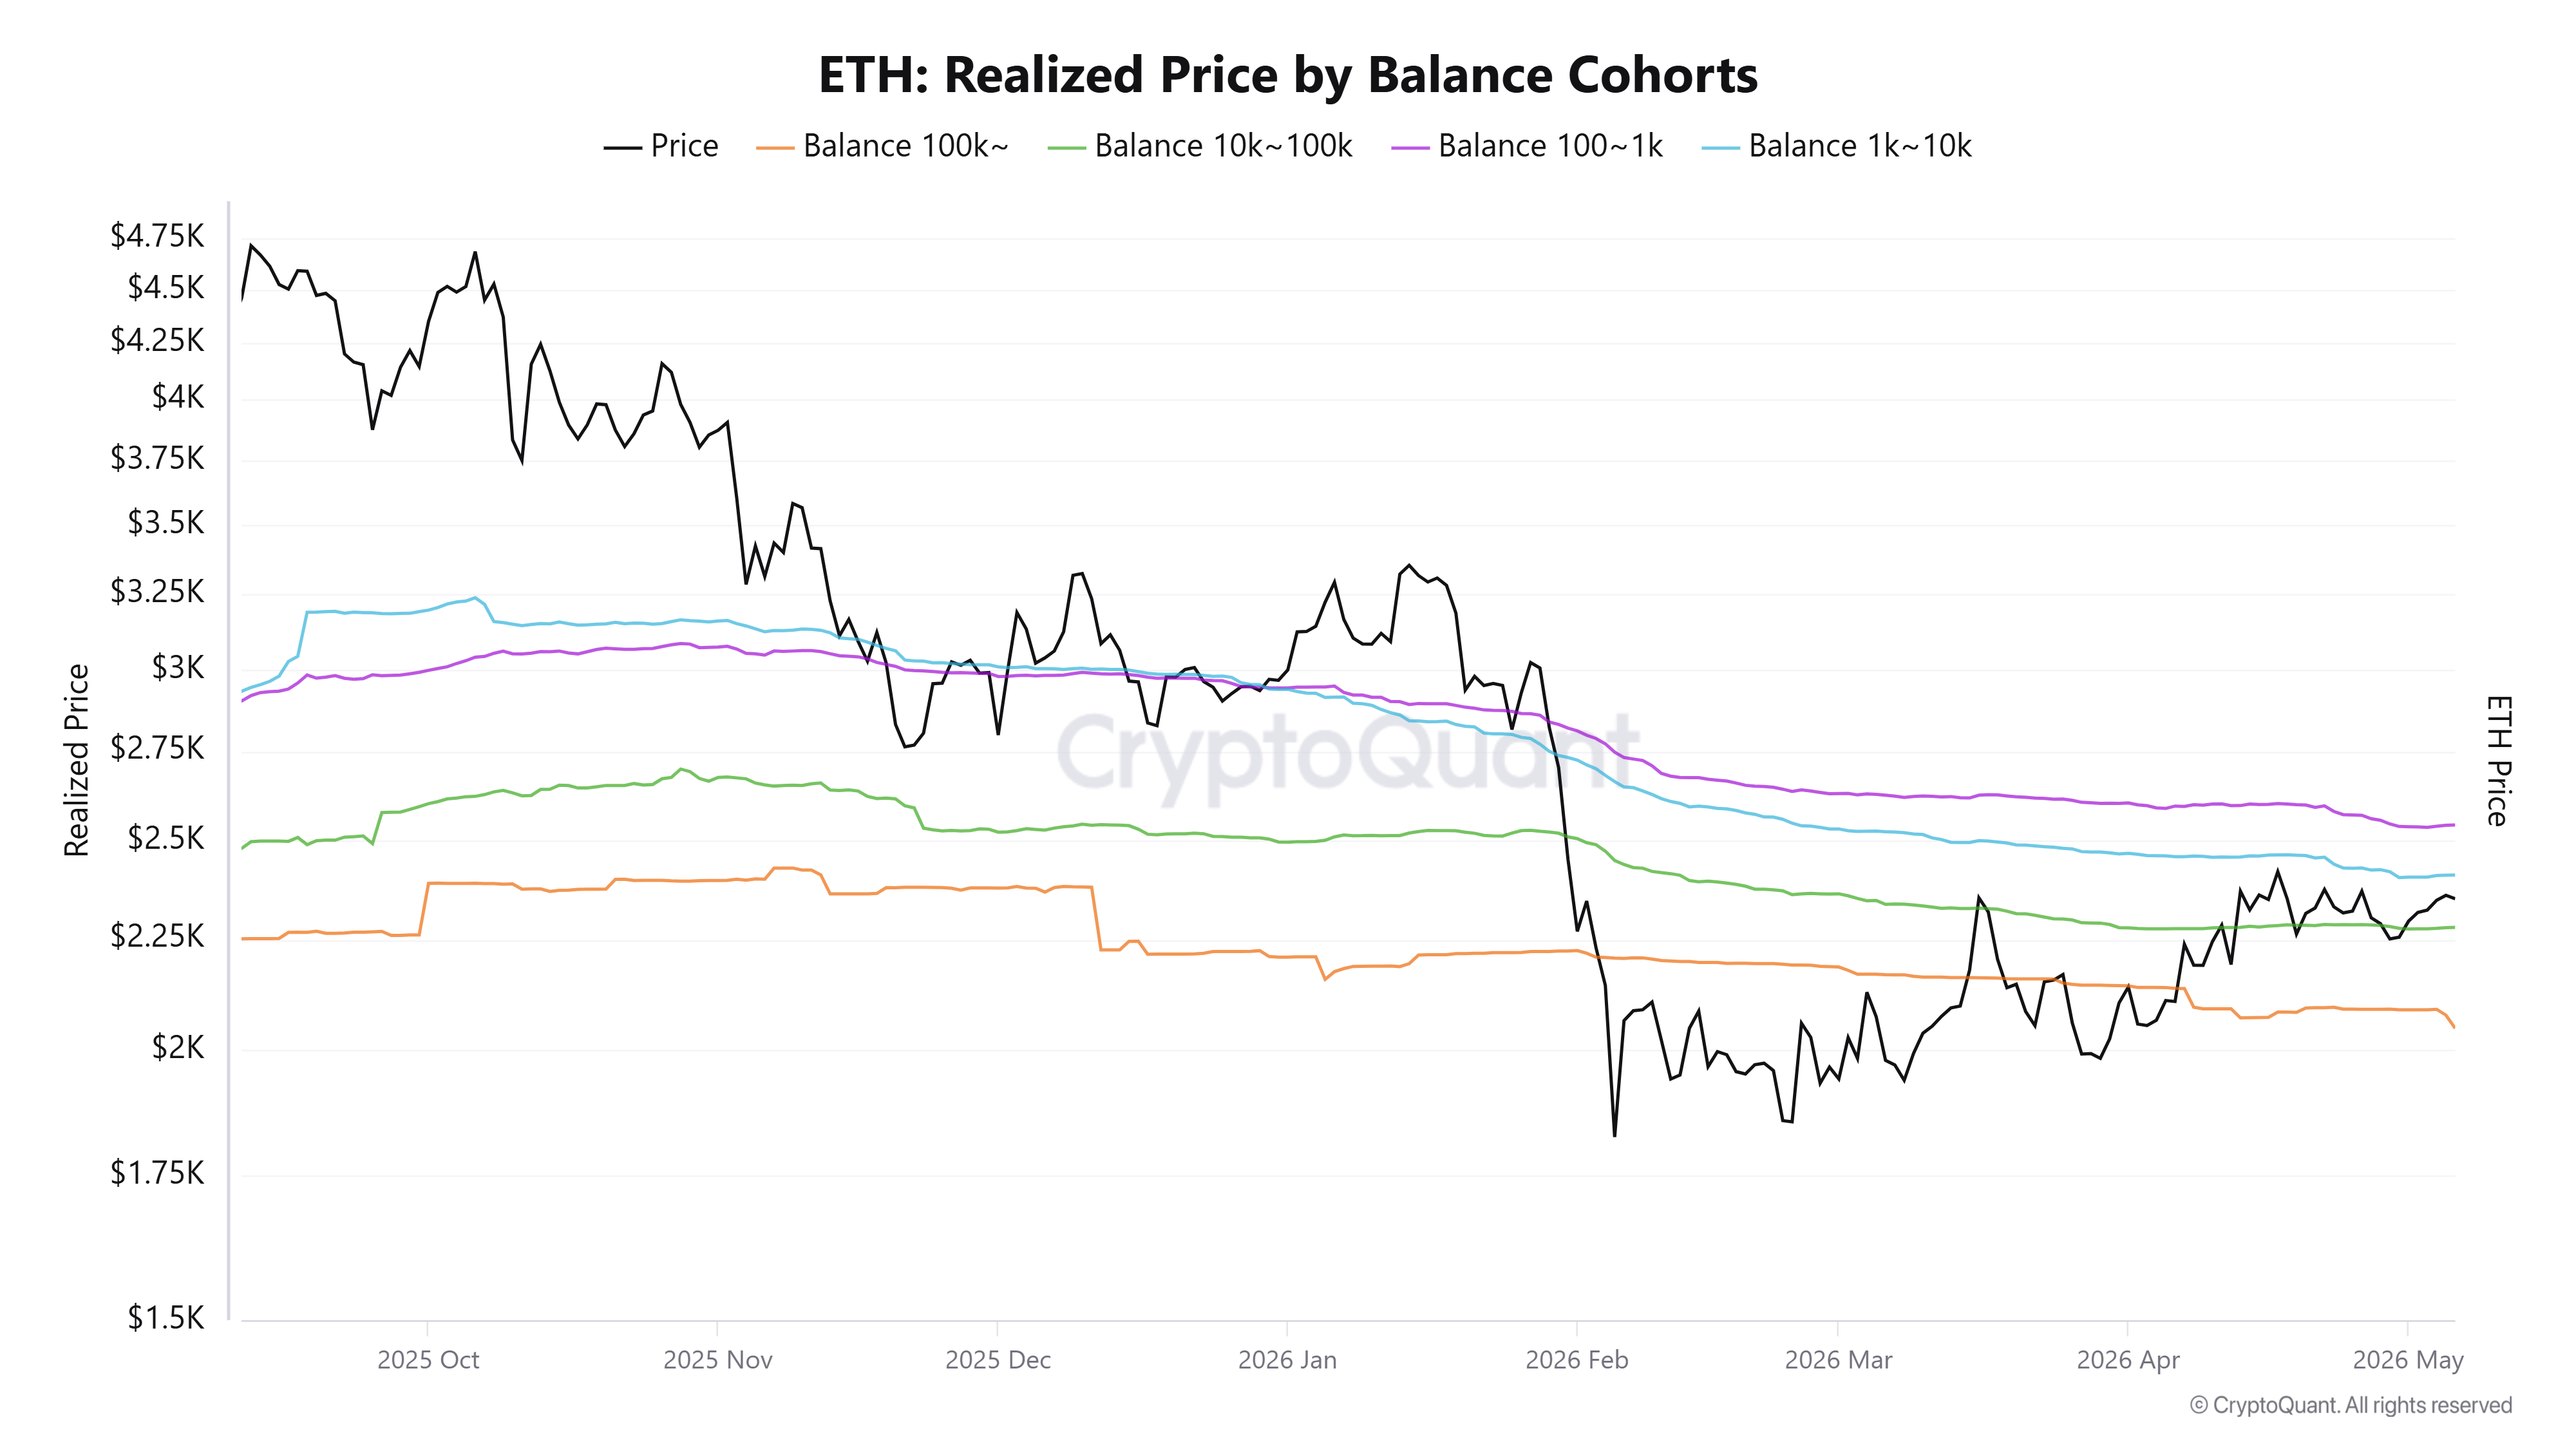
With prices hovering around such regions for a sustained period, investors are likely to distribute after breaking even, especially as the overall crypto market structure has remained cautious.
The impact is more evident across retail cohorts, which have distributed roughly 1.5 million ETH in the past two weeks.
Whales are also gradually contributing to selling activity. Wallets linked to Metalpha and another key whale wallet deposited 27K ETH and 14K ETH, respectively, to Binance on Thursday, according to smart money tracker Lookonchain. The move follows a 166K ETH deposit to Binance on Wednesday by key Bitcoin OG Garrett Jin.
Meanwhile, derivatives data show that bearish bias dominates ETH futures.
Despite prices declining, open interest climbed to 14.85 million ETH, its highest level since last July. Combined with sustained negative funding rates in ETH perpetuals, the move suggests a rapid buildup of short positions.
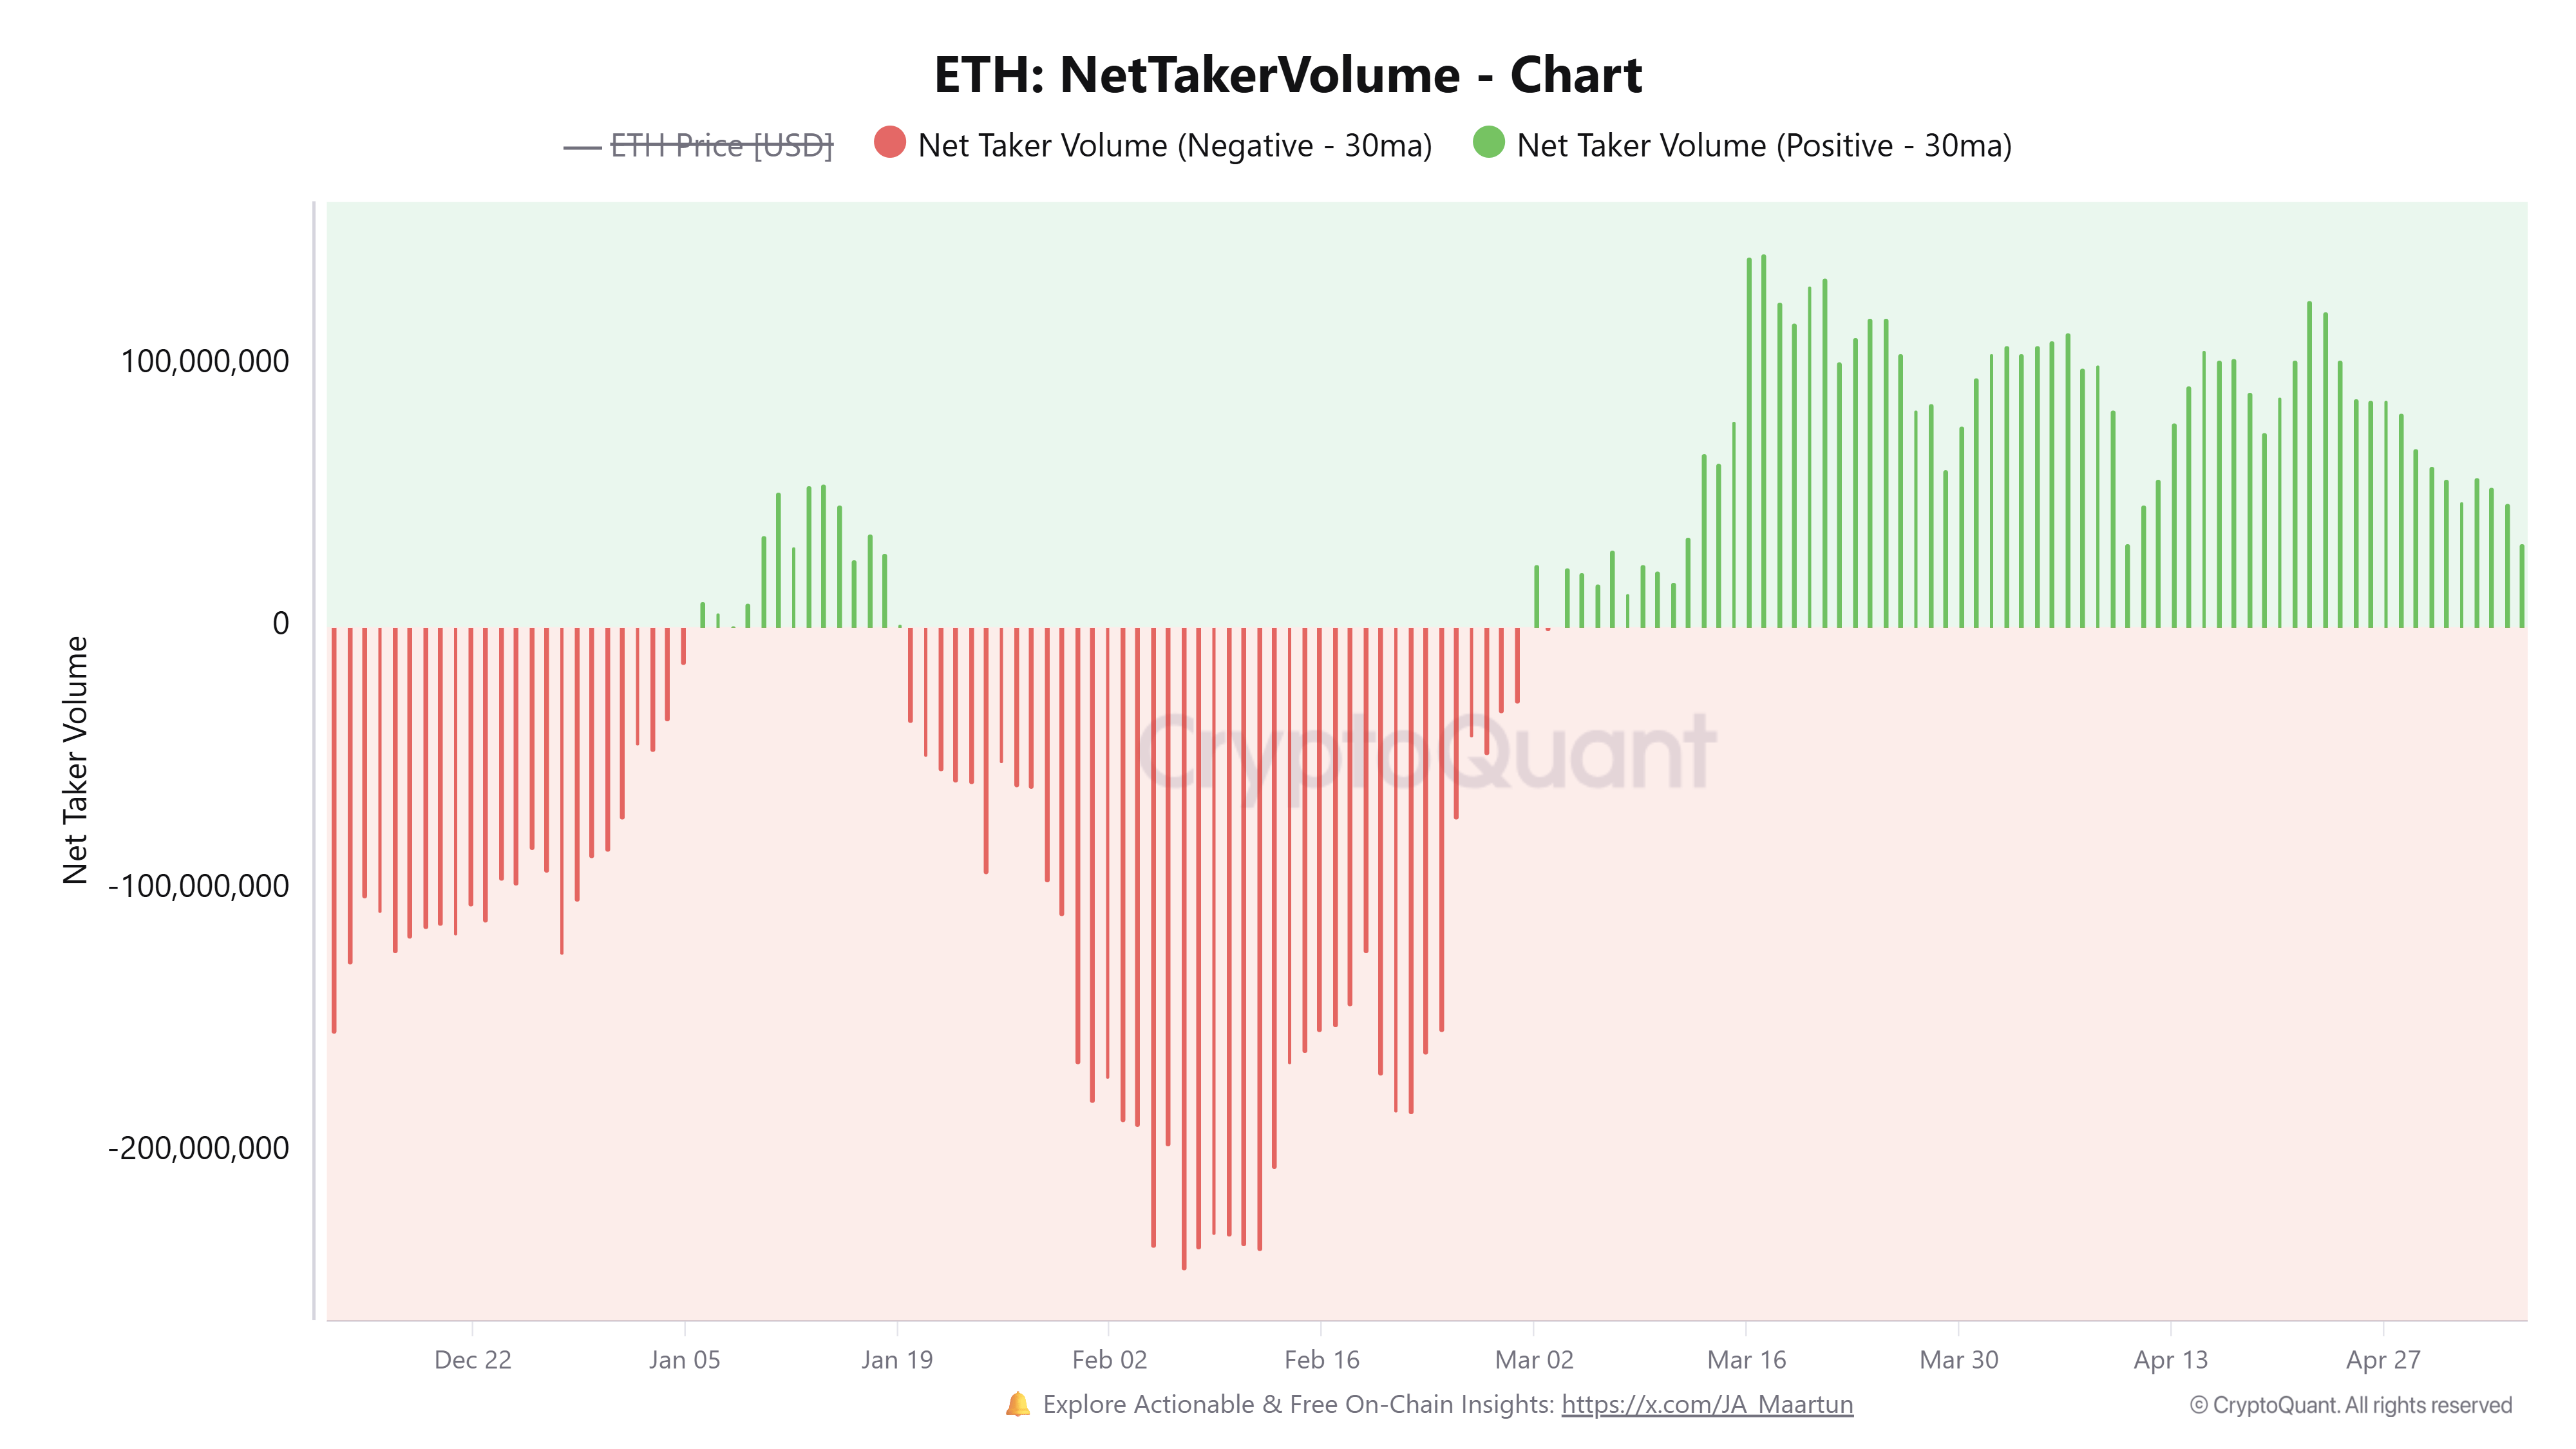
A similar trend is also observed in the 30-day moving average Ethereum Net Taker Volume, which measures the difference in volume between buyers and sellers using market orders to purchase ETH perpetual contracts. The metric has been declining over the past two weeks and is on the cusp of flipping negative, indicating short traders are gradually dominating the futures market.
Ethereum Price Forecast: ETH falters near $2,400, slides below 100-day EMA
Ethereum has recorded $96.3 million in liquidations over the past 24 hours, driven by $89.1 million in liquidated long positions.
On the daily chart, ETH is caught between conflicting moving-average signals, leaving the near-term outlook neutral. The top altcoin holds above the 50-day Exponential Moving Average (EMA) at $2,262, which lends initial trend support, but it remains capped by the 100-day EMA at $2,349, forming a dense overhead barrier.
Momentum is subdued, with the Relative Strength Index (RSI) hovering just below the 50 line and the Stochastic Oscillator (Stoch) sliding toward the 30 area, both hinting at fading bullish pressure rather than an outright bearish reversal.
On the downside, immediate support lies at the 50-day EMA, followed by a stronger floor at the $2,211 horizontal level. A break below there would expose the next cushion at $2,107, followed by deeper levels at $1,909 and $1,741.
On the topside, initial resistance aligns with the 100-day EMA at $2,349, while a sustained move above the horizontal barrier at $2,388 would be needed to reopen the path toward $2,746.
(The technical analysis of this story was written with the help of an AI tool.)

Hơn một triệu người dùng dựa vào FXStreet để có dữ liệu thị trường thời gian thực, công cụ biểu đồ, góc nhìn chuyên gia và tin tức Forex. Lịch kinh tế toàn diện và các hội thảo web giáo dục giúp nhà giao dịch luôn cập nhật và đưa ra quyết định có tính toán. FXStreet có khoảng 60 nhân sự, chia giữa trụ sở Barcelona và nhiều khu vực toàn cầu.
Đọc thêm


