
Ethereum Price Forecast: Network activity indicates recovery even as ETH tests 100-day EMA
Bởi Michael Ebiekutan
Đã cập nhật: 15 Apr 2026


BÀI VIẾT PHỔ BIẾN

Ethereum (ETH) has continued to trade above $3,300 on Wednesday amid improving signs across several key onchain metrics.
Ethereum price today: $2,370
- Ethereum's total transaction count surges to a record high amid a recovery in active addresses.
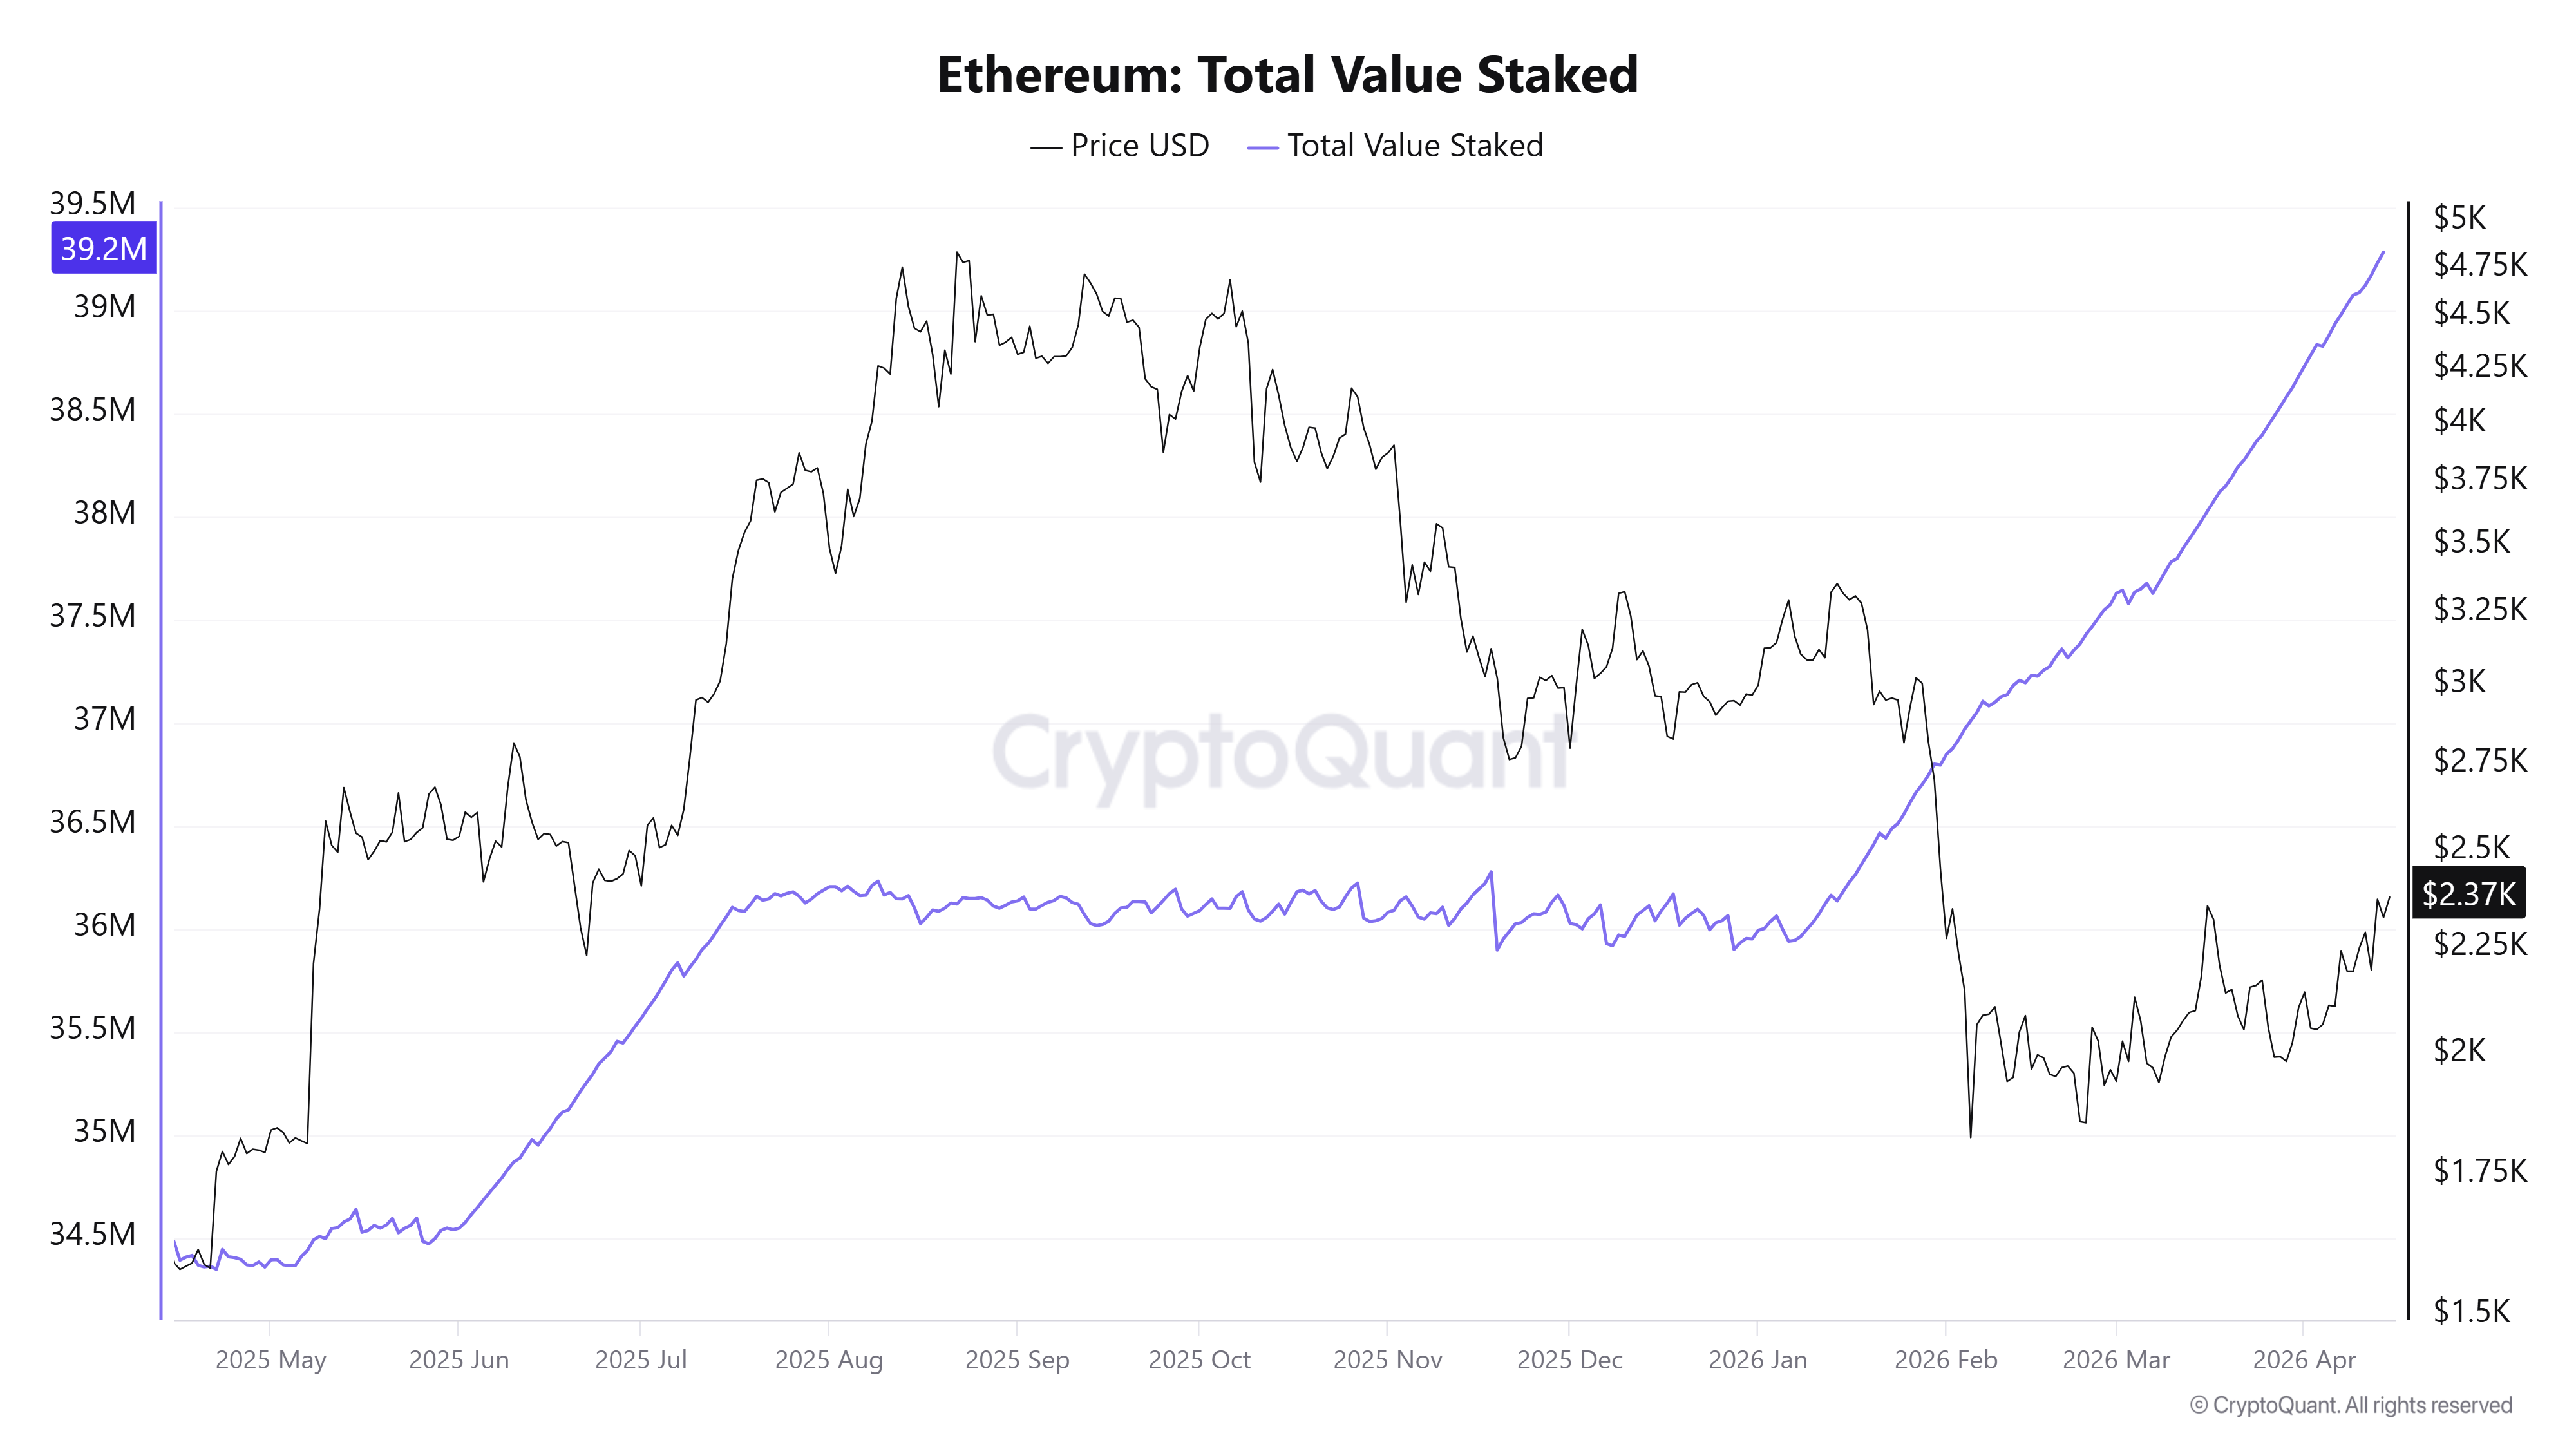
- Staking inflows have continued to trend upward, with the total value staked climbing to 39.28 million ETH.
- ETH is retesting the 100-day EMA after a slight rejection a day earlier.
Ethereum (ETH) has continued to trade above $3,300 on Wednesday amid improving signs across several key onchain metrics.
The fourteen-day moving average of total transaction counts on the Ethereum mainnet has surged to a record high, surpassing levels seen in February. The metric has been trending upward since the beginning of March, showing consistent improvement in network activity over the past six weeks.
Transaction count growth is often driven by increasing DeFi protocol interactions or Layer 2 activity. Instances of a surge in dusting attacks, especially amid the current low-fee environment on Ethereum, have previously led to spikes in the metric.
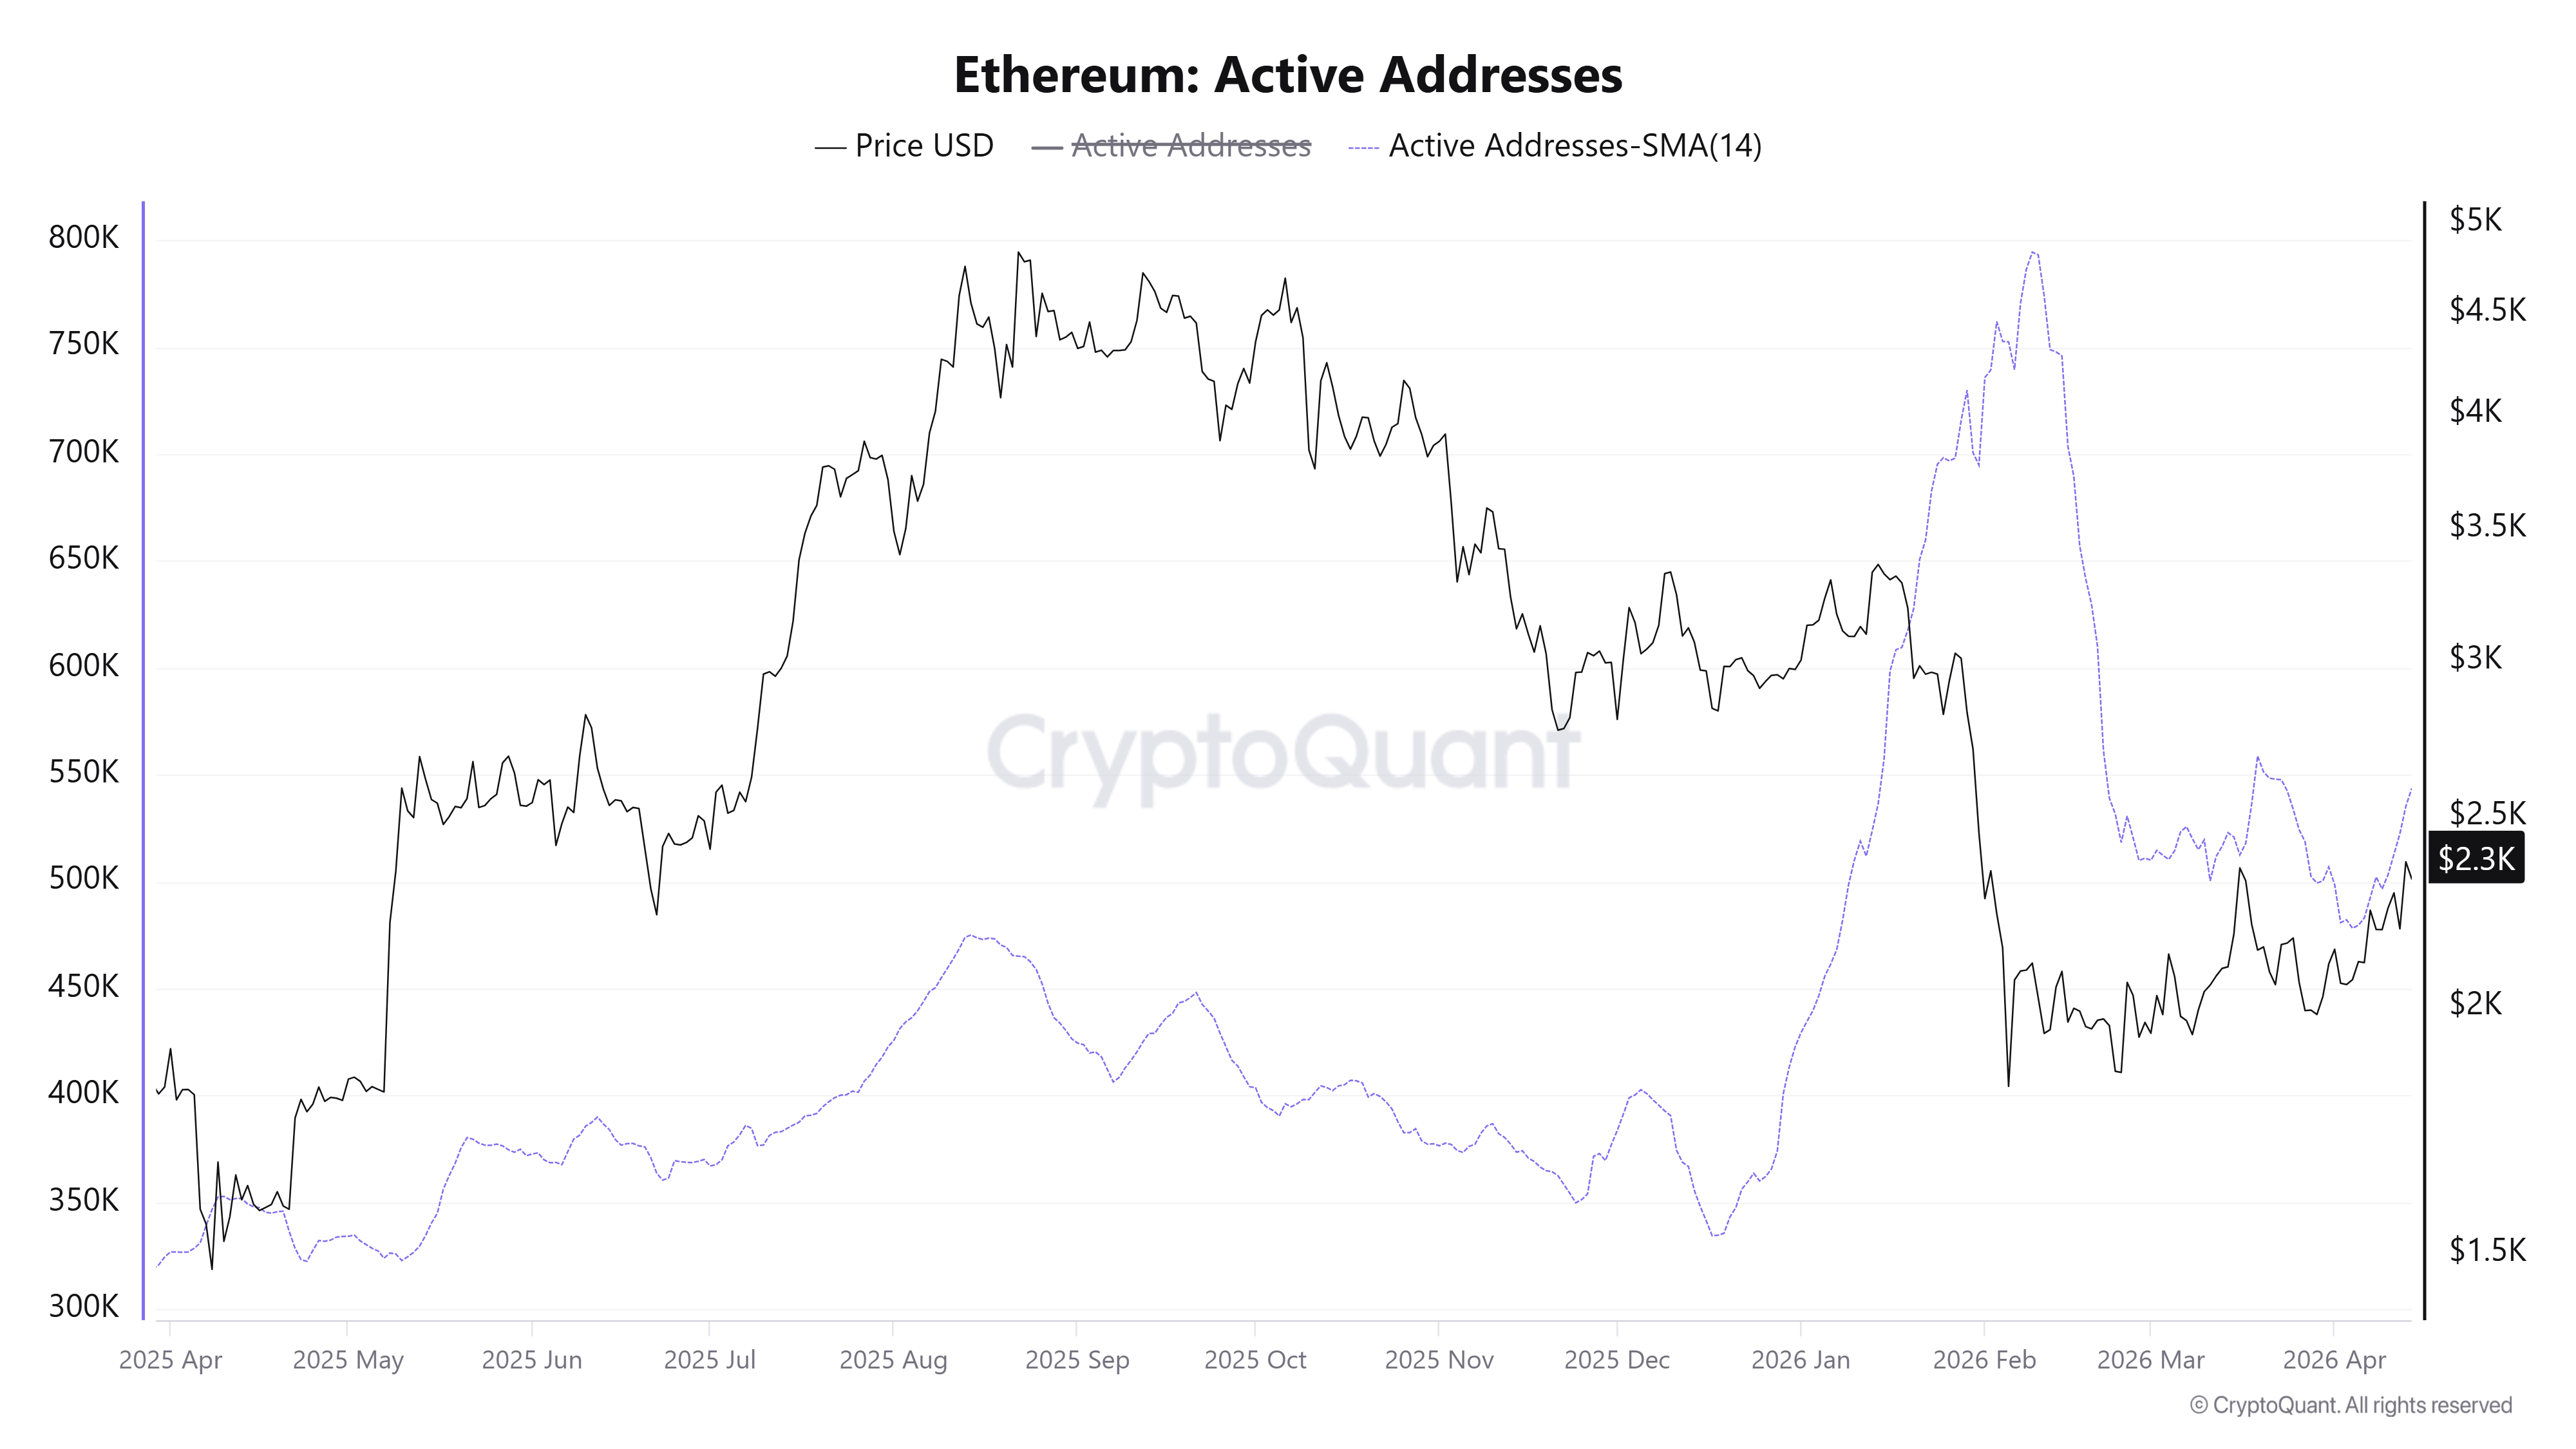
A similar recovery is evident in Ethereum's active addresses, which have begun trending upward after an extended decline to their lowest level since January. However, it remains well below early February levels.
The increase in network activity also comes with an accelerated rise in staking inflows. Since the beginning of April, Ethereum's total value staked has expanded by 550K ETH to 39.28 million ETH. That figure has pushed year-to-date staking inflows to 3.29 million ETH, indicating strong investor interest in contributing to Ethereum's security.
Staking is the process of locking up assets to support the security of blockchain networks in exchange for rewards.
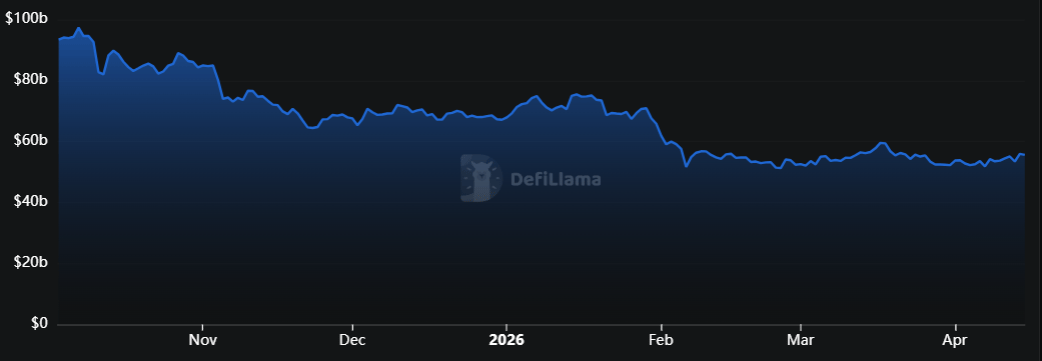
Despite the strong uptrend across these metrics, Ethereum's total value locked (TVL) has remained largely flat at around $55.6 billion over the past month, suggesting weak capital inflows into DeFi protocols on mainnet.
Ethereum Price Forecast: ETH retests 100-day EMA resistance
Ethereum saw $50.4 million in liquidations over the past 24 hours, led by $35.6 million in short liquidations, according to Coinglass data.
On the daily chart, ETH trades at $2,379, maintaining a constructive bullish bias as price holds above the 20-day and 50-day Exponential Moving Averages (EMAs), clustered just below $2,200, while probing a dense overhead band. The 100-day EMA at $2,376 acts as immediate resistance, reinforced by the nearby horizontal barrier at $2,388, suggesting that bulls face a key decision area after the latest advance.
Momentum remains favorable, with the Relative Strength Index (RSI) near 62 pointing to sustained buying pressure, though the Stochastic Oscillator (Stoch) hovering in overbought territory warns that upside progress could slow or trigger a corrective pause.
On the topside, a clear daily close above the 100-day EMA at $2,376 and the $2,388 resistance would open the way toward the next bullish objectives at $2,746 and then $3,411.
On the downside, initial support is seen at $2,211, ahead of the confluence of the 20-day EMA at $2,200 and the 50-day EMA at $2,183. A deeper pullback exposes the horizontal floor at $2,107 and, if broken, more distant levels at $1,909 and $1,741.
(The technical analysis of this story was written with the help of an AI tool.)

Hơn một triệu người dùng dựa vào FXStreet để có dữ liệu thị trường thời gian thực, công cụ biểu đồ, góc nhìn chuyên gia và tin tức Forex. Lịch kinh tế toàn diện và các hội thảo web giáo dục giúp nhà giao dịch luôn cập nhật và đưa ra quyết định có tính toán. FXStreet có khoảng 60 nhân sự, chia giữa trụ sở Barcelona và nhiều khu vực toàn cầu.
Đọc thêm


