
EUR/JPY Price Forecast: Trades near 185.00 after rebounding from triangle bottom
Bởi Akhtar Faruqui
Đã cập nhật: 8 Jun 2026


BÀI VIẾT PHỔ BIẾN

EUR/JPY gains ground after registering over 0.5% in the previous day, trading around 184.90 during the Asian hours on Monday.
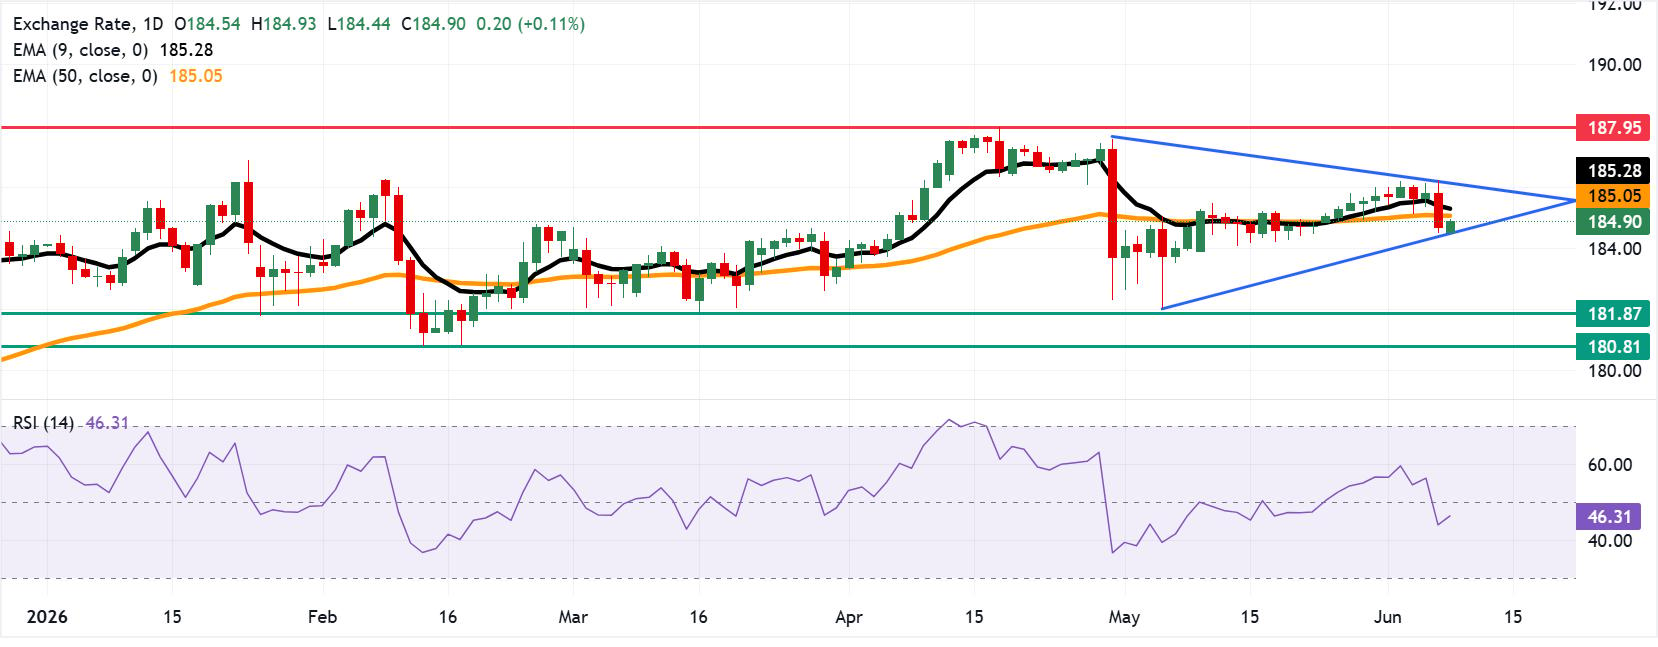
- EUR/JPY may retest the symmetrical triangle's lower support boundary near 184.40.
- The 14-day Relative Strength Index at 45.66 remains below the midline, signaling that bullish momentum is fading.
- The initial barrier lies at the 50-day EMA of 185.05.
EUR/JPY gains ground after registering over 0.5% in the previous day, trading around 184.90 during the Asian hours on Monday. The EUR/JPY cross is holding beneath both the 50-day and nine-day Exponential Moving Averages (EMAs), which keeps the near-term bias tilted to the downside despite the broader uptrend.
The 14-day Relative Strength Index (RSI) at 45.66 stays below the midline, hinting at fading bullish momentum and reinforcing the idea that recent bounces are likely to struggle while price remains capped under this short-term EMA cluster.
The technical analysis of the daily chart suggests the EUR/JPY cross is positioned near the lower boundary of the symmetrical triangle pattern around 184.40. The triangle suggests a period of consolidation, though a break below it would reinforce the bearish bias and put downward pressure on the currency cross to navigate the region around the three-month low of 181.87, recorded on March 16, followed by the nearly six-month low of 180.81, reached on February 12.
On the upside, the primary barrier lies at the 50-day EMA of 185.05, followed by the nine-day EMA at 185.28 and the upper boundary of the symmetrical triangle around 186.30. Further advances would expose the all-time high of 187.95, recorded on April 17.
(The technical analysis of this story was written with the help of an AI tool.)
Euro Price Today
The table below shows the percentage change of Euro (EUR) against listed major currencies today. Euro was the strongest against the Swiss Franc.
| USD | EUR | GBP | JPY | CAD | AUD | NZD | CHF | |
|---|---|---|---|---|---|---|---|---|
| USD | -0.04% | 0.04% | 0.05% | 0.07% | -0.04% | -0.10% | 0.20% | |
| EUR | 0.04% | 0.06% | 0.07% | 0.10% | -0.02% | -0.06% | 0.22% | |
| GBP | -0.04% | -0.06% | 0.00% | 0.03% | -0.12% | -0.14% | 0.14% | |
| JPY | -0.05% | -0.07% | 0.00% | 0.00% | -0.12% | -0.14% | 0.12% | |
| CAD | -0.07% | -0.10% | -0.03% | -0.00% | -0.12% | -0.16% | 0.11% | |
| AUD | 0.04% | 0.02% | 0.12% | 0.12% | 0.12% | -0.03% | 0.25% | |
| NZD | 0.10% | 0.06% | 0.14% | 0.14% | 0.16% | 0.03% | 0.26% | |
| CHF | -0.20% | -0.22% | -0.14% | -0.12% | -0.11% | -0.25% | -0.26% |
The heat map shows percentage changes of major currencies against each other. The base currency is picked from the left column, while the quote currency is picked from the top row. For example, if you pick the Euro from the left column and move along the horizontal line to the US Dollar, the percentage change displayed in the box will represent EUR (base)/USD (quote).

Hơn một triệu người dùng dựa vào FXStreet để có dữ liệu thị trường thời gian thực, công cụ biểu đồ, góc nhìn chuyên gia và tin tức Forex. Lịch kinh tế toàn diện và các hội thảo web giáo dục giúp nhà giao dịch luôn cập nhật và đưa ra quyết định có tính toán. FXStreet có khoảng 60 nhân sự, chia giữa trụ sở Barcelona và nhiều khu vực toàn cầu.
Đọc thêm


