
EUR/USD nears 1.1700 as markets welcome the ceasefire in Iran
Bởi Guillermo Alcala
Đã cập nhật: 8 Apr 2026


BÀI VIẾT PHỔ BIẾN

The announcement of a two-week ceasefire in Iran triggered a relief rally during Wednesday’s Asian trading session that sent the safe-haven US Dollar (USD) tumbling against its main peers.
- EUR/USD extends its recovery from the 1.1500 area to levels near 1.1700.
- A two-week ceasefire in Iran boosted risk appetite and sent the US Dollar tumbling on Wednesday.
- Later in the day, the focus will shift to the minutes of the latest Fed meeting.
The announcement of a two-week ceasefire in Iran triggered a relief rally during Wednesday’s Asian trading session that sent the safe-haven US Dollar (USD) tumbling against its main peers. The EUR/USD extended its rally from 1.1500 to hit five-week highs at 1.1697 so far.
Investors have celebrated a last-minute agreement between Washington and Tehran to cease the hostilities for two weeks and temporarily reopen the Strait of Hormuz. US President Donald Trump had threatened to kill an entire civilisation if the authorities of the Islamic Republic failed to open the critical gateway before Tuesday at 8 PM Easter Time (00:00 GMT on Wednesday).
The situation remains extremely volatile, and news from the region is likely to keep driving markets. Nevertheless, investors are likely to pay more attention to macroeconomic data.
and
In Europe, German Factory orders have shown a 0.9% rebound in February, following an 11.1% decline in January, but short of the market expectations of a 2% increment. Later on the day March Producer Price Index (PPI) is likely to provide further insight about the impact of the energy shock on the Eurozone productive sector. Eurozone Retail Sales are also out on Wednesday, but they predate Iran’s war, and therefore, their impact is likely to be limited.
In the US, the main focus will be on the minutes of the Federal Reserve (Fed) March’s March meeting to assess the path of the central bank’s next monetary policy decisions.
Technical Analysis: Bulls aiming for 1.1700 and higher
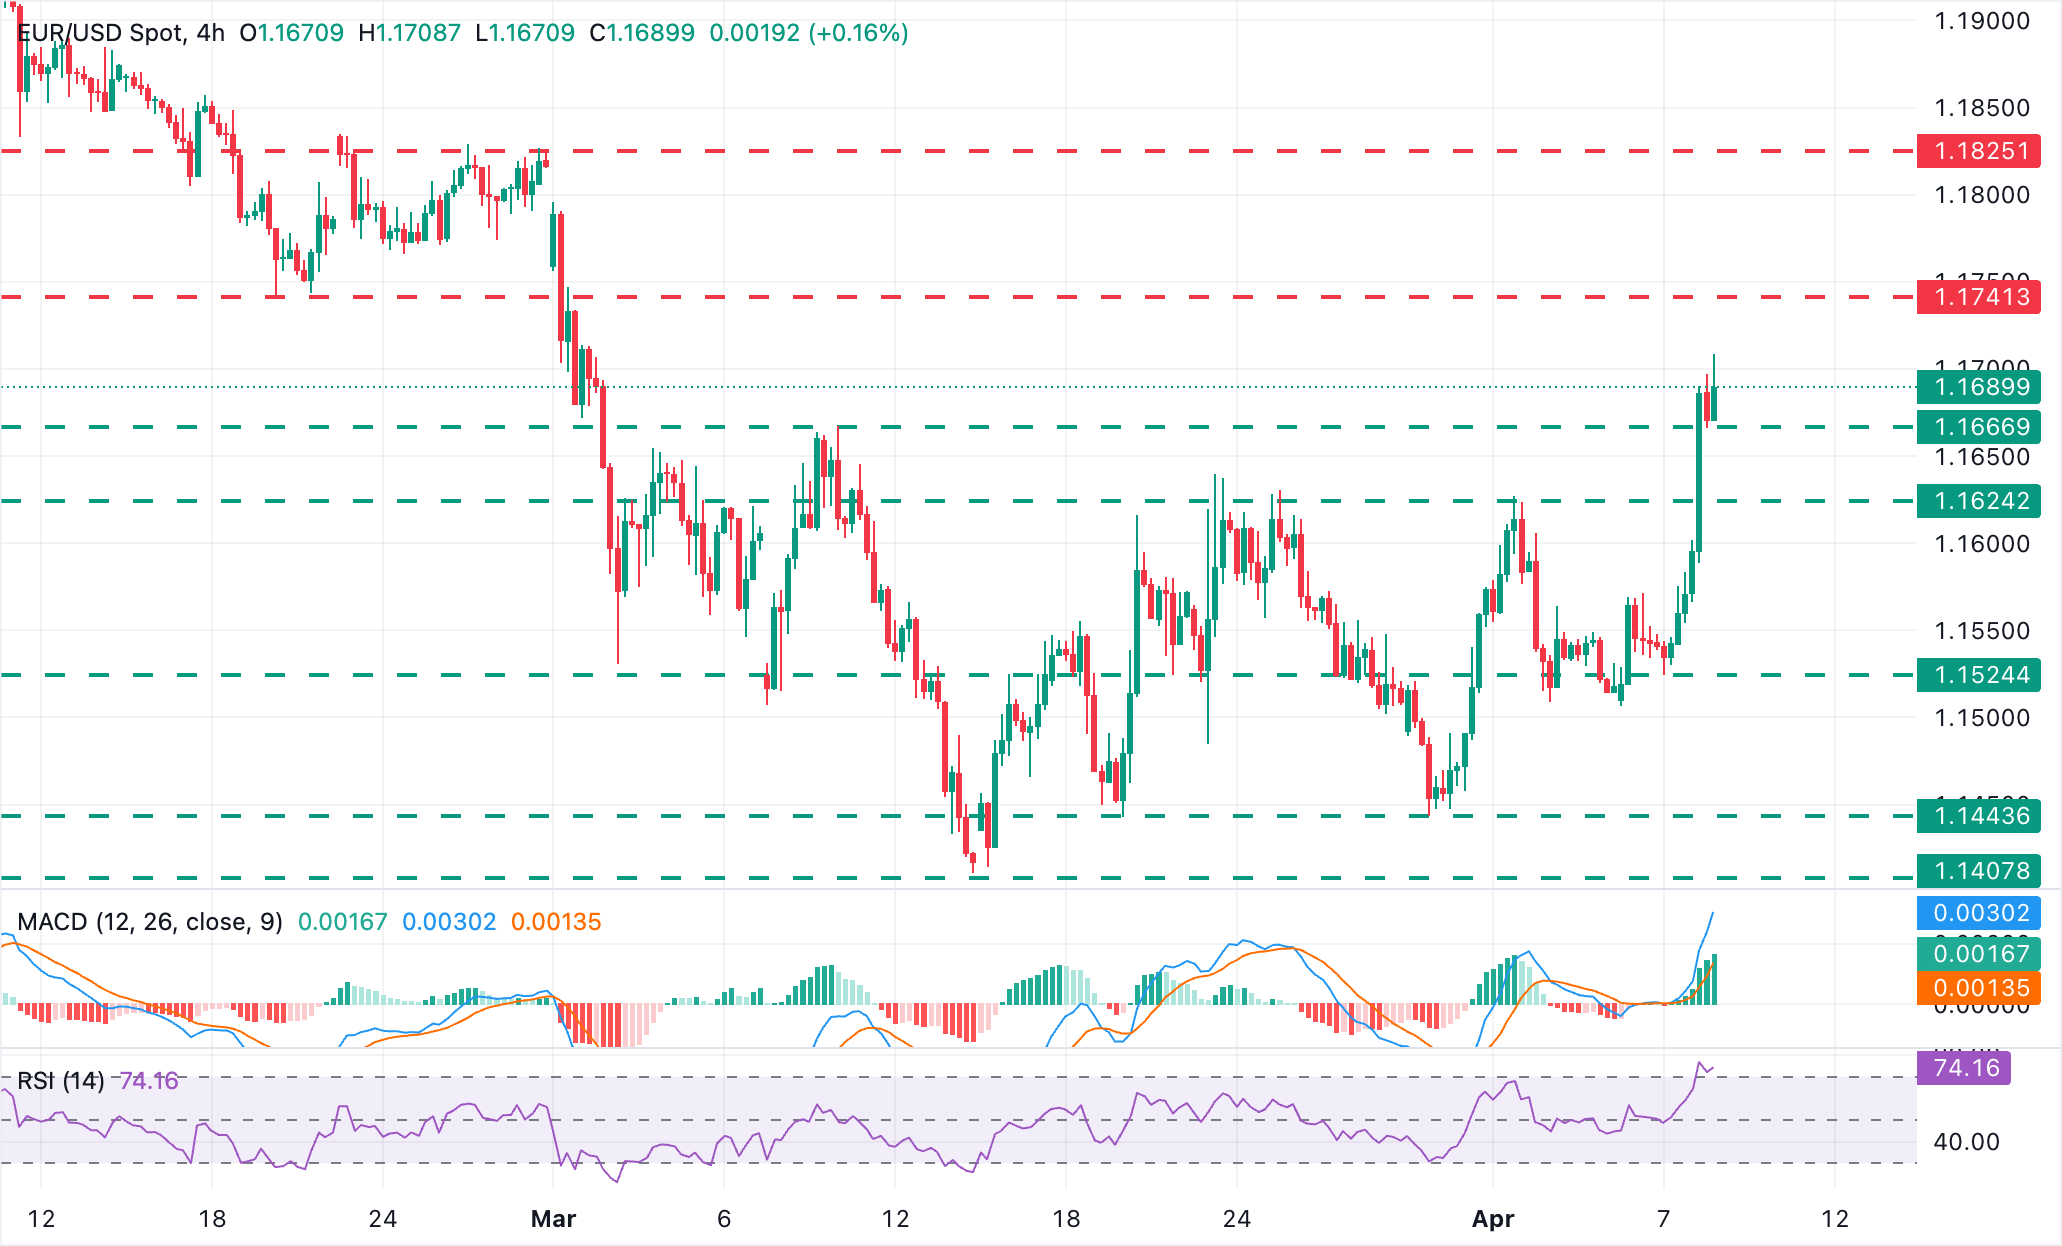
EUR/USD trades at 1.1690 amid a cautiously bullish near-term bias. The Relative Strength Index (RSI) has reached overbought levels, but downside attempts are finding buyers so far. The Moving Average Convergence Divergence (MACD) line has turned positive and stands above its signal with an expanding histogram, which reinforces building buying pressure.
Bulls have been capped a few pips below 1.1700, yet price action stands comfortably above the previous range top, at 1.1670. Further up, the next targets might be the February 19 and 20 lows, in the 1.1740 area, and the February 26 and 27 highs, around 1.1825.
On the downside, a bearish reaction below March 10 highs near 1.1670 would target the 1.1630-1.1640 area (March 23, 25, and April 1 highs). A reversal to Tuesday's lows at 1.1525 seems off the cards right now.
(The technical analysis of this story was written with the help of an AI tool.)
Economic Indicator
Factory Orders s.a. (MoM)
The Factory orders released by the Deutsche Bundesbank is an indicator that includes shipments, inventories, and new and unfilled orders. An increase in the factory order total may indicate an expansion in the German economy and could be an inflationary factor. It is worth noting that the German Factory barely influences, either positively or negatively, the total Eurozone GDP. A high reading is positive (or bullish) for the EUR, while a low reading is negative.
Read more.Last release: Wed Apr 08, 2026 06:00
Frequency: Monthly
Actual: 0.9%
Consensus: 2%
Previous: -11.1%
Source: Federal Statistics Office of Germany
Economic Indicator
Producer Price Index (YoY)
The Producer Price Index (PPI) released by the Eurostat is an index that measures the change in prices received by domestic producers of commodities in all stages of processing (crude materials, intermediate materials, and finished goods). Generally, a high reading is seen positive (or bullish) for the EUR, while a low reading is seen as negative (or bearish).
Read more.Next release: Wed Apr 08, 2026 09:00
Frequency: Monthly
Consensus: -3%
Previous: -2.1%
Source: Eurostat

Hơn một triệu người dùng dựa vào FXStreet để có dữ liệu thị trường thời gian thực, công cụ biểu đồ, góc nhìn chuyên gia và tin tức Forex. Lịch kinh tế toàn diện và các hội thảo web giáo dục giúp nhà giao dịch luôn cập nhật và đưa ra quyết định có tính toán. FXStreet có khoảng 60 nhân sự, chia giữa trụ sở Barcelona và nhiều khu vực toàn cầu.
Đọc thêm


