
EUR/USD Price Forecast: Eyes 1.1500 barrier near nine-day EMA
Bởi Akhtar Faruqui
Ngày xuất bản: 19 Mar 2026 | Ngày chỉnh sửa: 19 Mar 2026


BÀI VIẾT PHỔ BIẾN

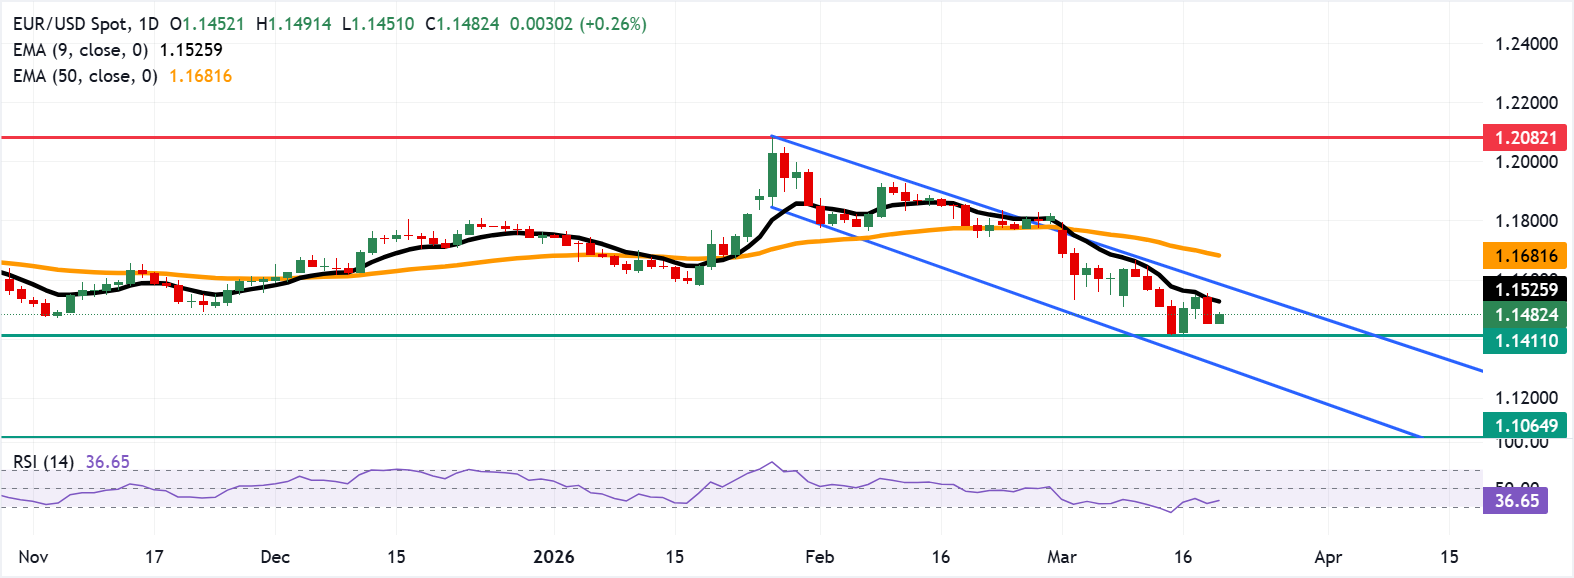
EUR/USD recovers its losses registered in the previous session, hovering near 1.1490 during Asian trading hours on Thursday. Daily chart technical analysis indicates a persistent bearish bias as the pair moves downwards within a descending channel pattern.
- EUR/USD may fall toward the seven-month low of 1.1411.
- The 14-day Relative Strength Index stands at 37, signaling ongoing bearish momentum.
- Initial resistance is seen at the nine-day EMA around 1.1526.
EUR/USD recovers its losses registered in the previous session, hovering near 1.1490 during Asian trading hours on Thursday. Daily chart technical analysis indicates a persistent bearish bias as the pair moves downwards within a descending channel pattern.
The near-term bias is mildly bearish as the EUR/USD pair holds below both the nine-day and 50-day Exponential Moving Averages (EMAs), which cap recovery attempts around the mid-1.15s and high-1.16s, respectively. The short-term average trend is below the medium-term one and tracks the price lower, reinforcing downside pressure after the recent series of lower closes from the 1.19 area.
The 14-day Relative Strength Index (RSI) momentum indicator at 37 stays below the 50 line, confirming prevailing selling momentum without yet signaling a deeply oversold condition.
The EUR/USD pair may find its primary support at the seven-month low of 1.1411, recorded on March 13. Further support lies at the lower boundary of the descending channel around 1.1310.
On the upside, the initial resistance lies at the nine-day EMA of 1.1526, followed by the upper descending channel boundary around 1.1600. A break above the channel would strengthen the market bias and support the pair in testing the 50-day EMA at 1.681.
(The technical analysis of this story was written with the help of an AI tool.)
Euro Price Today
The table below shows the percentage change of Euro (EUR) against listed major currencies today. Euro was the strongest against the US Dollar.
| USD | EUR | GBP | JPY | CAD | AUD | NZD | CHF | |
|---|---|---|---|---|---|---|---|---|
| USD | -0.27% | -0.25% | -0.16% | -0.08% | -0.39% | -0.43% | -0.18% | |
| EUR | 0.27% | 0.00% | 0.09% | 0.20% | -0.12% | -0.19% | 0.09% | |
| GBP | 0.25% | 0.00% | 0.08% | 0.19% | -0.13% | -0.19% | 0.07% | |
| JPY | 0.16% | -0.09% | -0.08% | 0.06% | -0.25% | -0.34% | -0.02% | |
| CAD | 0.08% | -0.20% | -0.19% | -0.06% | -0.29% | -0.38% | -0.10% | |
| AUD | 0.39% | 0.12% | 0.13% | 0.25% | 0.29% | -0.07% | 0.20% | |
| NZD | 0.43% | 0.19% | 0.19% | 0.34% | 0.38% | 0.07% | 0.27% | |
| CHF | 0.18% | -0.09% | -0.07% | 0.02% | 0.10% | -0.20% | -0.27% |
The heat map shows percentage changes of major currencies against each other. The base currency is picked from the left column, while the quote currency is picked from the top row. For example, if you pick the Euro from the left column and move along the horizontal line to the US Dollar, the percentage change displayed in the box will represent EUR (base)/USD (quote).

Hơn một triệu người dùng dựa vào FXStreet để có dữ liệu thị trường thời gian thực, công cụ biểu đồ, góc nhìn chuyên gia và tin tức Forex. Lịch kinh tế toàn diện và các hội thảo web giáo dục giúp nhà giao dịch luôn cập nhật và đưa ra quyết định có tính toán. FXStreet có khoảng 60 nhân sự, chia giữa trụ sở Barcelona và nhiều khu vực toàn cầu.
Đọc thêm


