
EUR/USD Price Forecast: Remains above 1.1700 as bullish momentum builds
Bởi Akhtar Faruqui
Ngày xuất bản: 22 Dec 2025 | Ngày chỉnh sửa: 22 Dec 2025


BÀI VIẾT PHỔ BIẾN

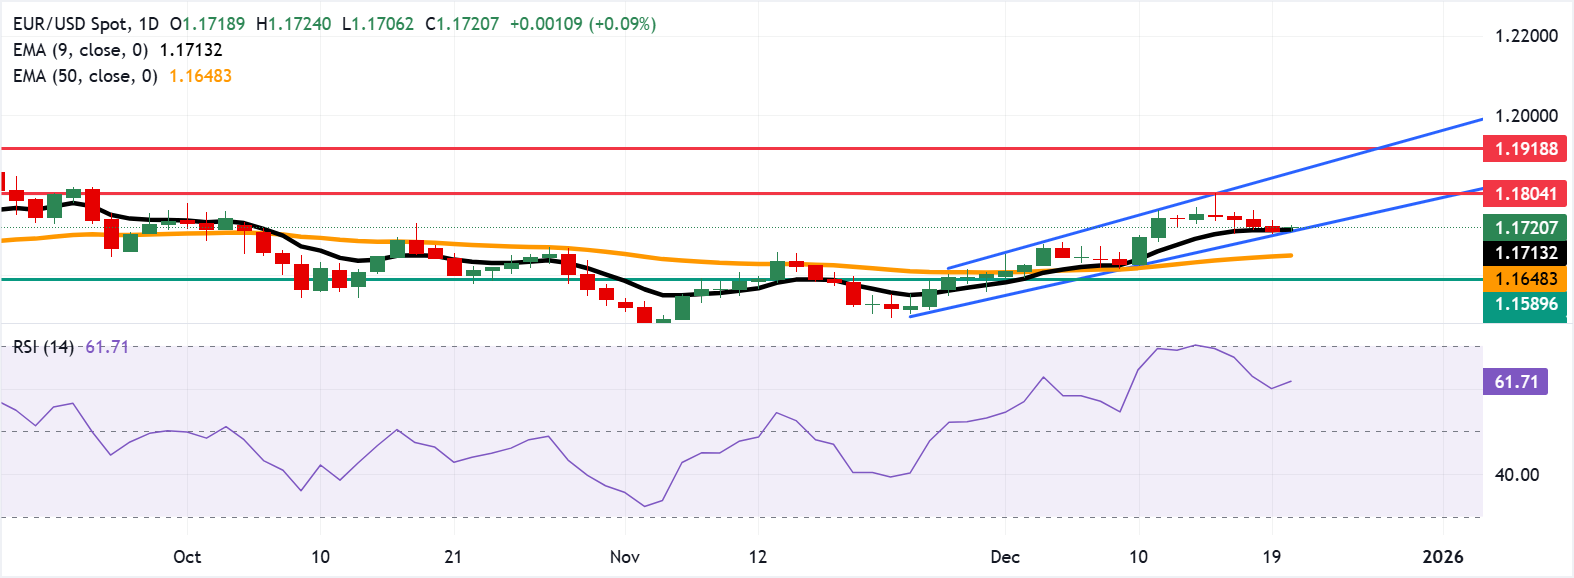
EUR/USD breaks its four-day losing streak, trading around 1.1720 during the Asian hours on Monday. On the daily chart, technical analysis indicates a prevailing bullish bias, as the pair remains slightly above the ascending channel pattern.
- EUR/USD may rise toward the psychological level of 1.1800.
- The 14-day Relative Strength Index at 61.63 stays in bullish territory, confirming strong momentum.
- The initial support appears at the nine-day EMA of 1.1713.
EUR/USD breaks its four-day losing streak, trading around 1.1720 during the Asian hours on Monday. On the daily chart, technical analysis indicates a prevailing bullish bias, as the pair remains slightly above the ascending channel pattern. Additionally, the 14-day Relative Strength Index (RSI) at 61.63 remains in bullish territory, confirming firm momentum. RSI above 60 reinforces upward pressure and could sustain tests of nearby ceilings.
The nine-day Exponential Moving Average (EMA) rises and stands above the 50-day EMA, preserving a bullish bias. The EUR/USD pair holding above both averages supports continuation. The positive moving-average alignment keeps the path of least resistance to the upside.
The EUR/USD pair may target the psychological level of 1.1800, aligned with the two-month high of 1.1804, reached on December 16. A break above this resistance area would open the path toward the upper boundary of the ascending channel around 1.1860. Further advances above the channel would lead the pair to explore the region around 1.1918, the highest since June 2021.
On the downside, the immediate support lies at the nine-day EMA of 1.1713, aligned with the lower ascending channel boundary around 1.1710. A break below the channel would weaken the short-term price momentum and put downward pressure on the EUR/USD pair to test the 50-day EMA at 1.1648, followed by the three-week low of 1.1589, which was recorded on December 1.
Euro Price Today
The table below shows the percentage change of Euro (EUR) against listed major currencies today. Euro was the strongest against the US Dollar.
| USD | EUR | GBP | JPY | CAD | AUD | NZD | CHF | |
|---|---|---|---|---|---|---|---|---|
| USD | -0.08% | -0.18% | -0.22% | -0.04% | -0.23% | -0.18% | -0.09% | |
| EUR | 0.08% | -0.10% | -0.13% | 0.04% | -0.16% | -0.13% | -0.01% | |
| GBP | 0.18% | 0.10% | -0.02% | 0.14% | -0.08% | 0.00% | 0.09% | |
| JPY | 0.22% | 0.13% | 0.02% | 0.18% | -0.02% | 0.04% | 0.13% | |
| CAD | 0.04% | -0.04% | -0.14% | -0.18% | -0.19% | -0.14% | -0.04% | |
| AUD | 0.23% | 0.16% | 0.08% | 0.02% | 0.19% | 0.05% | 0.14% | |
| NZD | 0.18% | 0.13% | -0.00% | -0.04% | 0.14% | -0.05% | 0.09% | |
| CHF | 0.09% | 0.01% | -0.09% | -0.13% | 0.04% | -0.14% | -0.09% |
The heat map shows percentage changes of major currencies against each other. The base currency is picked from the left column, while the quote currency is picked from the top row. For example, if you pick the Euro from the left column and move along the horizontal line to the US Dollar, the percentage change displayed in the box will represent EUR (base)/USD (quote).
The technical analysis of this story was written with the help of an AI tool.)

Hơn một triệu người dùng dựa vào FXStreet để có dữ liệu thị trường thời gian thực, công cụ biểu đồ, góc nhìn chuyên gia và tin tức Forex. Lịch kinh tế toàn diện và các hội thảo web giáo dục giúp nhà giao dịch luôn cập nhật và đưa ra quyết định có tính toán. FXStreet có khoảng 60 nhân sự, chia giữa trụ sở Barcelona và nhiều khu vực toàn cầu.
Đọc thêm


