
FTX Token Price Forecast: FTT flashes signs of recovery amid $2.2 billion payout
Bởi Vishal Dixit
Đã cập nhật: 31 Mar 2026


BÀI VIẾT PHỔ BIẾN

FTX Token (FTT) is up 4% at press time on Tuesday, extending the nearly 7% gains from the previous day. This week’s recovery aligns with the fourth scheduled payout from the FTX Recovery Trust worth $2.2 billion to its former customers and creditors.
- FTX Token extends gains on Tuesday after a roughly 7% rise the previous day, signaling a potential positive reversal.
- The FTX Recovery Trust will distribute $2.2 billion in payouts to its former customers and creditors.
- The technical outlook is mildly bearish, as the 50-day EMA has consistently capped recovery attempts.
FTX Token (FTT) is up 4% at press time on Tuesday, extending the nearly 7% gains from the previous day. This week’s recovery aligns with the fourth scheduled payout from the FTX Recovery Trust worth $2.2 billion to its former customers and creditors. Still, the technical outlook for FTT is grim with the overhanging 50-day Exponential Moving Average (EMA) continuing to cap recovery attempts.
FTX Recovery Trust payouts reach $10 billion
The FTX Recovery Trust will distribute its fourth round of payouts of $2.2 billion on Tuesday, reimbursing its creditors and former customers of the exchange. This payout will bring the reimbursement total to $10 billion, with the fifth round scheduled for May 29.
Initial reports suggested that the FTX exchange owed $11.2 billion to its customers and creditors, and the rapid recovery of the exchange’s assets has helped restore the US dollar value of creditors' and users' holdings. For convenience claims, the Recovery Trust will provide an additional 20% interest on the original claim.
However, this still leaves the massive upside as the holding value in US dollars is based on November 2022 levels.
Technical outlook: Will FTT recovery cross above the 50-day EMA?
FTX Token shows a steady recovery so far this week with consecutive days of gains, reaching the 50-day EMA at $0.3201. The cluster of 50-, 100-, and 200-day EMAs remains well above the spot price, preserving a broader downtrend backdrop. A decisive close above $0.3201 would confirm a positive reversal, targeting the 100-day EMA at $0.3904.
The Moving Average Convergence Divergence (MACD) line stands above its signal line and in positive territory, with a modestly positive histogram, suggesting building upside momentum. Meanwhile, the Relative Strength Index (RSI) at 57 exits oversold territory and supports a recovery phase rather than an exhaustion phase.
The near-term bias turns cautiously bullish as price extends its recovery away from the recent $0.27 area while momentum improves.
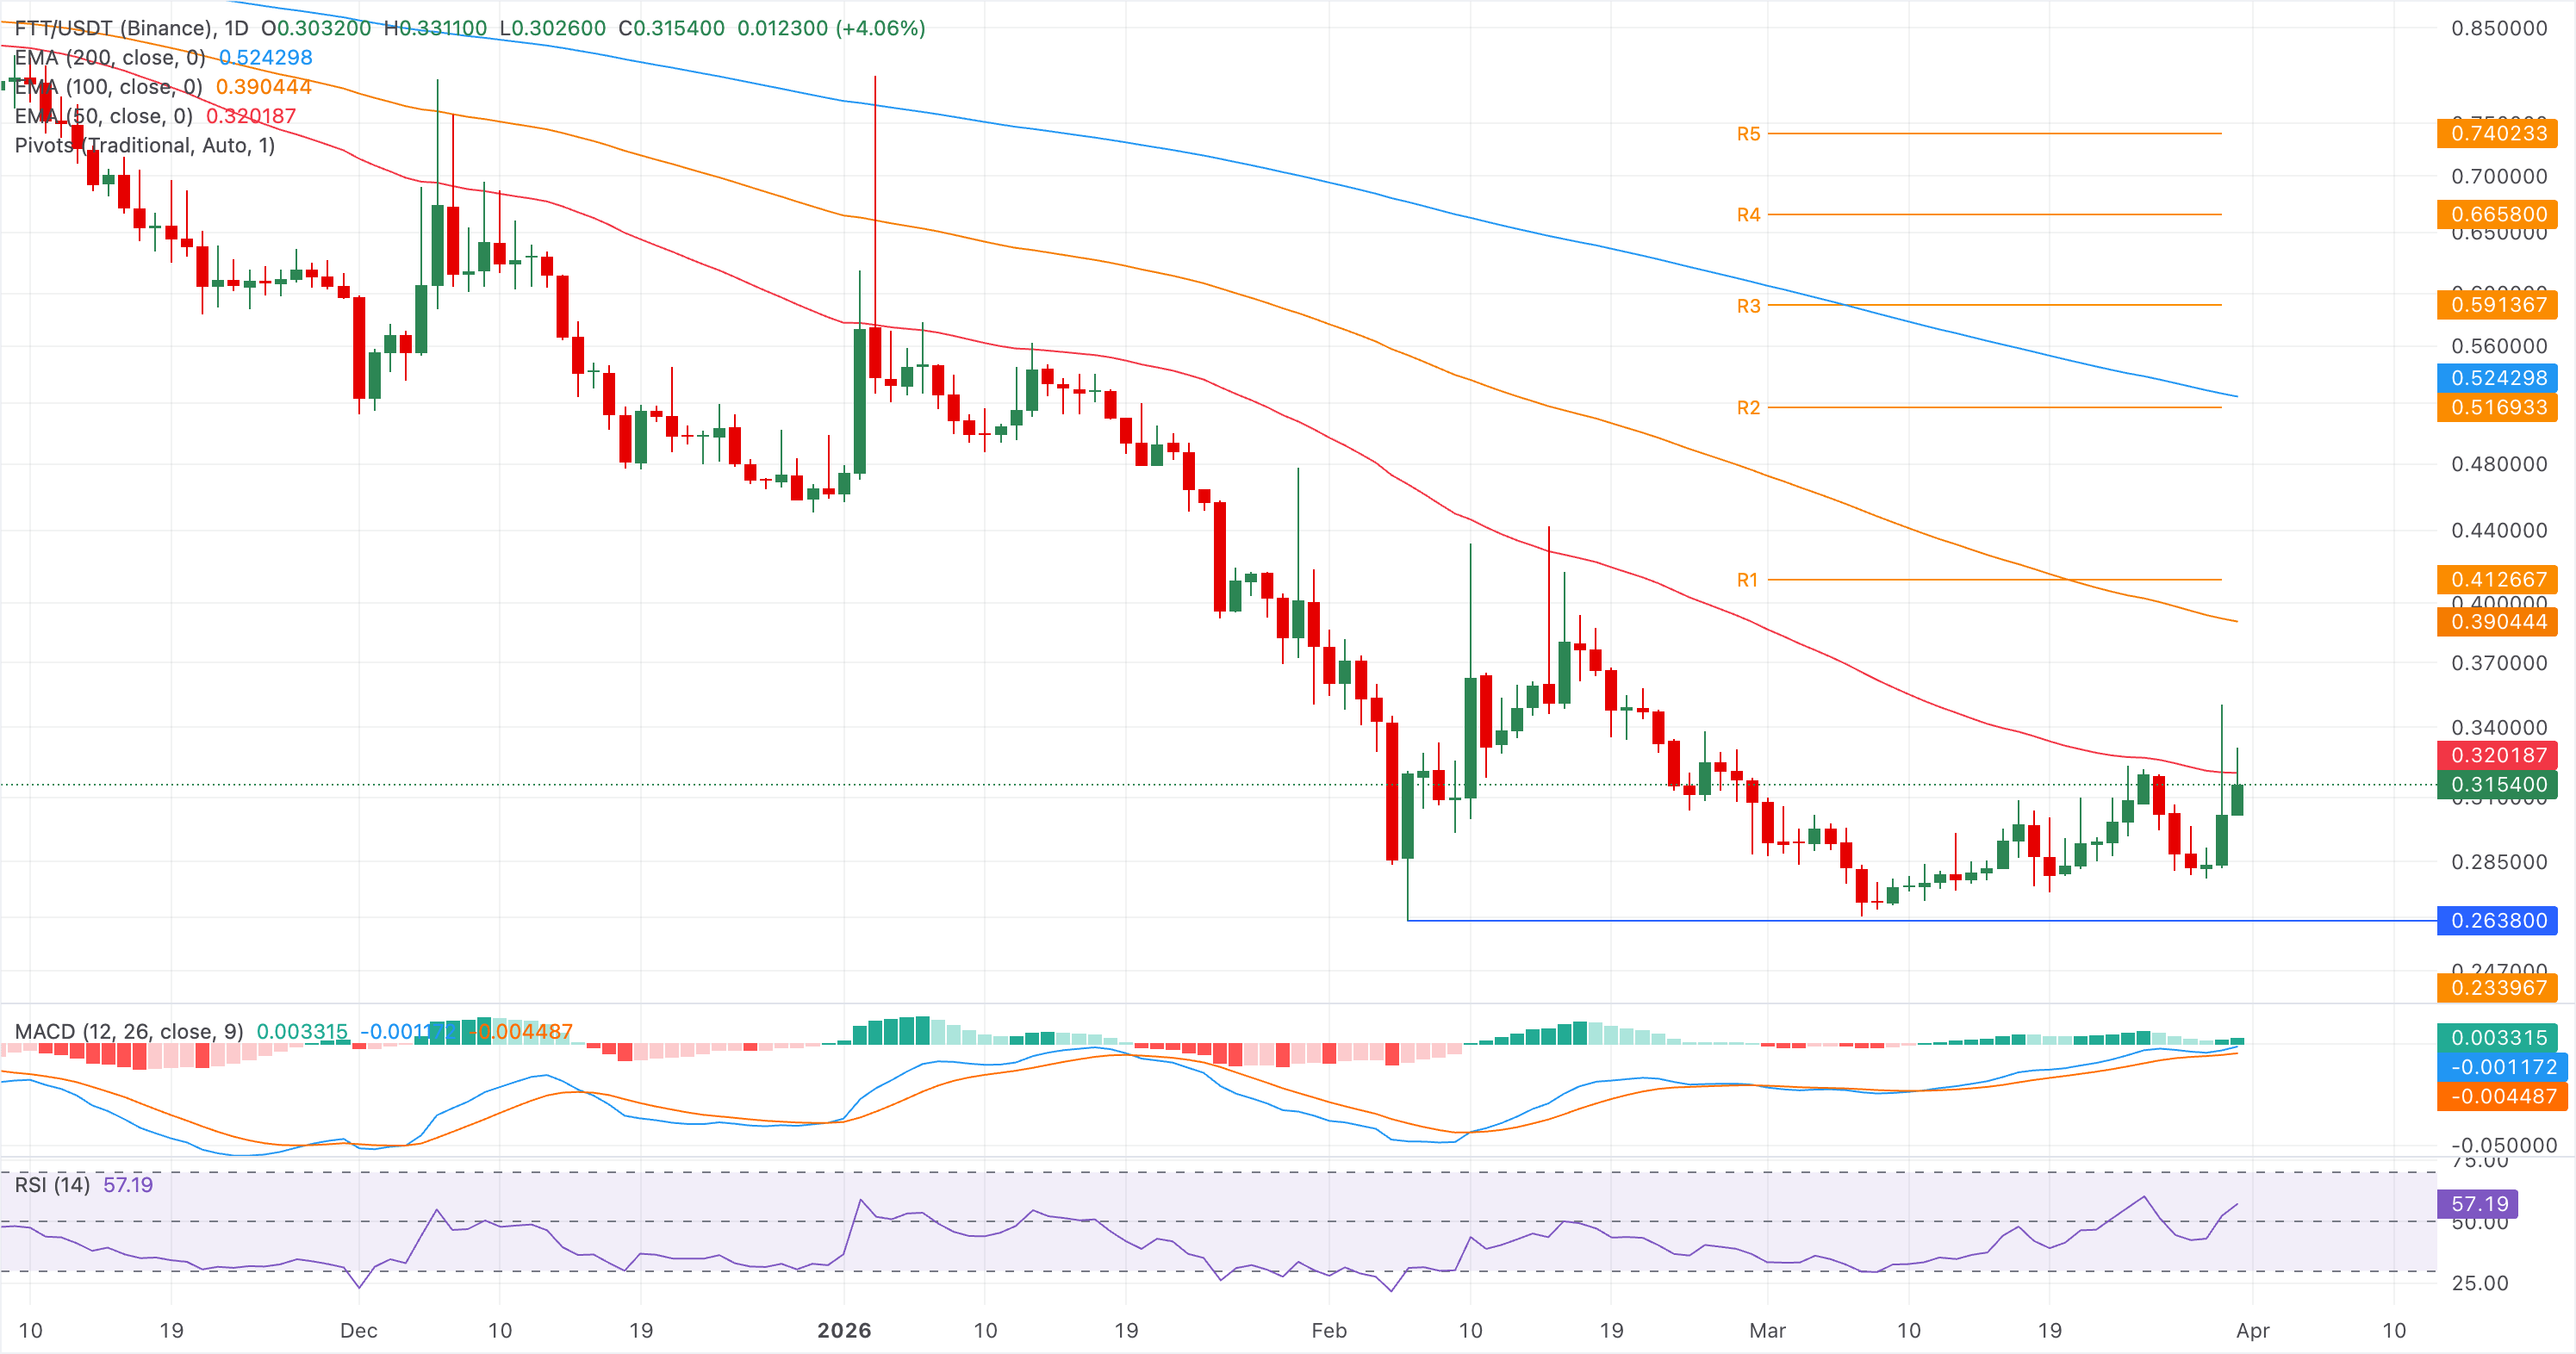
Looking down, the crucial support aligns with the February 6 low at $0.2638.
(The technical analysis of this story was written with the help of an AI tool.)

Hơn một triệu người dùng dựa vào FXStreet để có dữ liệu thị trường thời gian thực, công cụ biểu đồ, góc nhìn chuyên gia và tin tức Forex. Lịch kinh tế toàn diện và các hội thảo web giáo dục giúp nhà giao dịch luôn cập nhật và đưa ra quyết định có tính toán. FXStreet có khoảng 60 nhân sự, chia giữa trụ sở Barcelona và nhiều khu vực toàn cầu.
Đọc thêm


