
GBP/USD Price Forecast: Falls toward nine-day EMA support near 1.3650
Bởi Akhtar Faruqui
Ngày xuất bản: 10 Feb 2026 | Ngày chỉnh sửa: 10 Feb 2026


BÀI VIẾT PHỔ BIẾN

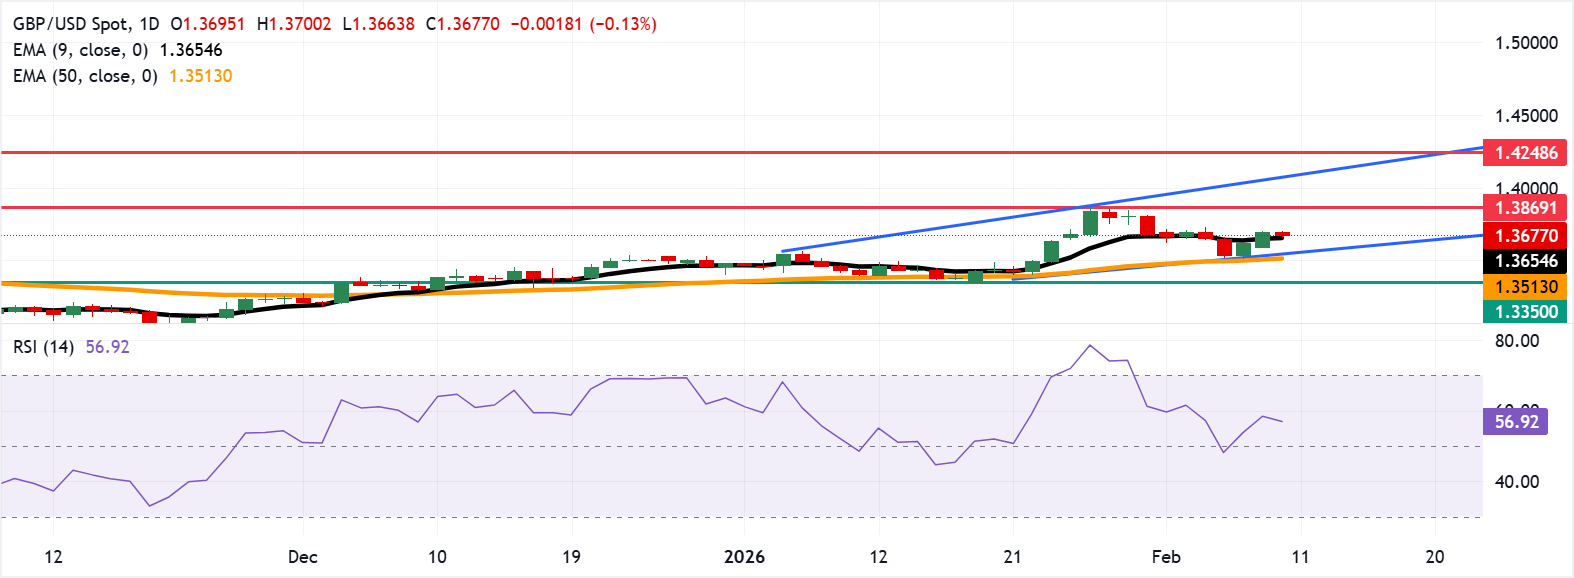
GBP/USD remains subdued after two days of losses, trading around 1.3680 during the European hours on Tuesday. The technical analysis of the daily chart points to a persistent bullish bias, as the pair trades within an ascending channel.
- GBP/USD may target 1.3869, its highest level since September 2021.
- The 14-day Relative Strength Index at 56 remains above the midline after easing from overbought levels.
- The immediate support is seen at the nine-day EMA near 1.3655.
GBP/USD remains subdued after two days of losses, trading around 1.3680 during the European hours on Tuesday. The technical analysis of the daily chart points to a persistent bullish bias, as the pair trades within an ascending channel.
The 14-day Relative Strength Index (RSI), a momentum indicator, is at 56 (neutral) after easing from overbought, keeping momentum above the midline. RSI flattening near 56 signals consolidation risk before trend extension.
The nine-day Exponential Moving Average (EMA) at 1.3652 rises and remains below spot, while the 50-day EMA at 1.3513 extends higher and underpins the broader uptrend. The short-term average holds above the medium-term gauge, preserving a bullish alignment. Trend dynamics remain favorable as both moving averages slope upward, indicating buyers retain control on dips. A daily close below the nine-EMA would warn of fatigue, though the 50-EMA underneath would cushion retracements.
The GBP/USD pair may target the 1.3869, the highest since September 2021, reached on January 27. Further advances would support the pair to test the upper boundary of the ascending channel around 1.4090. A break above the channel could open a fresh leg higher toward 1.4248, the highest since April 2018.
On the downside, the immediate support lies at the nine-day EMA of 1.3655. A break below the short-term average would weaken the momentum and expose the lower boundary of the ascending channel around 1.3570, followed by the 50-day EMA at 1.3513. Further declines would put downward pressure on the GBP/USD pair, testing the support reversal zone around 1.3350.
(The technical analysis of this story was written with the help of an AI tool.)
Pound Sterling Price Today
The table below shows the percentage change of British Pound (GBP) against listed major currencies today. British Pound was the weakest against the Japanese Yen.
| USD | EUR | GBP | JPY | CAD | AUD | NZD | CHF | |
|---|---|---|---|---|---|---|---|---|
| USD | -0.00% | 0.14% | -0.30% | 0.02% | 0.23% | 0.15% | -0.08% | |
| EUR | 0.00% | 0.15% | -0.31% | 0.03% | 0.23% | 0.15% | -0.08% | |
| GBP | -0.14% | -0.15% | -0.47% | -0.12% | 0.08% | -0.00% | -0.23% | |
| JPY | 0.30% | 0.31% | 0.47% | 0.33% | 0.54% | 0.45% | 0.22% | |
| CAD | -0.02% | -0.03% | 0.12% | -0.33% | 0.20% | 0.12% | -0.10% | |
| AUD | -0.23% | -0.23% | -0.08% | -0.54% | -0.20% | -0.08% | -0.31% | |
| NZD | -0.15% | -0.15% | 0.00% | -0.45% | -0.12% | 0.08% | -0.23% | |
| CHF | 0.08% | 0.08% | 0.23% | -0.22% | 0.10% | 0.31% | 0.23% |
The heat map shows percentage changes of major currencies against each other. The base currency is picked from the left column, while the quote currency is picked from the top row. For example, if you pick the British Pound from the left column and move along the horizontal line to the US Dollar, the percentage change displayed in the box will represent GBP (base)/USD (quote).

Hơn một triệu người dùng dựa vào FXStreet để có dữ liệu thị trường thời gian thực, công cụ biểu đồ, góc nhìn chuyên gia và tin tức Forex. Lịch kinh tế toàn diện và các hội thảo web giáo dục giúp nhà giao dịch luôn cập nhật và đưa ra quyết định có tính toán. FXStreet có khoảng 60 nhân sự, chia giữa trụ sở Barcelona và nhiều khu vực toàn cầu.
Đọc thêm


