
GBP/USD Price Forecast: Trades below 1.3800 after pulling back from four-year highs
Bởi Akhtar Faruqui
Ngày xuất bản: 28 Jan 2026 | Ngày chỉnh sửa: 28 Jan 2026


BÀI VIẾT PHỔ BIẾN

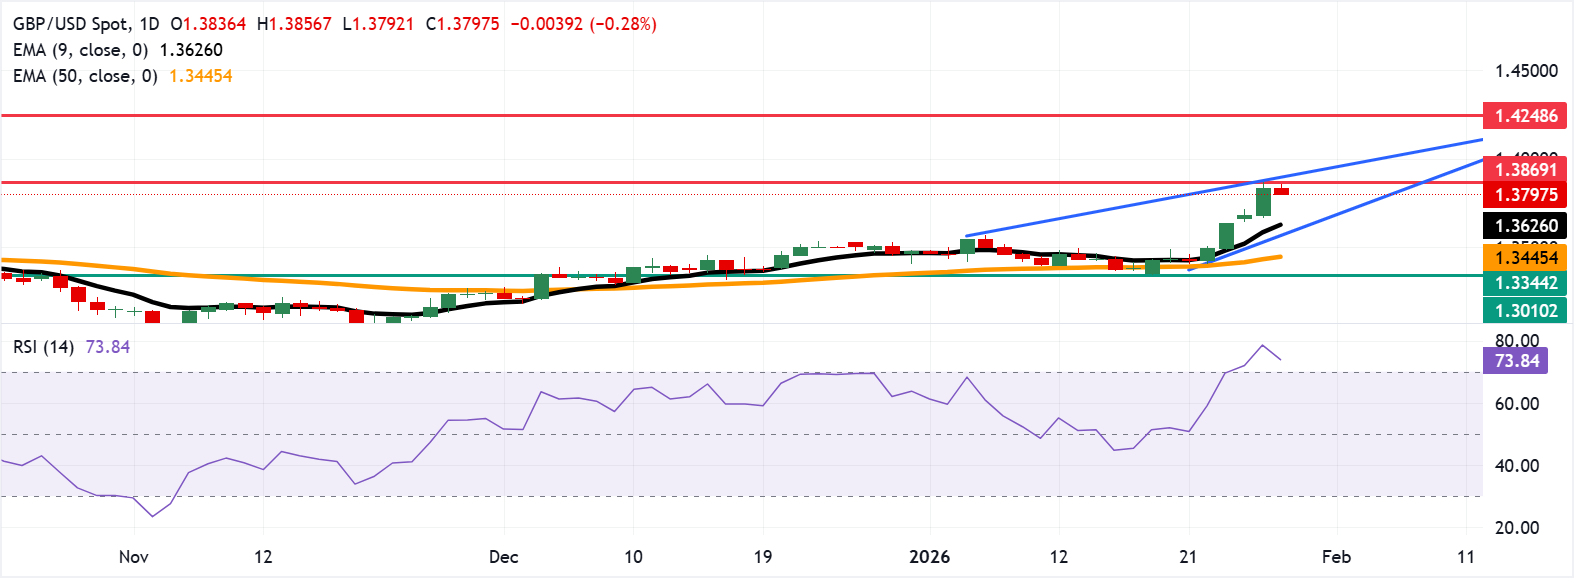
GBP/USD depreciates after four days of gains, trading around 1.3800 during the Asian hours on Friday. The technical analysis of the daily chart suggests a potential bearish reversal amid a narrowing range, suggesting buyers are losing strength within the rising wedge pattern.
- GBP/USD could rebound toward 1.3869, the highest since September 2021.
- Price holds above the nine-day and 50-day EMAs, reinforcing a bullish bias.
- The 14-day Relative Strength Index is at 73.95, which warns that upside momentum may slow.
GBP/USD depreciates after four days of gains, trading around 1.3800 during the Asian hours on Friday. The technical analysis of the daily chart suggests a potential bearish reversal amid a narrowing range, suggesting buyers are losing strength within the rising wedge pattern.
The GBP/USD pair holds above the nine-day Exponential Moving Average (EMA) and the 50-day EMA, reinforcing a bullish bias. The short-term average rises and widens its gap over the medium-term slope, pointing to firm trend strength. Dips could remain contained while price respects the rising short-term average, with the broader trend supported by the medium-term EMA.
The momentum indicator 14-day Relative Strength Index (RSI) is at 73.95 (overbought), which warns of stretched conditions that could slow upside. RSI has eased from 78.53 yet remains elevated, keeping momentum positive albeit vulnerable to consolidation.
Immediate resistance aligns at 1.3869, the highest since September 2021, followed by the upper boundary of the rising wedge around 1.3900. A sustained break could open a fresh leg higher toward 1.4248, the highest since April 2018.
Support is seen at the nine-day EMA of 1.3626, followed by the lower rising wedge boundary around 1.3570. A break below the wedge would cause the emergence of a bearish bias and expose the 50-day EMA support at 1.3445.
(The technical analysis of this story was written with the help of an AI tool.)
Pound Sterling Price Today
The table below shows the percentage change of British Pound (GBP) against listed major currencies today. British Pound was the weakest against the US Dollar.
| USD | EUR | GBP | JPY | CAD | AUD | NZD | CHF | |
|---|---|---|---|---|---|---|---|---|
| USD | 0.27% | 0.29% | 0.18% | 0.10% | 0.21% | 0.42% | 0.40% | |
| EUR | -0.27% | 0.01% | -0.11% | -0.17% | -0.06% | 0.15% | 0.13% | |
| GBP | -0.29% | -0.01% | -0.11% | -0.18% | -0.07% | 0.13% | 0.12% | |
| JPY | -0.18% | 0.11% | 0.11% | -0.07% | 0.04% | 0.24% | 0.23% | |
| CAD | -0.10% | 0.17% | 0.18% | 0.07% | 0.11% | 0.31% | 0.30% | |
| AUD | -0.21% | 0.06% | 0.07% | -0.04% | -0.11% | 0.21% | 0.18% | |
| NZD | -0.42% | -0.15% | -0.13% | -0.24% | -0.31% | -0.21% | -0.02% | |
| CHF | -0.40% | -0.13% | -0.12% | -0.23% | -0.30% | -0.18% | 0.02% |
The heat map shows percentage changes of major currencies against each other. The base currency is picked from the left column, while the quote currency is picked from the top row. For example, if you pick the British Pound from the left column and move along the horizontal line to the US Dollar, the percentage change displayed in the box will represent GBP (base)/USD (quote).

Hơn một triệu người dùng dựa vào FXStreet để có dữ liệu thị trường thời gian thực, công cụ biểu đồ, góc nhìn chuyên gia và tin tức Forex. Lịch kinh tế toàn diện và các hội thảo web giáo dục giúp nhà giao dịch luôn cập nhật và đưa ra quyết định có tính toán. FXStreet có khoảng 60 nhân sự, chia giữa trụ sở Barcelona và nhiều khu vực toàn cầu.
Đọc thêm


