

Jupiter Price Forecast: JUP extends gains as derivatives sentiment improves
- Jupiter extends its gains on Wednesday after finding support around the key zones earlier this week.
- Derivatives metrics support a bullish case with increasing open interest and positive funding rates.
- The technical outlook favors further gains if the $0.200 level holds.
Jupiter (JUP) extends its recovery, trading above $0.210 on Wednesday after finding support near $0.200 earlier this week. The rebound is backed by improving derivatives metrics, with open interest (OI) climbing and funding rates remaining positive, indicating that traders are increasingly positioning for further upside. Meanwhile, the technical outlook remains constructive, supporting further gains if JUP holds above $0.200.

Derivatives metrics support a bullish bias
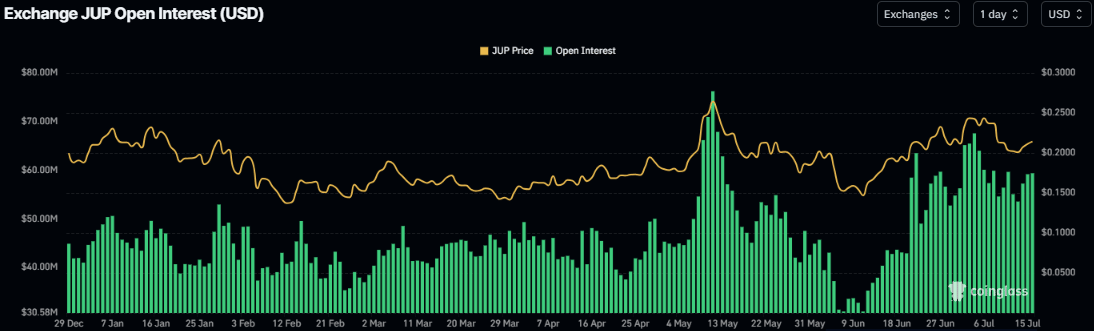
Derivatives metrics show a positive bias for Jupiter. JUP’s futures OI surges to $59.36 million on Wednesday, having risen steadily since mid-June and now remaining in a broader upward trend, supporting a bullish outlook.
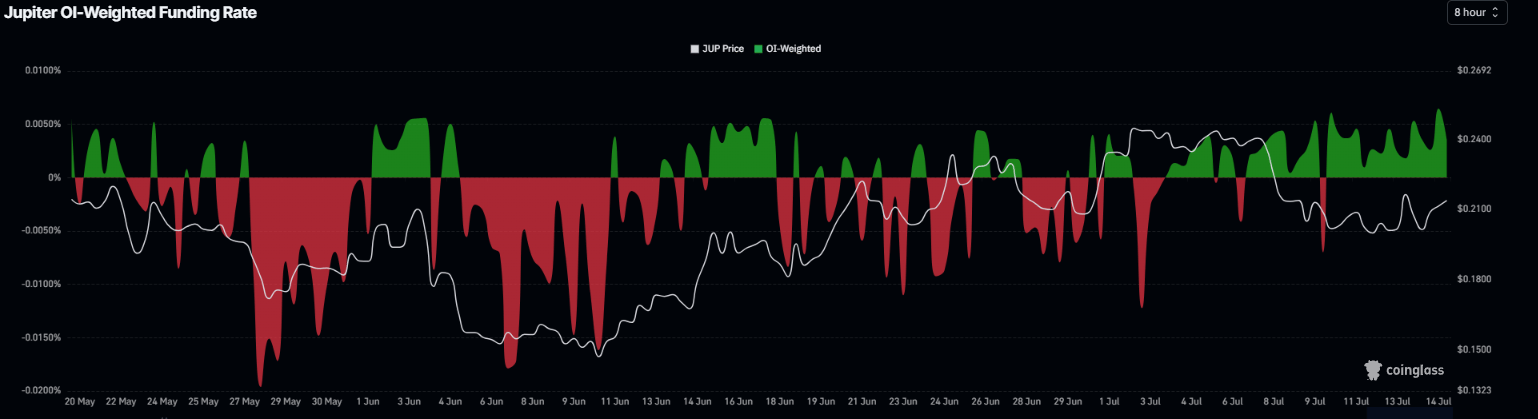
In addition, JUP funding rates flipped positive on July 10 and have remained in positive territory, reading 0.0036% on Wednesday, indicating that longs are paying shorts and supporting bearish sentiment.
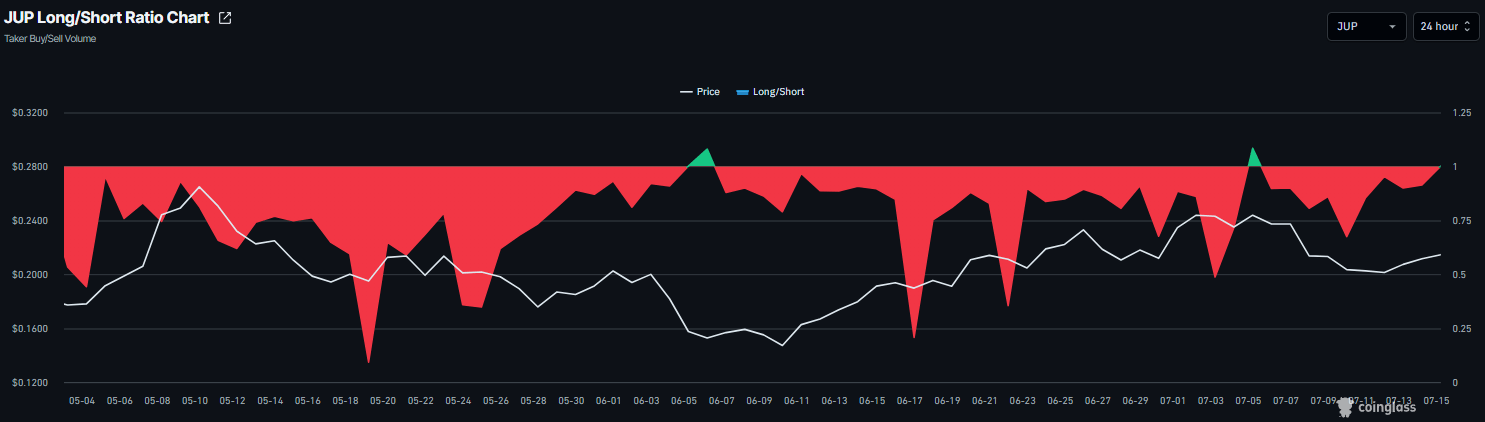
Moreover, the long-to-short ratio moves toward positive territory, with a reading of 1.01 on Wednesday, further supports a bullish bias.
Jupiter Price Forecast: Key support holds strong
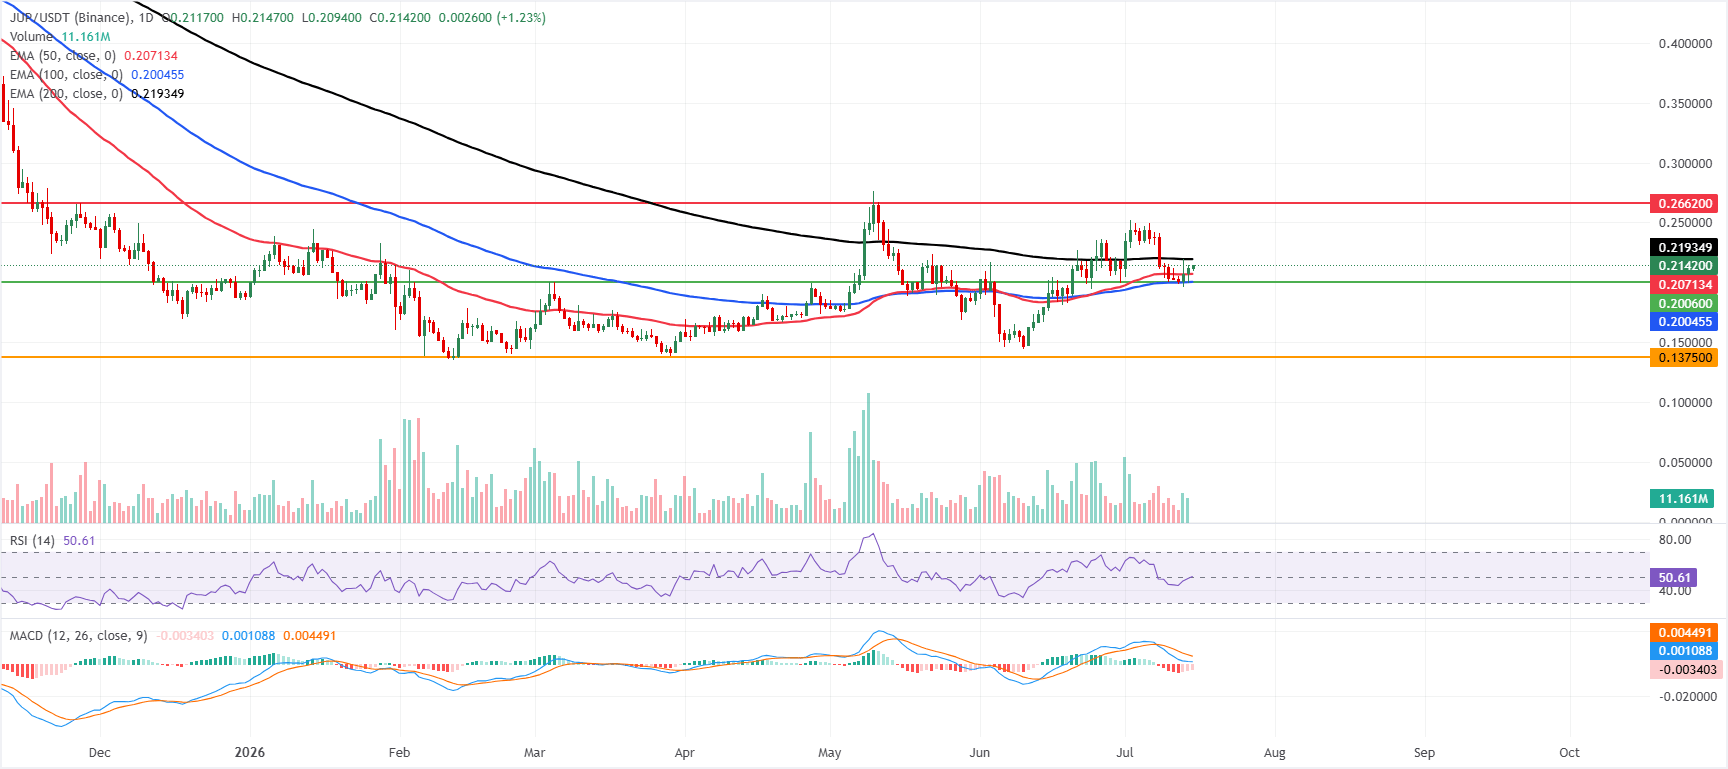
Jupiter price trades at $0.210 on Wednesday, extending its recovery for the third consecutive day so far this week. JUP sits between its major Exponential Moving Averages (EMAs), holding above the 50-day EMA at $0.207 and the 100-day EMA at $0.200 while remaining capped by the 200-day EMA at $0.219, which keeps the near-term tone neutral rather than clearly bullish.
The Relative Strength Index (RSI) around 50 hints at balanced momentum, while the Moving Average Convergence Divergence (MACD) indicator stays slightly negative, suggesting that upside attempts lack strong follow-through for now.
On the downside, immediate demand is seen at the horizontal support near $0.200, reinforced by the nearby 50-day and 100-day EMAs clustered just below current levels, ahead of a more distant structural floor at $0.137.
On the topside, initial resistance is defined by the 200-day EMA at $0.219, and a sustained break above this level could pave the way toward the next notable cap at $0.266.
(The technical analysis of this story was written with the help of an AI tool. Know more.)














