
Meme Coins Price Prediction: DOGE, SHIB, and PEPE extend losses as bearish momentum intensifies
Bởi Manish Chhetri
Ngày xuất bản: 21 Nov 2025 | Ngày chỉnh sửa: 21 Nov 2025


BÀI VIẾT PHỔ BIẾN
Meme coins continue to face selling pressure at the time of writing on Friday, with Dogecoin (DOGE), Shiba Inu (SHIB) and Pepe (PEPE) extending correction nearly 8% so far this week.
- Dogecoin trades in the red on Friday, down nearly 8% so far this week amid building selling pressure.
- Shiba Inu slips below $0.0000081, signaling a potential deeper correction.
- Pepe hovers near its lower trendline boundary, and a daily close below this level could trigger further downside.
Meme coins continue to face selling pressure at the time of writing on Friday, with Dogecoin (DOGE), Shiba Inu (SHIB) and Pepe (PEPE) extending correction nearly 8% so far this week. The momentum indicators for these three meme coins are flashing weakness, suggesting a deeper correction on the horizon.
Dogecoin closes below key support zone
Dogecoin price faced rejection at the weekly resistance level at $0.181 on November 11 and declined by more than 17% over the next 10 days, closing below the daily support at $0.149. At the time of writing on Friday, DOGE is trading down around $0.146.
If DOGE continues its correction, it could extend the decline toward the April 7 low of $0.129.
The Relative Strength Index (RSI) on the daily chart reads 34, below its neutral level of 50, indicating bearish momentum gaining traction. Moreover, the Moving Average Convergence Divergence (MACD) showed a bearish crossover last week, which remains intact, suggesting the continuation of a downward trend.
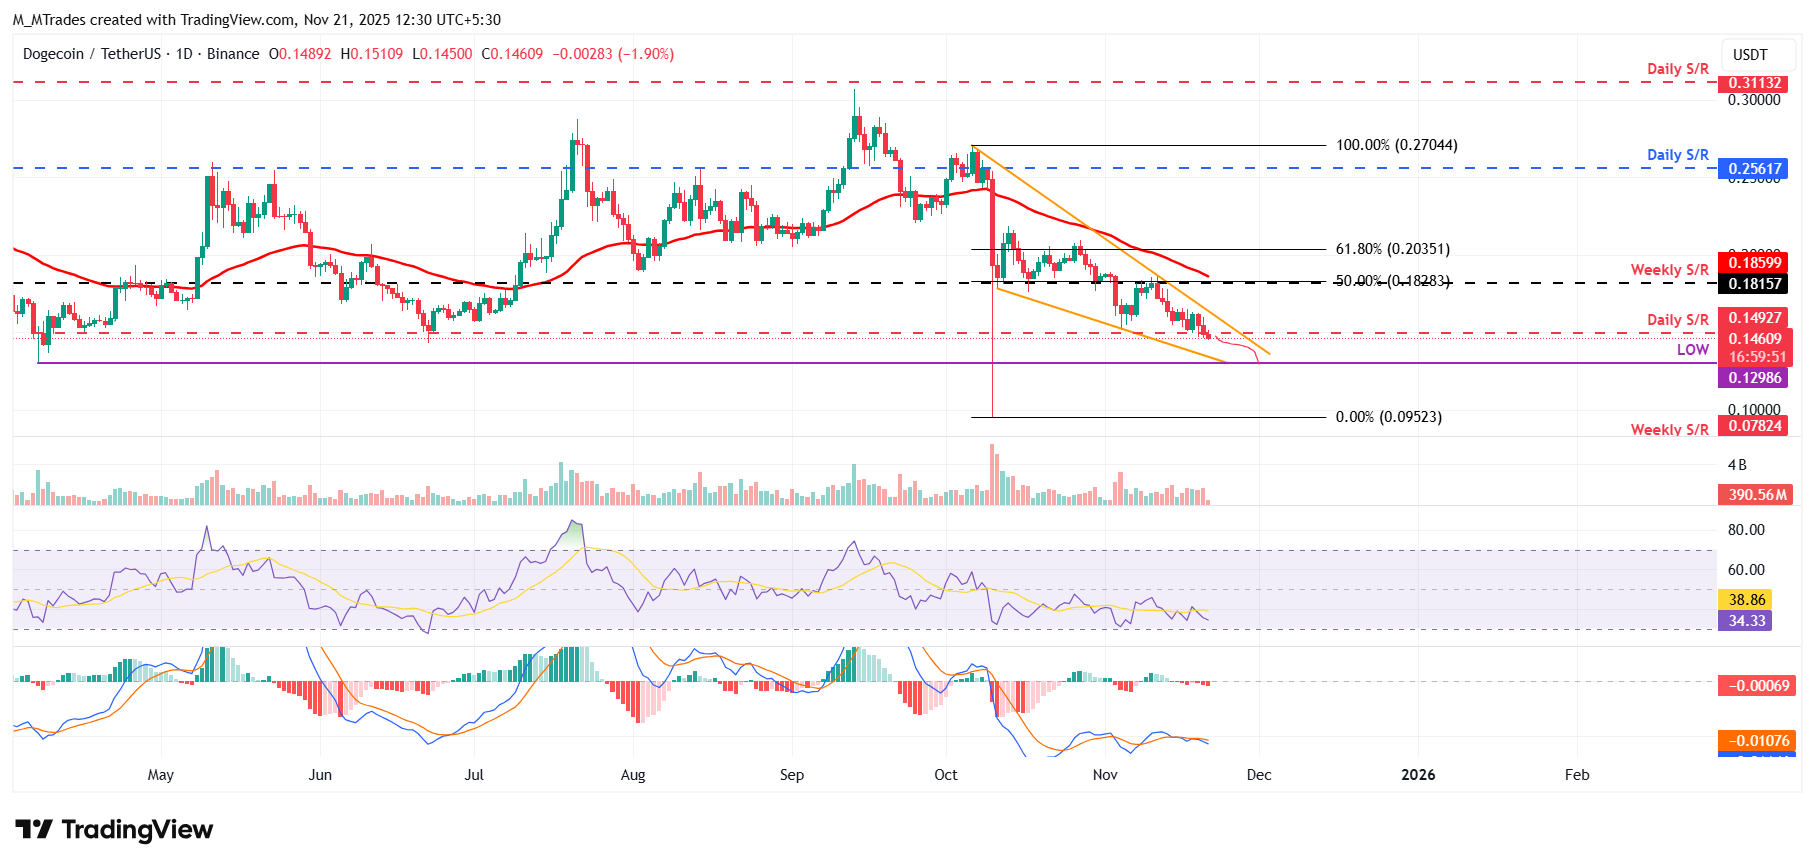
On the other hand, if DOGE recovers, it could extend the recovery toward the weekly resistance at $0.181.
Shiba Inu price shows bearish signs in momentum indicators
Shiba Inu price faced rejection around the 50% price retracement level at $0.0000099 on November 13 and declined by nearly 13% until Thursday. At the time of writing on Friday, SHIB trades down around $0.0000081.
If SHIB continues its downward trend, it could extend the decline toward the November 21, 2023, low of $0.0000076.
Like Dogecoin, SHIB’s RSI and MACD indicators also support the continuation of the bearish view.

On the other hand, if SHIB rallies, it could extend gains toward the key resistance at $0.0000099.
Pepe could extend a deeper correction if it closes below the lower trendline support
Pepe price faced rejection at the upper trendline boundary on November 11 and declined by more than 31% over the next 10 days. At the time of writing on Friday, PEPE continues to trade down near the lower trendline boundary.
If PEPE closes below the lower trendline boundary around $0.0000041 on a daily basis, it could extend the decline toward the October 10 low of $0.0000027.
Like Dogecoin and Shiba Inu, Pepe’s RSI and MACD indicators also support the bearish view.
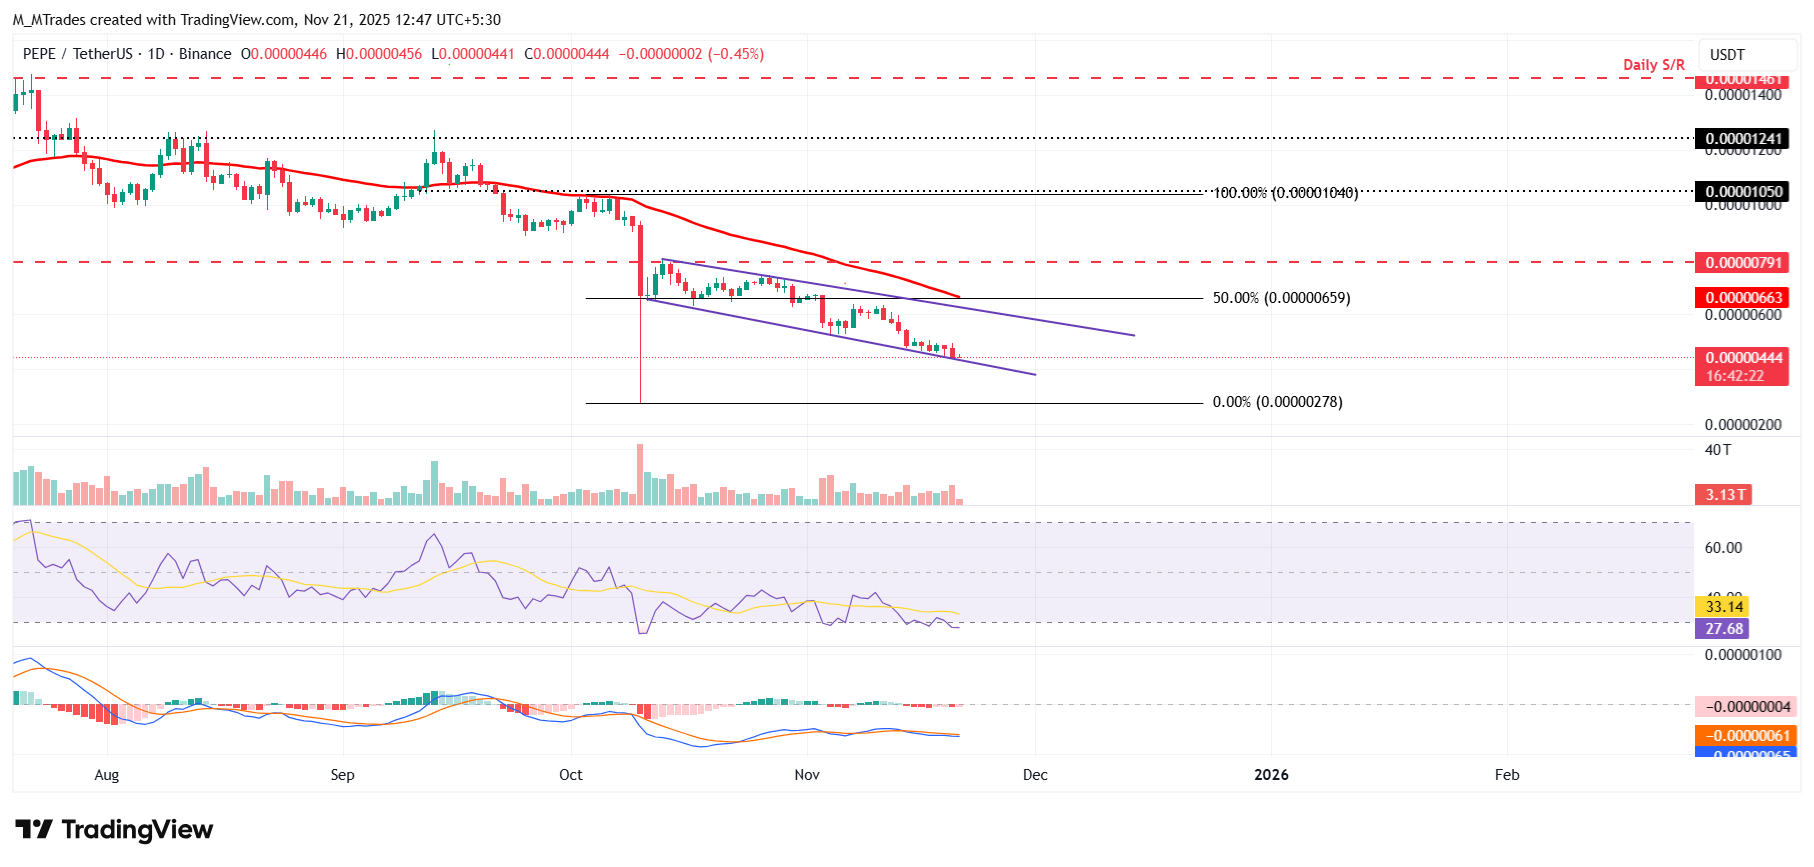
On the other hand, if PEPE recovers, it could extend the rally toward the next resistance at $0.0000065.

Hơn một triệu người dùng dựa vào FXStreet để có dữ liệu thị trường thời gian thực, công cụ biểu đồ, góc nhìn chuyên gia và tin tức Forex. Lịch kinh tế toàn diện và các hội thảo web giáo dục giúp nhà giao dịch luôn cập nhật và đưa ra quyết định có tính toán. FXStreet có khoảng 60 nhân sự, chia giữa trụ sở Barcelona và nhiều khu vực toàn cầu.
Đọc thêm


