
Meme Coins Price Prediction: DOGE surges, Shiba Inu, Pepe await breakout signals
Bởi Manish Chhetri
Đã cập nhật: 30 Apr 2026


BÀI VIẾT PHỔ BIẾN

Dogecoin (DOGE) extends its upward momentum on Thursday, trading above $0.106 and leading gains among major meme coins. Meanwhile, Shiba Inu (SHIB) and Pepe (PEPE) remain range-bound, signaling a pause in momentum as both meme coins consolidate near key resistance levels.
- Dogecoin is trading above $0.106 on Thursday, up 6.5% so far this week.
- Shiba Inu is near the upper boundary of its consolidation at $0.0000063, a breakout suggests a rally ahead.
- Pepe price hovers between the 50-day and 100-day EMAs, signaling indecision among traders.
Dogecoin (DOGE) extends its upward momentum on Thursday, trading above $0.106 and leading gains among major meme coins. Meanwhile, Shiba Inu (SHIB) and Pepe (PEPE) remain range-bound, signaling a pause in momentum as both meme coins consolidate near key resistance levels. A firm close above these key resistance zones could trigger the next leg of upside for these meme coins.
Dogecoin takes the lead
Dogecoin's price is extending its gains, trading above $0.106 on Wednesday and surpassing the key 100-day Exponential Moving Average (EMA) at $0.104.
If DOGE continues its upward momentum and closes above 38.20% Fibonacci retracement level at $0.109 on a daily basis, it could extend the gains toward the weekly resistance at $0.119.
The Relative Strength Index (RSI) on the daily chart is 71, above the overbought threshold and pointing upward, indicating strong bullish momentum. Moreover, the Moving Average Convergence Divergence (MACD) indicator on the same chart shows rising green histogram bars, supporting the positive outlook.
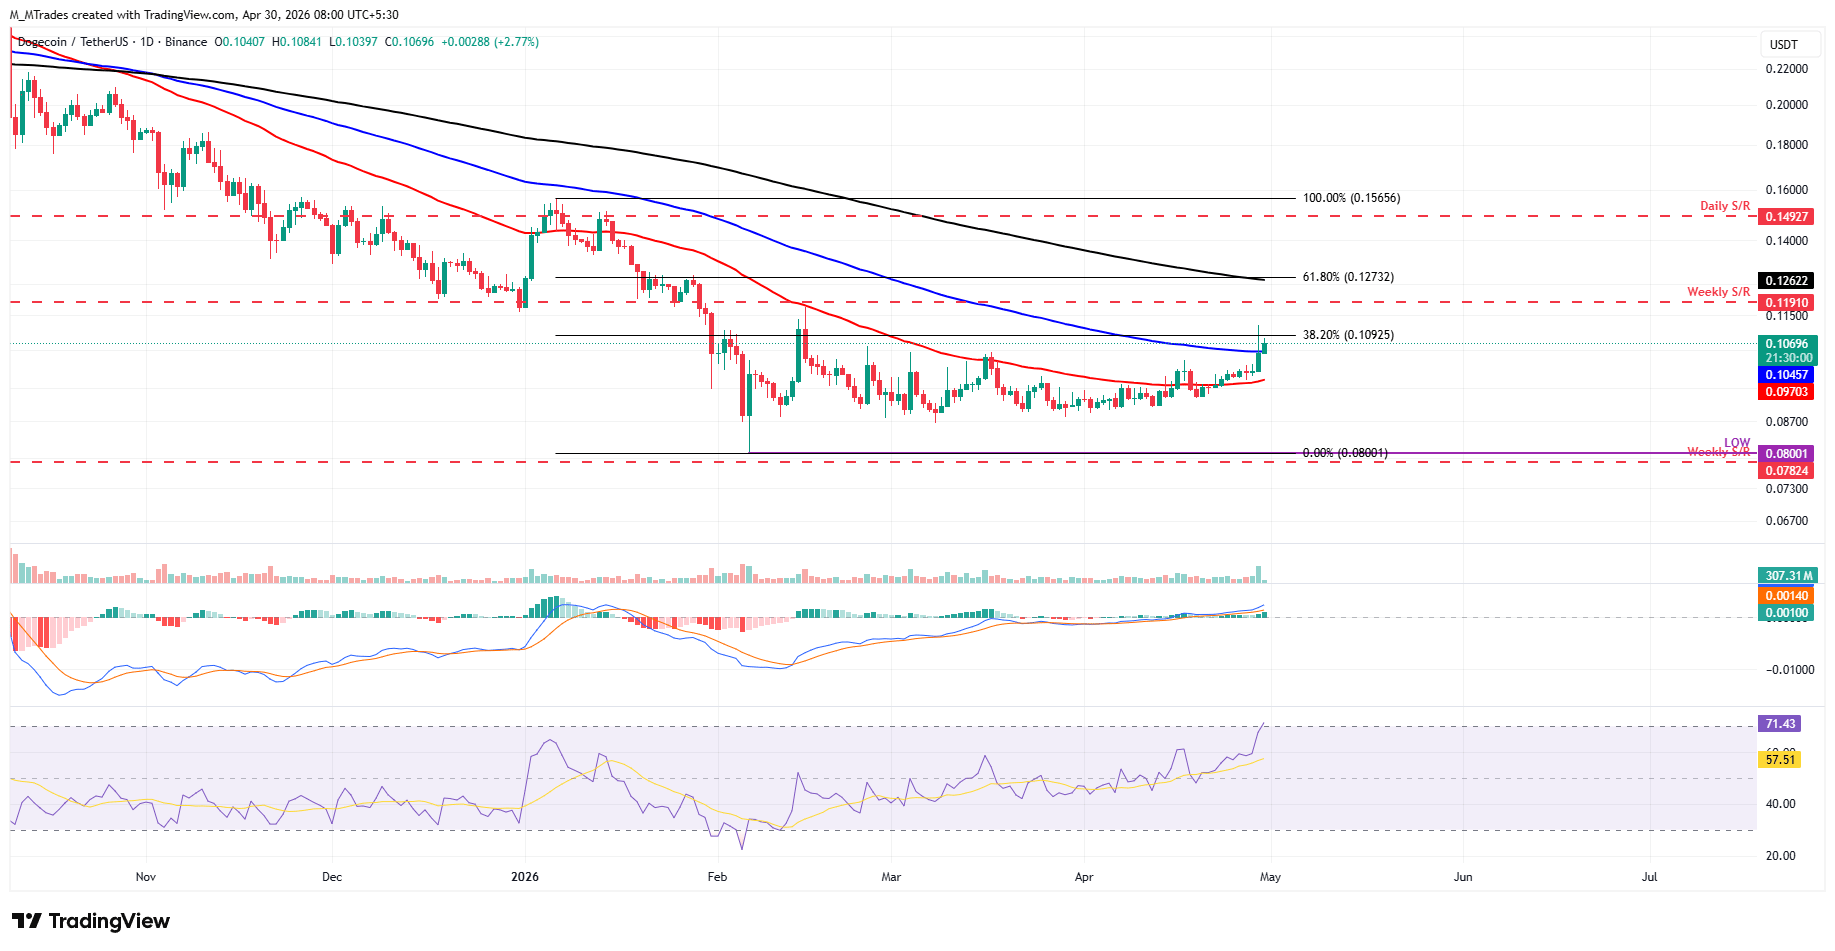
However, if DOGE faces a correction, it could extend the decline toward the 50-day EMA at $0.097.
Shiba Inu could extend gains if it closes above the upper consolidation boundary
Shiba Inu price surged sharply on Wednesday but was rejected from the 100-day EMA at $0.0000064, closing the day with mild gains. As of writing on Thursday, SHIB is approaching the upper consolidation boundary at $0.0000064, where a break above suggests a bullish move.
If SHIB closes above this upper boundary on a daily basis, it could extend the rally toward the 100-day EMA at $0.0000064. A firm close above this level could extend gains toward the weekly resistance at $0.0000068.
The RSI on the daily chart reads 56, above the neutral level of 50 and below the overbought threshold, indicating bullish momentum. Moreover, the MACD indicator on the same chart shows green histogram bars, supporting the positive outlook.
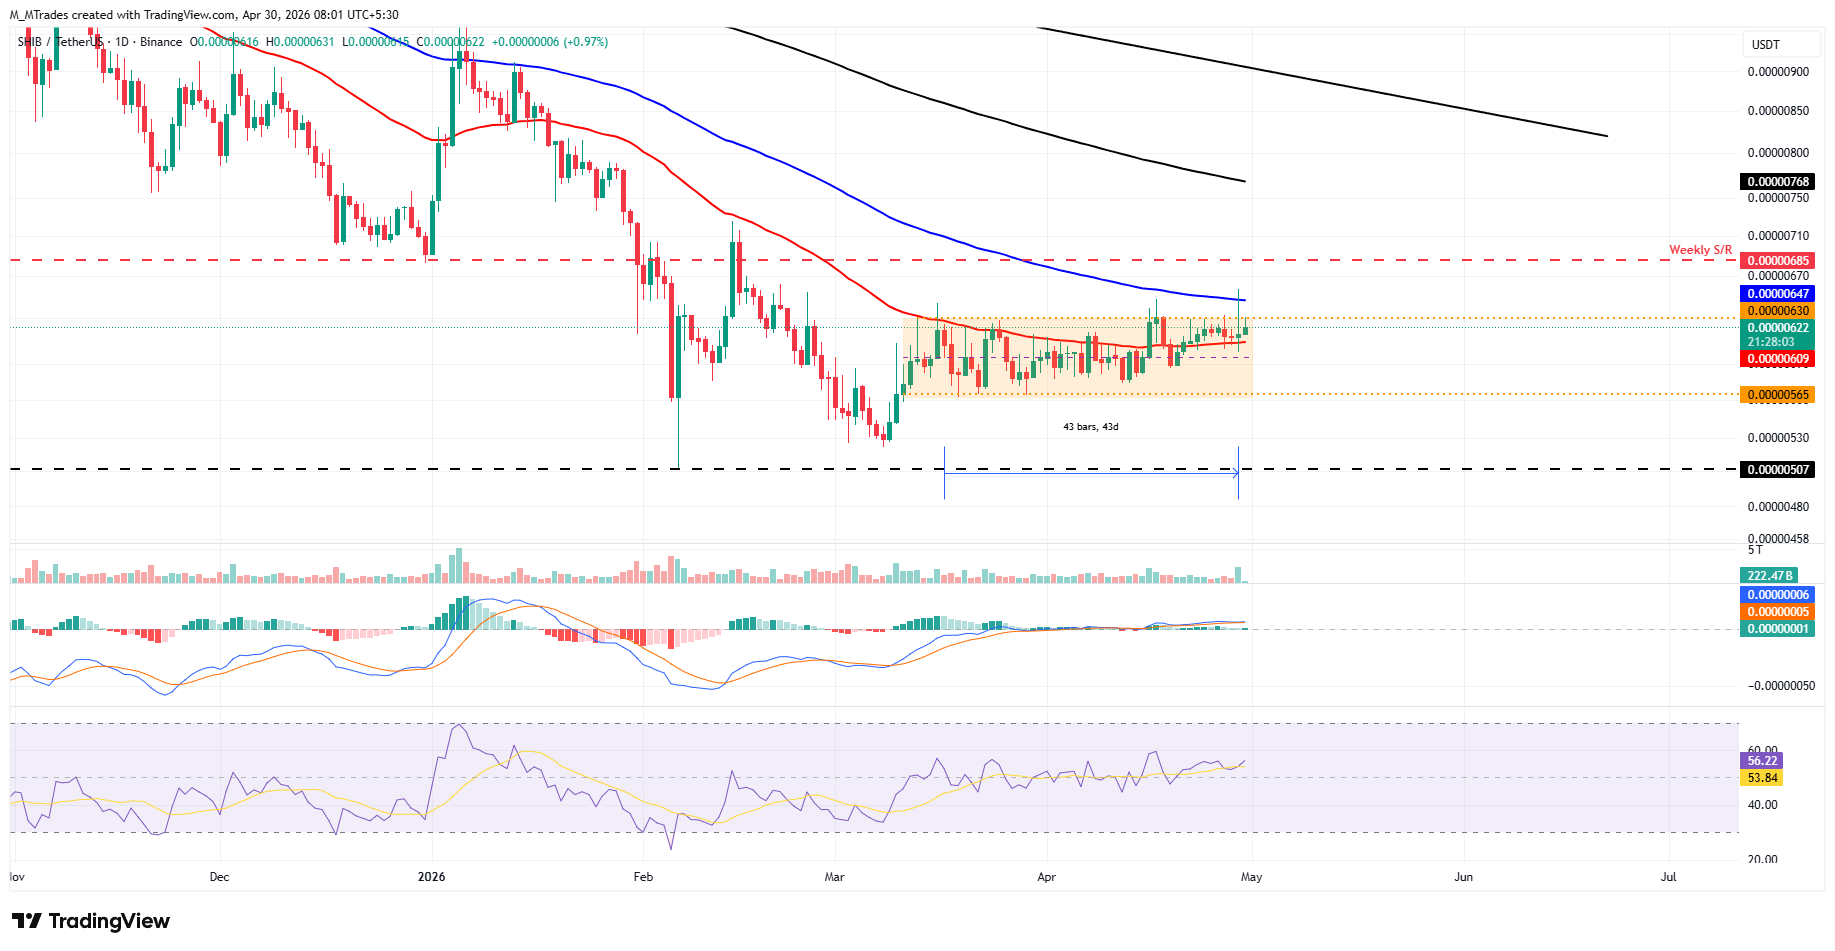
If SHIB faces rejection and corrects, it could extend the decline toward the lower channel range at $0.0000056.
Pepe trades sideways between 50-day and 100-day EMAs
Pepe price has been trading between the 50-day and 100-day EMAs at $0.0000037 and $0.0000040 since last week. As of writing on Thursday, PEPE is hovering at $0.0000038.
If PEPE closes above the 100-day EMA at $0.0000040 on a daily basis, it could extend the rally toward the 200-day EMA at $0.0000050, which roughly coincides with the daily resistance.
The RSI on the daily chart is 54, above the neutral 50 level, indicating mild bullish strength. Moreover, the MACD indicator is converging, indicating indecision among the traders.
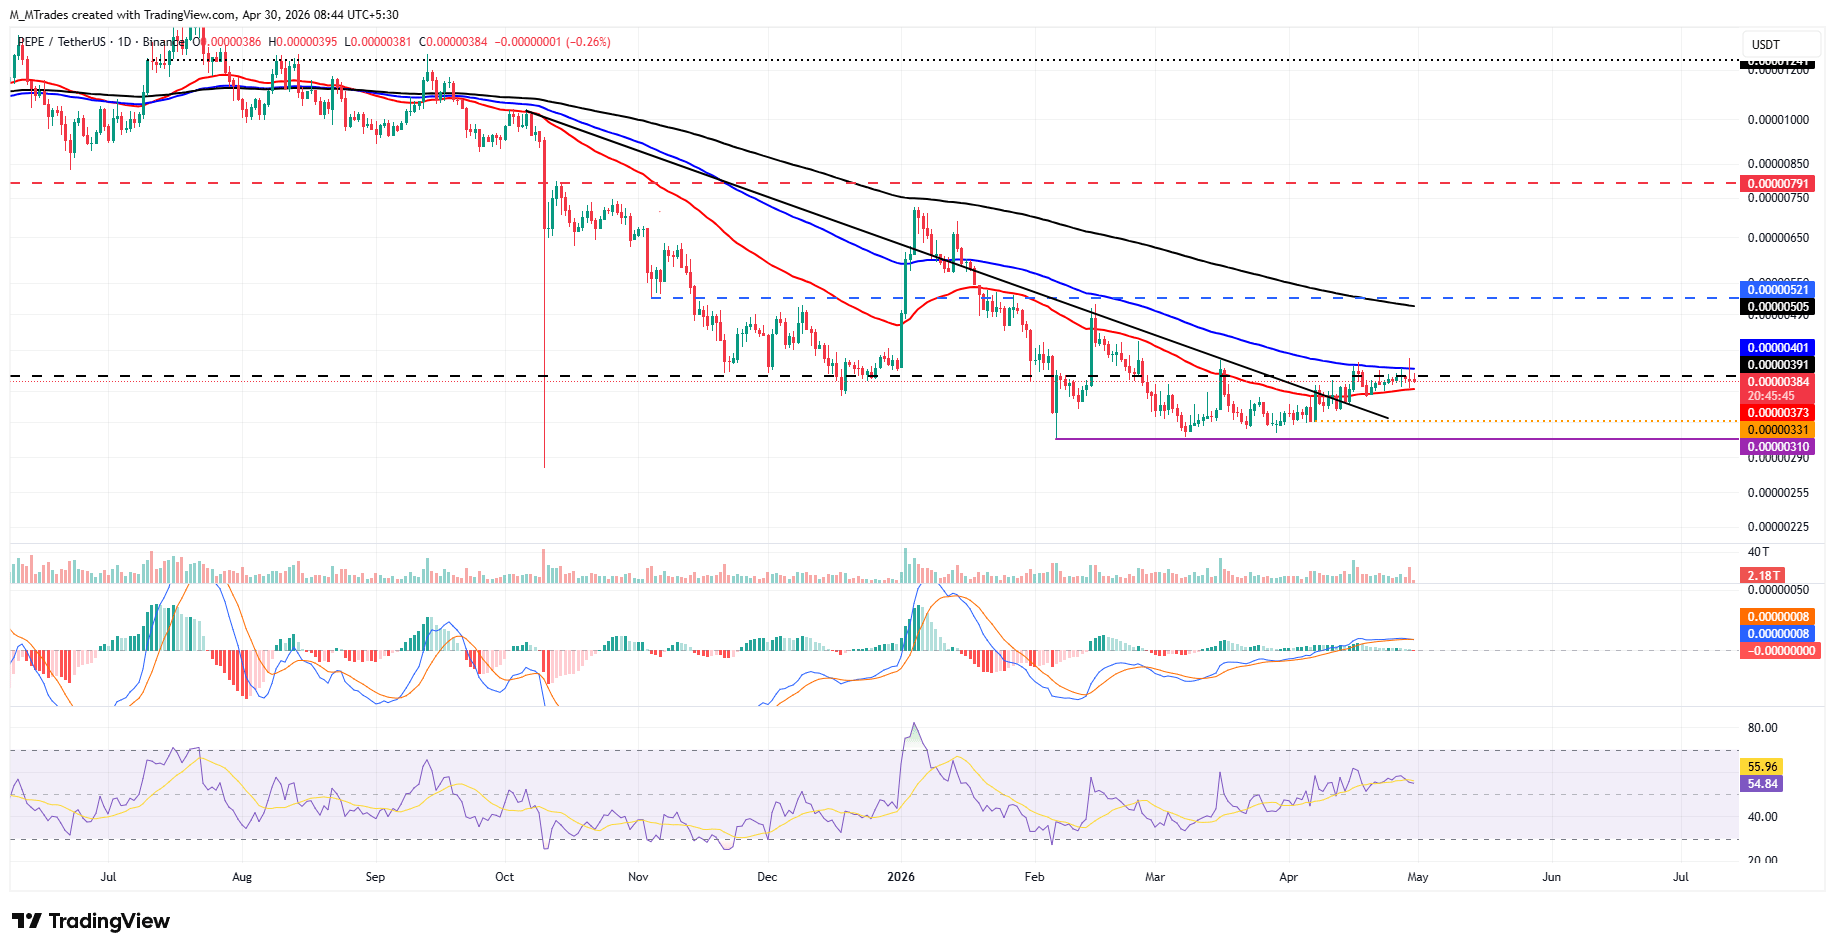
On the other hand, if PEPE pulls back and closes below the 50-day EMA at $0.0000037, it could extend the decline toward the April 7 low at $0.0000033.

Hơn một triệu người dùng dựa vào FXStreet để có dữ liệu thị trường thời gian thực, công cụ biểu đồ, góc nhìn chuyên gia và tin tức Forex. Lịch kinh tế toàn diện và các hội thảo web giáo dục giúp nhà giao dịch luôn cập nhật và đưa ra quyết định có tính toán. FXStreet có khoảng 60 nhân sự, chia giữa trụ sở Barcelona và nhiều khu vực toàn cầu.
Đọc thêm


