
NZD/USD Price Forecast: Hovers around 0.5850, 50-day EMA due to bullish reversal
Bởi Akhtar Faruqui
Đã cập nhật: 8 Apr 2026


BÀI VIẾT PHỔ BIẾN

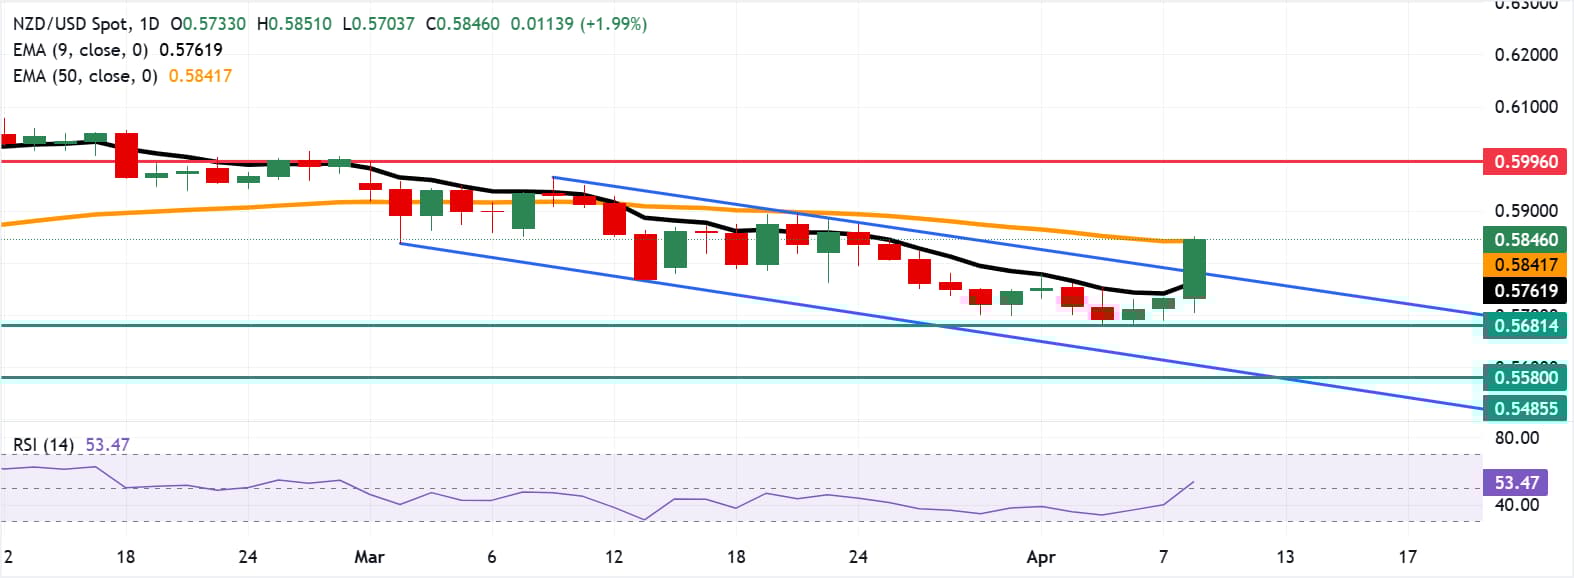
NZD/USD gains ground for the third consecutive day, trading around 0.5850 during the early European hours on Wednesday. The technical analysis of the daily chart signals a bullish reversal as the pair rises above the descending channel pattern.
- NZD/USD may explore the area around the March high of 0.5996.
- The 14-day Relative Strength Index rises above 50, confirming strengthening upside momentum.
- The pair is testing the immediate support at the 50-day EMA of 0.5841.
NZD/USD gains ground for the third consecutive day, trading around 0.5850 during the early European hours on Wednesday. The technical analysis of the daily chart signals a bullish reversal as the pair rises above the descending channel pattern.
The near-term bias turns cautiously bullish as the NZD/USD pair rebounds from recent lows and reclaims the nine-day Exponential Moving Average (EMA), while the 50-day EMA flattens just below spot and starts acting as a nearby dynamic floor.
The 14-day Relative Strength Index (RSI) has bounced back above the 50 line, confirming improving upside momentum after a prolonged period of subdued strength and suggesting that dips are now attracting buyers rather than extending the prior downtrend.
A successful break above the confluence around the upper boundary of the descending channel has shifted the bias toward the upside and potentially opened the door for the NZD/USD pair to explore the region around the March high of 0.5996, recorded on March 2.
The immediate support lies at the 50-day EMA of 0.5841. Further declines would push the NZD/USD pair toward the descending channel and to test the nine-day EMA support at 0.5761, followed by the five-month low of 0.5681, recorded on April 6. A break below the latter would expose the lower boundary of the descending channel around 0.5610, with additional support at 0.5580, the lowest since April 9, 2025, which was last seen in November 2025.
(The technical analysis of this story was written with the help of an AI tool.)
New Zealand Dollar Price Today
The table below shows the percentage change of New Zealand Dollar (NZD) against listed major currencies today. New Zealand Dollar was the strongest against the US Dollar.
| USD | EUR | GBP | JPY | CAD | AUD | NZD | CHF | |
|---|---|---|---|---|---|---|---|---|
| USD | -0.85% | -0.98% | -0.89% | -0.29% | -1.40% | -1.86% | -1.21% | |
| EUR | 0.85% | -0.15% | -0.04% | 0.56% | -0.55% | -1.05% | -0.38% | |
| GBP | 0.98% | 0.15% | 0.11% | 0.71% | -0.39% | -0.84% | -0.23% | |
| JPY | 0.89% | 0.04% | -0.11% | 0.60% | -0.49% | -0.97% | -0.32% | |
| CAD | 0.29% | -0.56% | -0.71% | -0.60% | -1.08% | -1.55% | -0.92% | |
| AUD | 1.40% | 0.55% | 0.39% | 0.49% | 1.08% | -0.49% | 0.14% | |
| NZD | 1.86% | 1.05% | 0.84% | 0.97% | 1.55% | 0.49% | 0.65% | |
| CHF | 1.21% | 0.38% | 0.23% | 0.32% | 0.92% | -0.14% | -0.65% |
The heat map shows percentage changes of major currencies against each other. The base currency is picked from the left column, while the quote currency is picked from the top row. For example, if you pick the New Zealand Dollar from the left column and move along the horizontal line to the US Dollar, the percentage change displayed in the box will represent NZD (base)/USD (quote).

Hơn một triệu người dùng dựa vào FXStreet để có dữ liệu thị trường thời gian thực, công cụ biểu đồ, góc nhìn chuyên gia và tin tức Forex. Lịch kinh tế toàn diện và các hội thảo web giáo dục giúp nhà giao dịch luôn cập nhật và đưa ra quyết định có tính toán. FXStreet có khoảng 60 nhân sự, chia giữa trụ sở Barcelona và nhiều khu vực toàn cầu.
Đọc thêm


