
Pi Network Price Forecast: Bearish streak nears critical support trendline
Bởi Vishal Dixit
Ngày xuất bản: 5 Dec 2025 | Ngày chỉnh sửa: 5 Dec 2025


BÀI VIẾT PHỔ BIẾN

Pi Network (PI) edges lower on Friday for the third consecutive day, approaching a local support trendline. The on-chain data suggests an increase in supply pressure as Centralized Exchanges (CEXs) experience a surge in inflows.
- Pi Network edges lower on Friday, marking the third straight bearish candle and approaching a crucial support trendline.
- On-chain data shows an increase in CEXs' reserves, risking additional selling pressure.
- The technical outlook indicates short-term risk, as the MACD indicator is flashing a sell signal.
Pi Network (PI) edges lower on Friday for the third consecutive day, approaching a local support trendline. The on-chain data suggests an increase in supply pressure as Centralized Exchanges (CEXs) experience a surge in inflows. Technically, the pullback in PI risks further losses, as the Moving Average Convergence Divergence (MACD) indicator is flashing a sell signal.
CEXs signal an increase in selling pressure
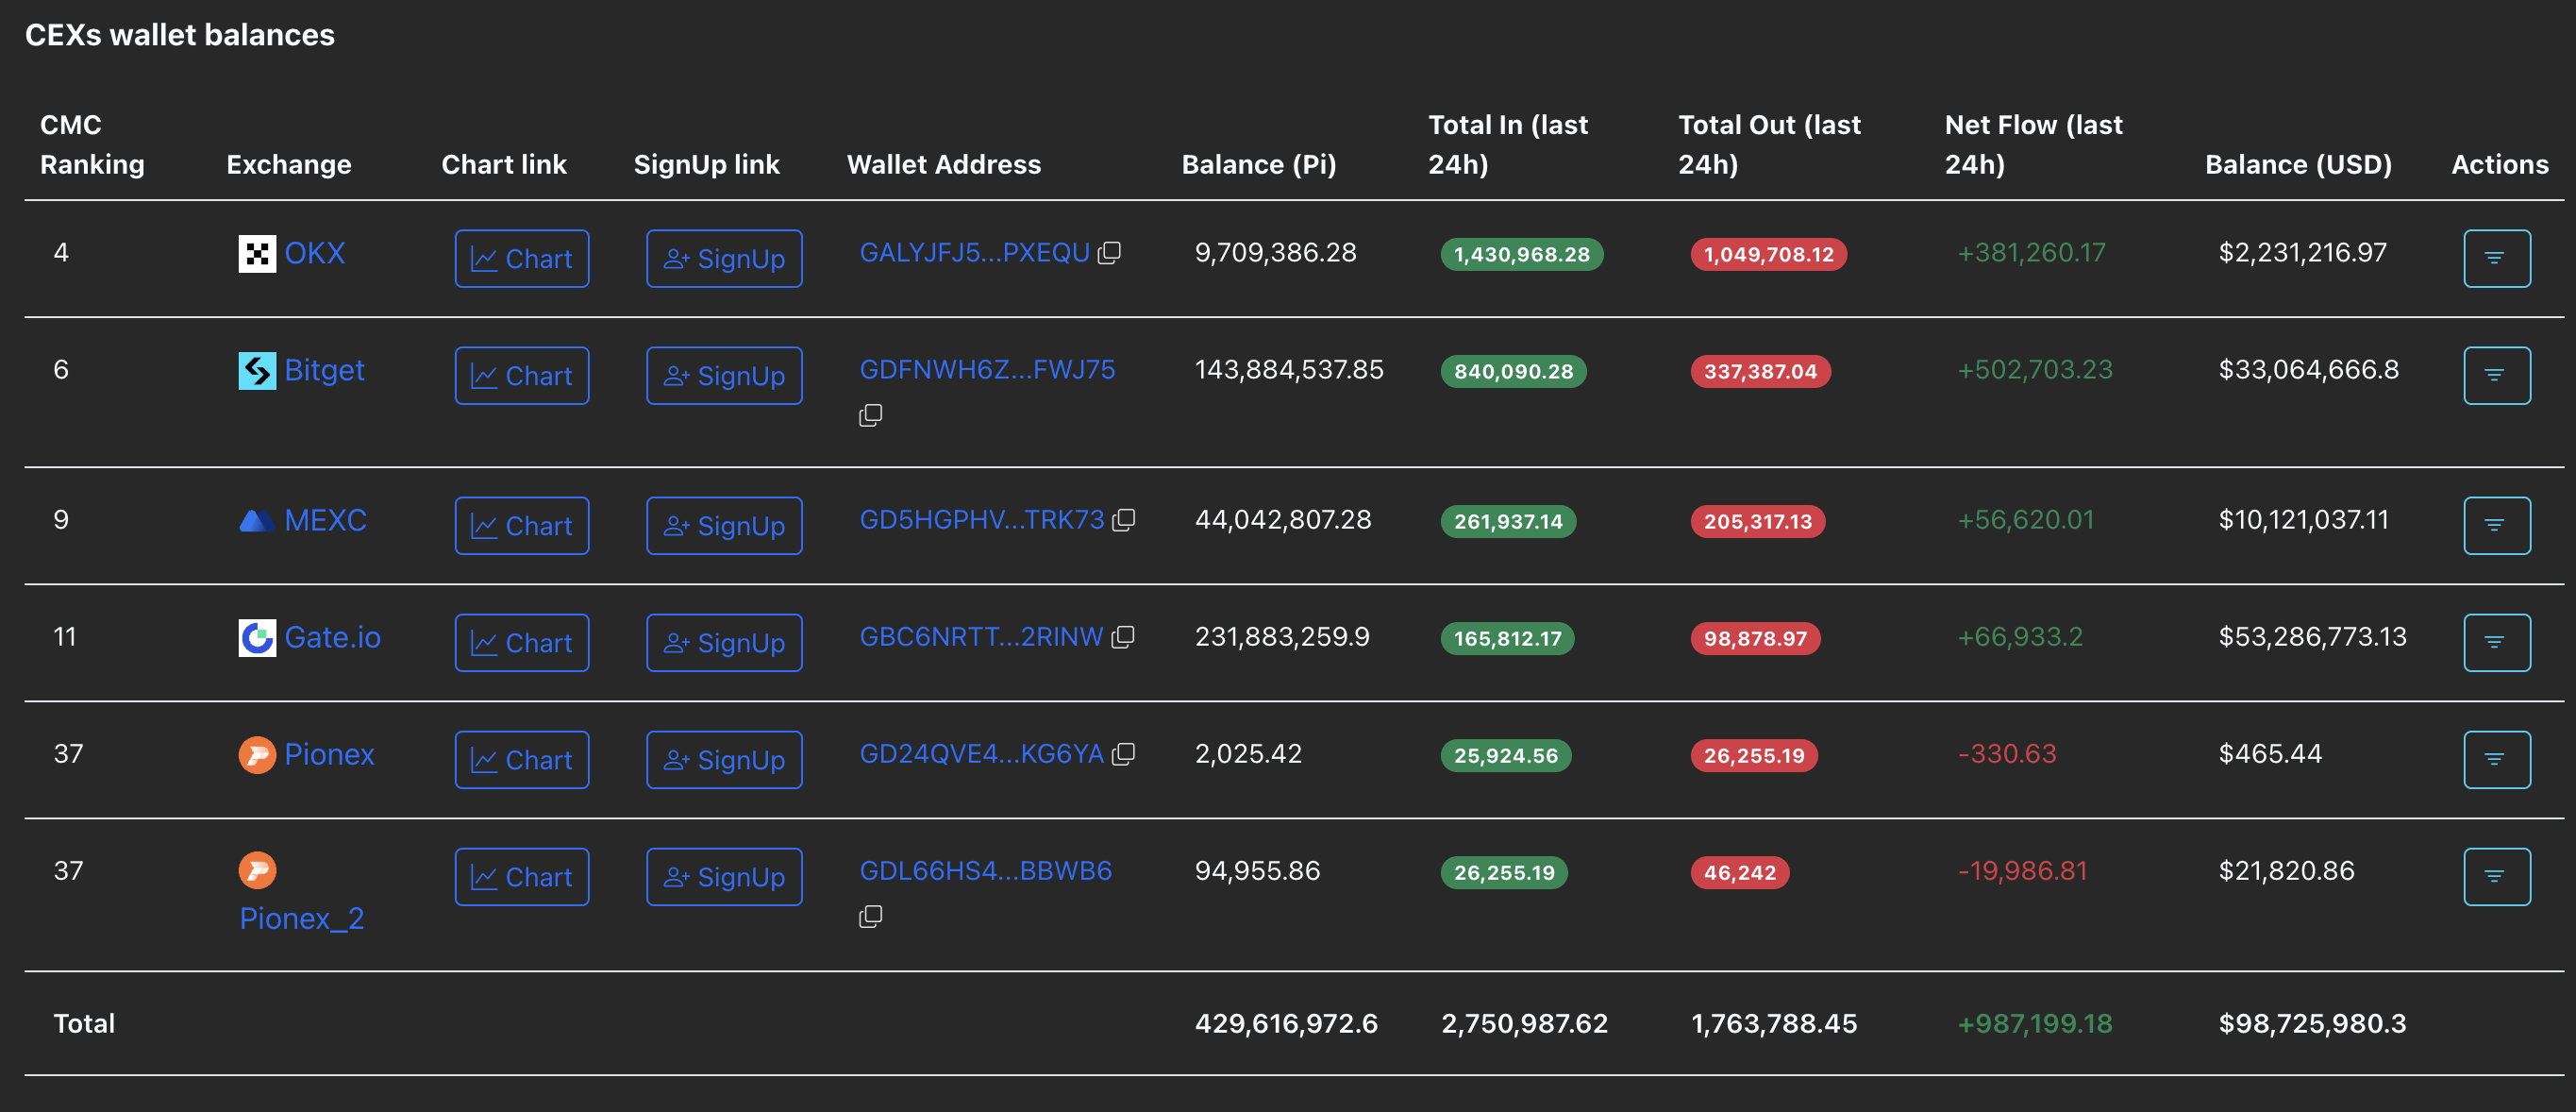
PiScan data shows that user deposits over Pi Network’s Know Your Business (KYB)-verified CEXs totaled 2.75 million PI tokens in the last 24 hours, outpacing the withdrawals of 1.76 million tokens. This indicates a daily net inflow of CEXs, reflecting a persistent risk-averse sentiment among investors.
Technical outlook: Will Pi Network break below its local support trendline?
Pi Network retraces toward a local support trendline formed by connecting the lows of October 22 and November 4, which has provided multiple rebounds since inception. If PI breaks below this trendline near the December 1 low at $0.2204, it could extend the decline to the $0.2000 psychological mark, followed by the $0.1919 support, aligning with the October 11 low.
The MACD indicator on the daily chart displays a steady decline in the average lines, inching closer to the zero line. If the falling red and blue lines cross into the negative territory, PI could experience increased bearish momentum.
Although the MACD signals a sell, the Relative Strength Index (RSI) is at 46 on the same chart, extending a lateral trend near the centre line. However, the room on the downside between RSI and the oversold zone warns of bearish potential.
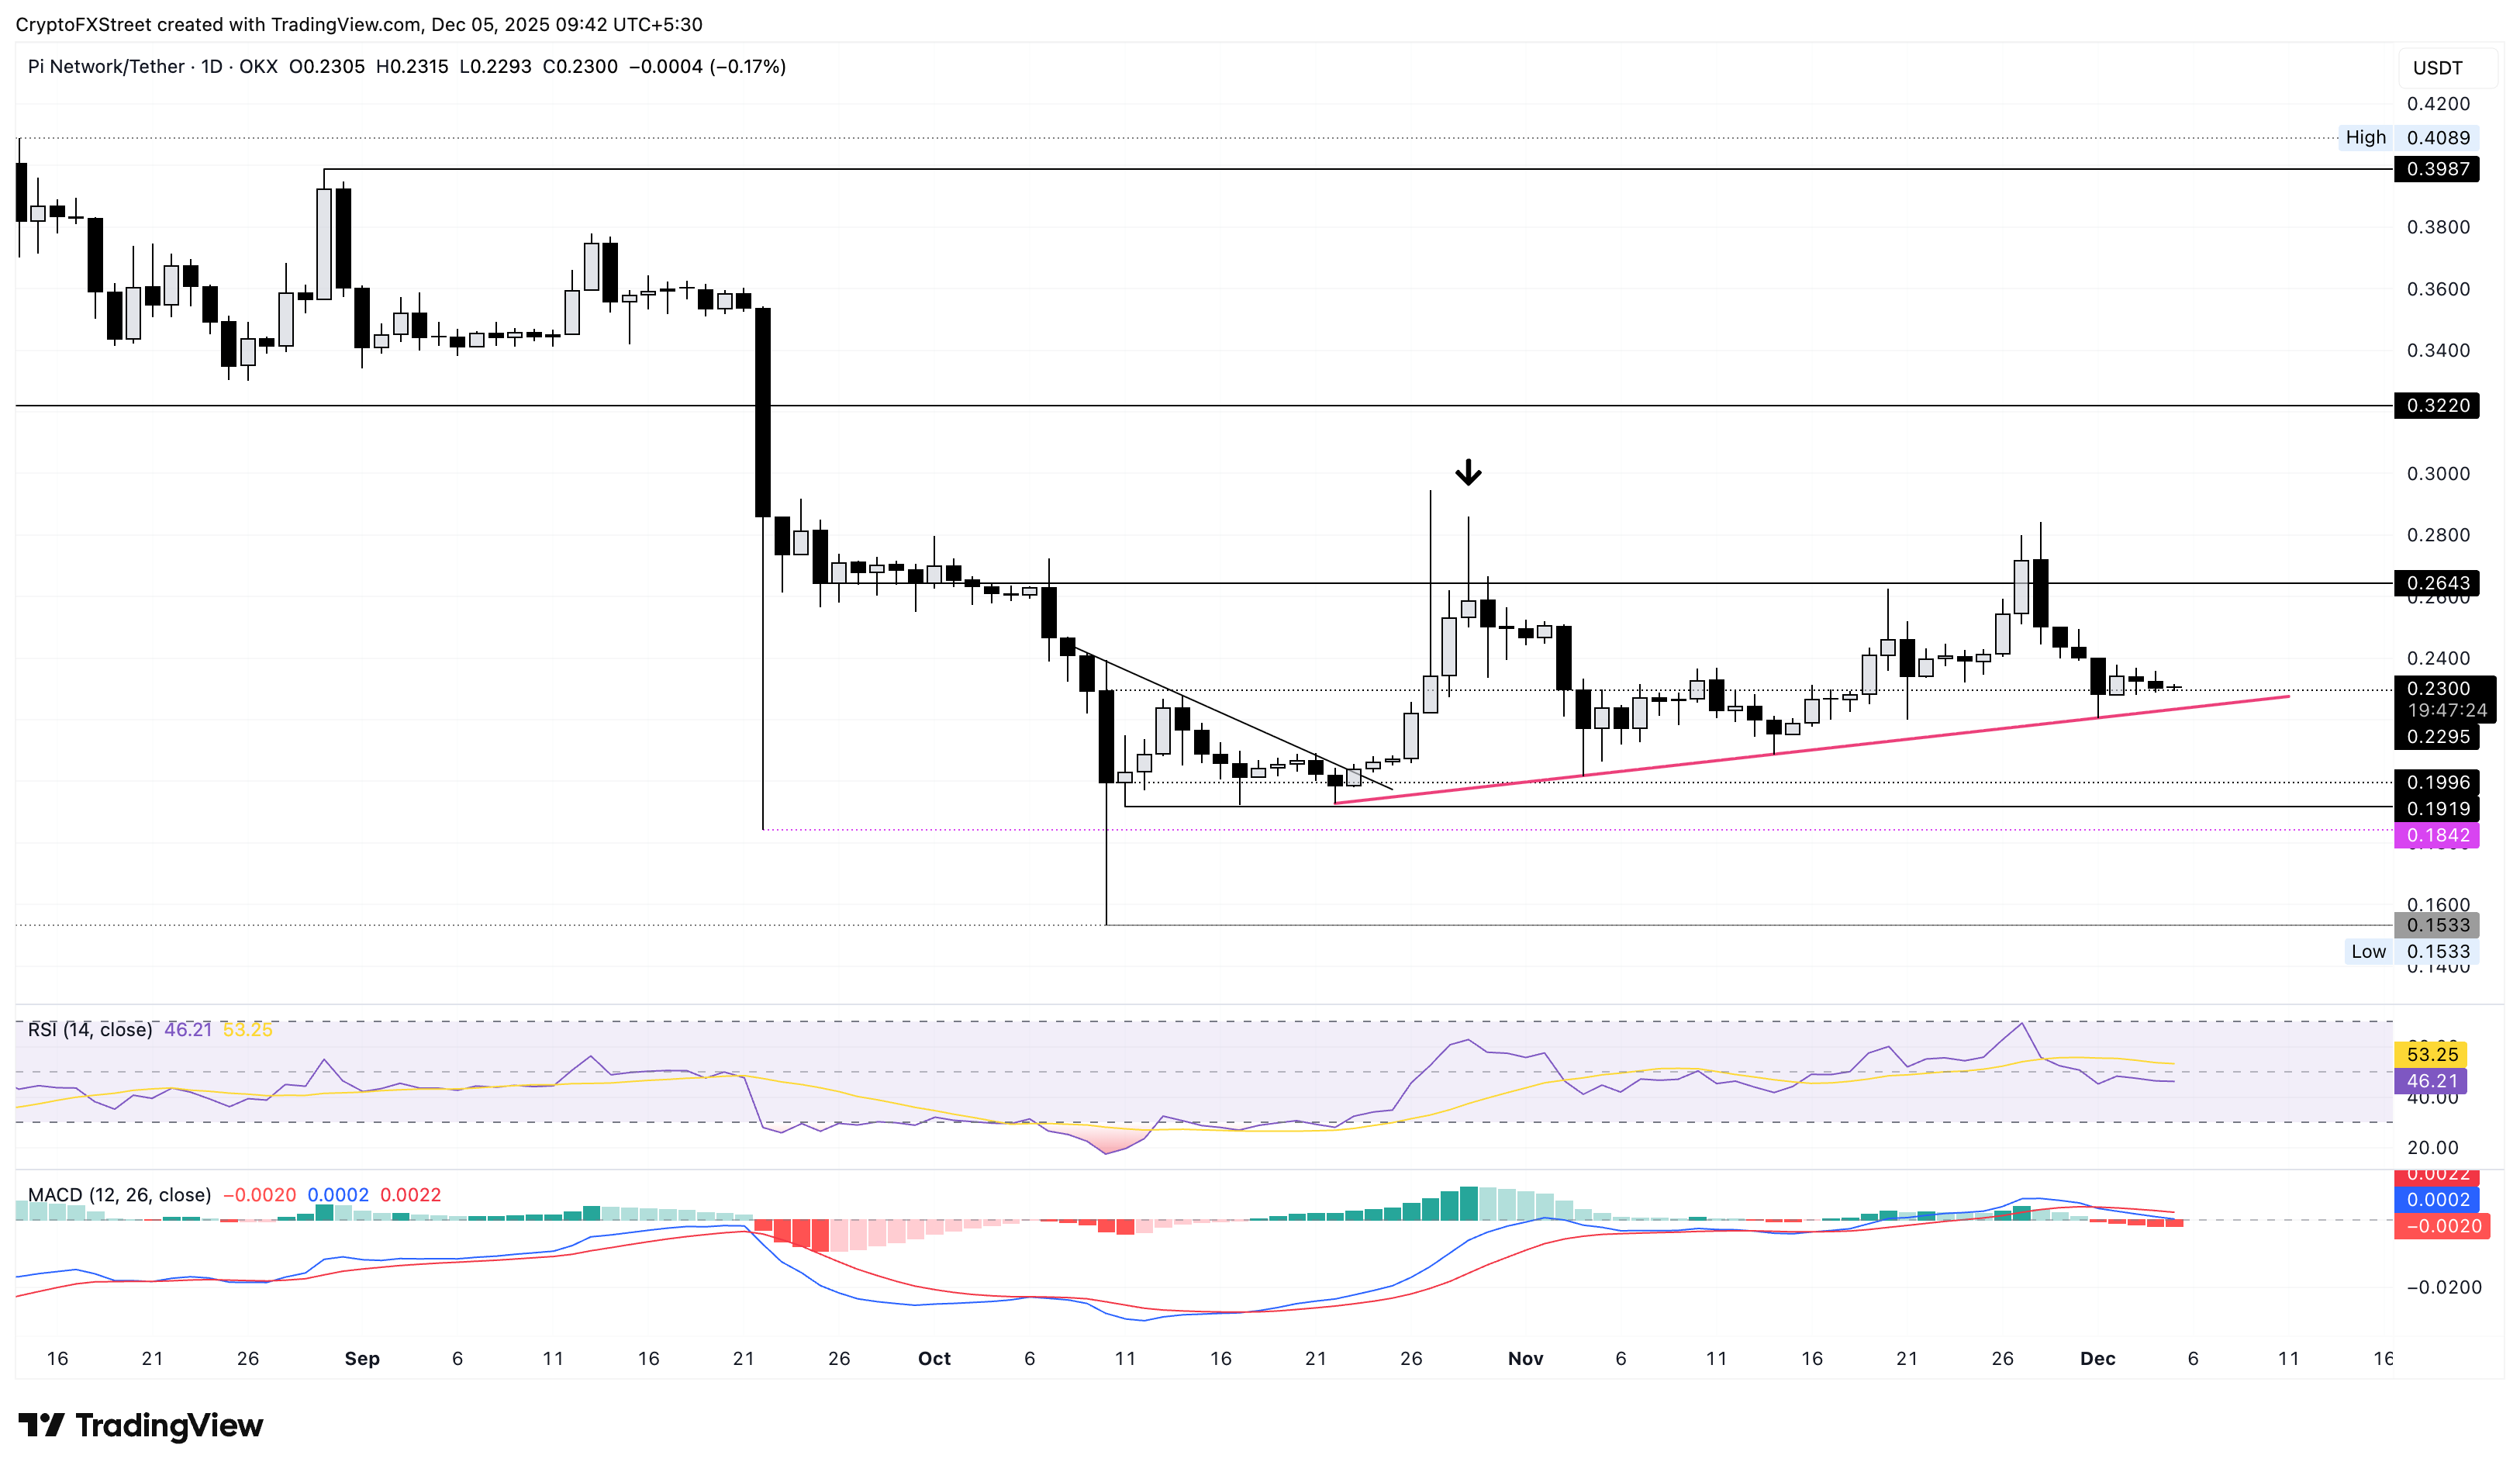
To reinstate an uptrend, PI should reclaim last week’s high at $0.2841, which could extend the rally to the August 1 low at $0.3220.
Bitcoin, altcoins, stablecoins FAQs
Bitcoin is the largest cryptocurrency by market capitalization, a virtual currency designed to serve as money. This form of payment cannot be controlled by any one person, group, or entity, which eliminates the need for third-party participation during financial transactions.
Altcoins are any cryptocurrency apart from Bitcoin, but some also regard Ethereum as a non-altcoin because it is from these two cryptocurrencies that forking happens. If this is true, then Litecoin is the first altcoin, forked from the Bitcoin protocol and, therefore, an “improved” version of it.
Stablecoins are cryptocurrencies designed to have a stable price, with their value backed by a reserve of the asset it represents. To achieve this, the value of any one stablecoin is pegged to a commodity or financial instrument, such as the US Dollar (USD), with its supply regulated by an algorithm or demand. The main goal of stablecoins is to provide an on/off-ramp for investors willing to trade and invest in cryptocurrencies. Stablecoins also allow investors to store value since cryptocurrencies, in general, are subject to volatility.
Bitcoin dominance is the ratio of Bitcoin's market capitalization to the total market capitalization of all cryptocurrencies combined. It provides a clear picture of Bitcoin’s interest among investors. A high BTC dominance typically happens before and during a bull run, in which investors resort to investing in relatively stable and high market capitalization cryptocurrency like Bitcoin. A drop in BTC dominance usually means that investors are moving their capital and/or profits to altcoins in a quest for higher returns, which usually triggers an explosion of altcoin rallies.

Hơn một triệu người dùng dựa vào FXStreet để có dữ liệu thị trường thời gian thực, công cụ biểu đồ, góc nhìn chuyên gia và tin tức Forex. Lịch kinh tế toàn diện và các hội thảo web giáo dục giúp nhà giao dịch luôn cập nhật và đưa ra quyết định có tính toán. FXStreet có khoảng 60 nhân sự, chia giữa trụ sở Barcelona và nhiều khu vực toàn cầu.
Đọc thêm


