
Pi Network declines as core team transfers 2 million tokens, fueling bearish sentiment
Bởi Vishal Dixit
Ngày xuất bản: 11 Dec 2025 | Ngày chỉnh sửa: 11 Dec 2025


BÀI VIẾT PHỔ BIẾN

Pi Network (PI) edges lower by 3% at press time on Thursday, marking its fifth consecutive day of losses. A transfer of 2 million PI tokens from the liquidity reserve, part of the Pi core team wallets, bolsters the bearish sentiment.
- Pi Network trades at $0.20, recording a 3% loss so far on Thursday.
- The Pi core team moved 2 million PI tokens from its liquidity reserve, which could add to the supply pressure.
- The technical outlook for PI remains bearish amid increasing selling pressure.
Pi Network (PI) edges lower by 3% at press time on Thursday, marking its fifth consecutive day of losses. A transfer of 2 million PI tokens from the liquidity reserve, part of the Pi core team wallets, bolsters the bearish sentiment. The technical outlook for PI targets the October 11 low at $0.1919 as the immediate support level.
Pi core team shifts 2 million tokens amid broader market sell-off
PiScan data shows an outflow of 2 million PI tokens from the Pi core team's liquidity reserve wallet. Typically, such transfers are a strategic distribution of supply for rewards or operations.
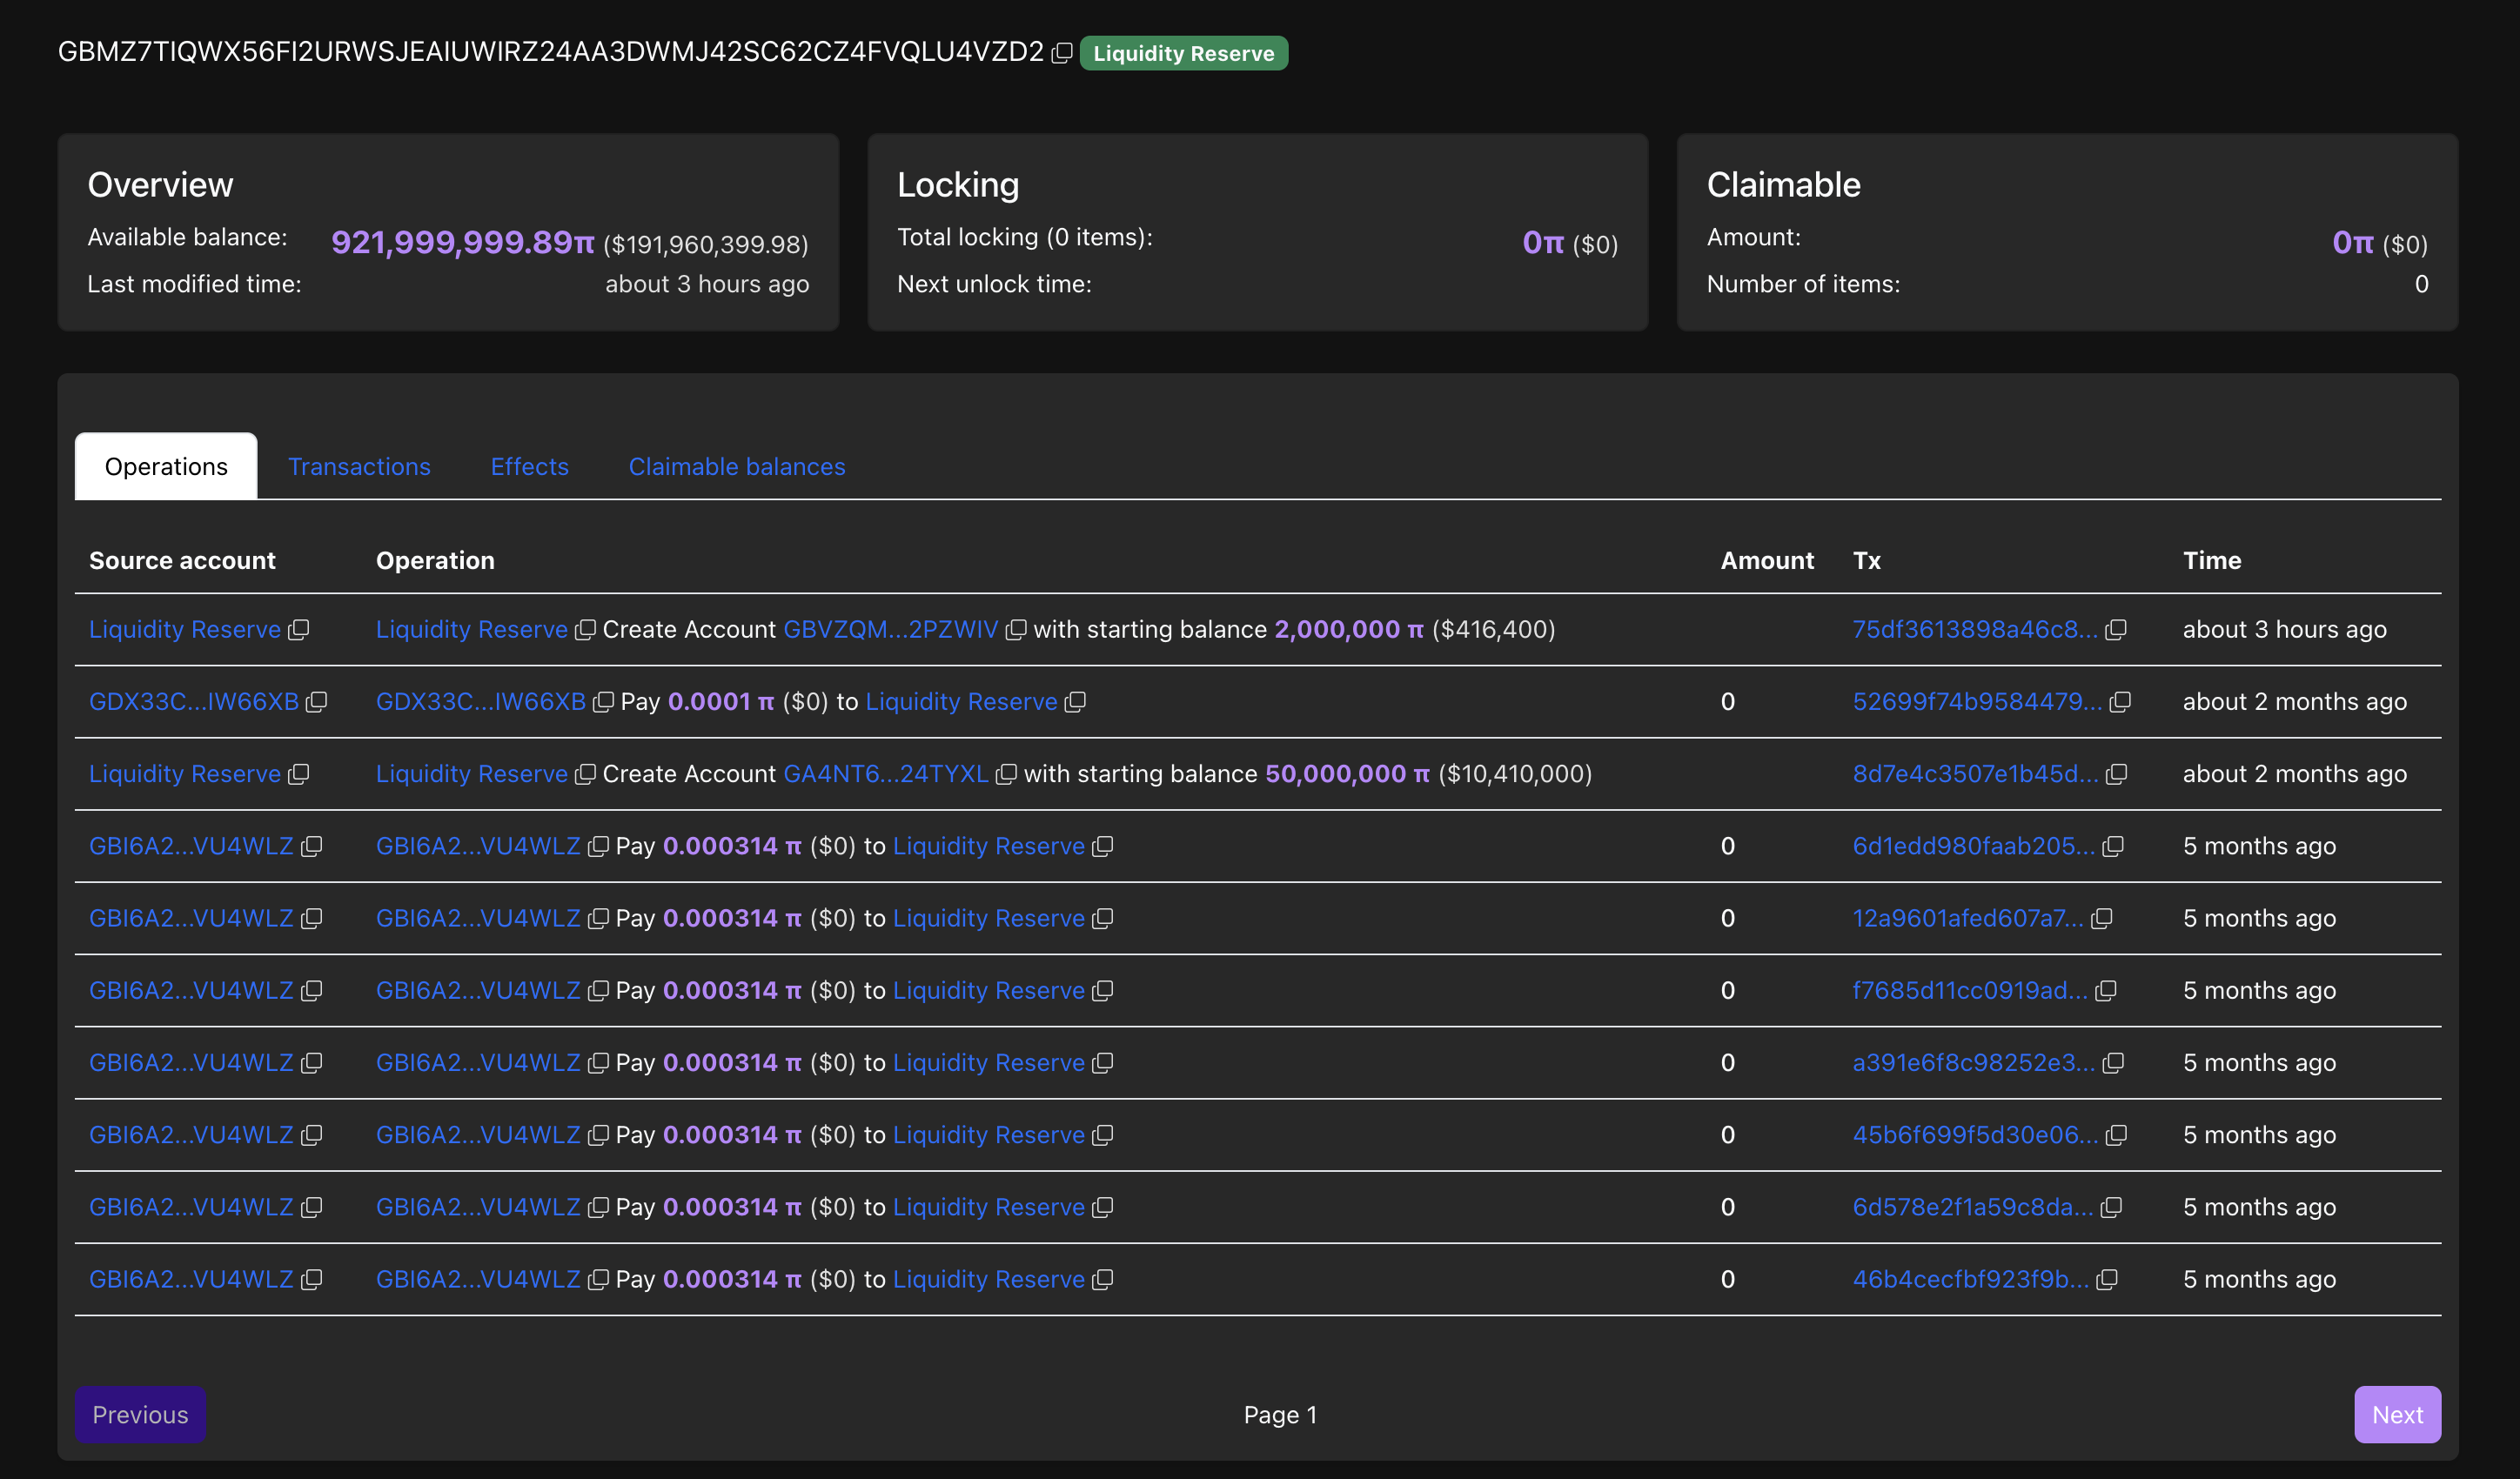
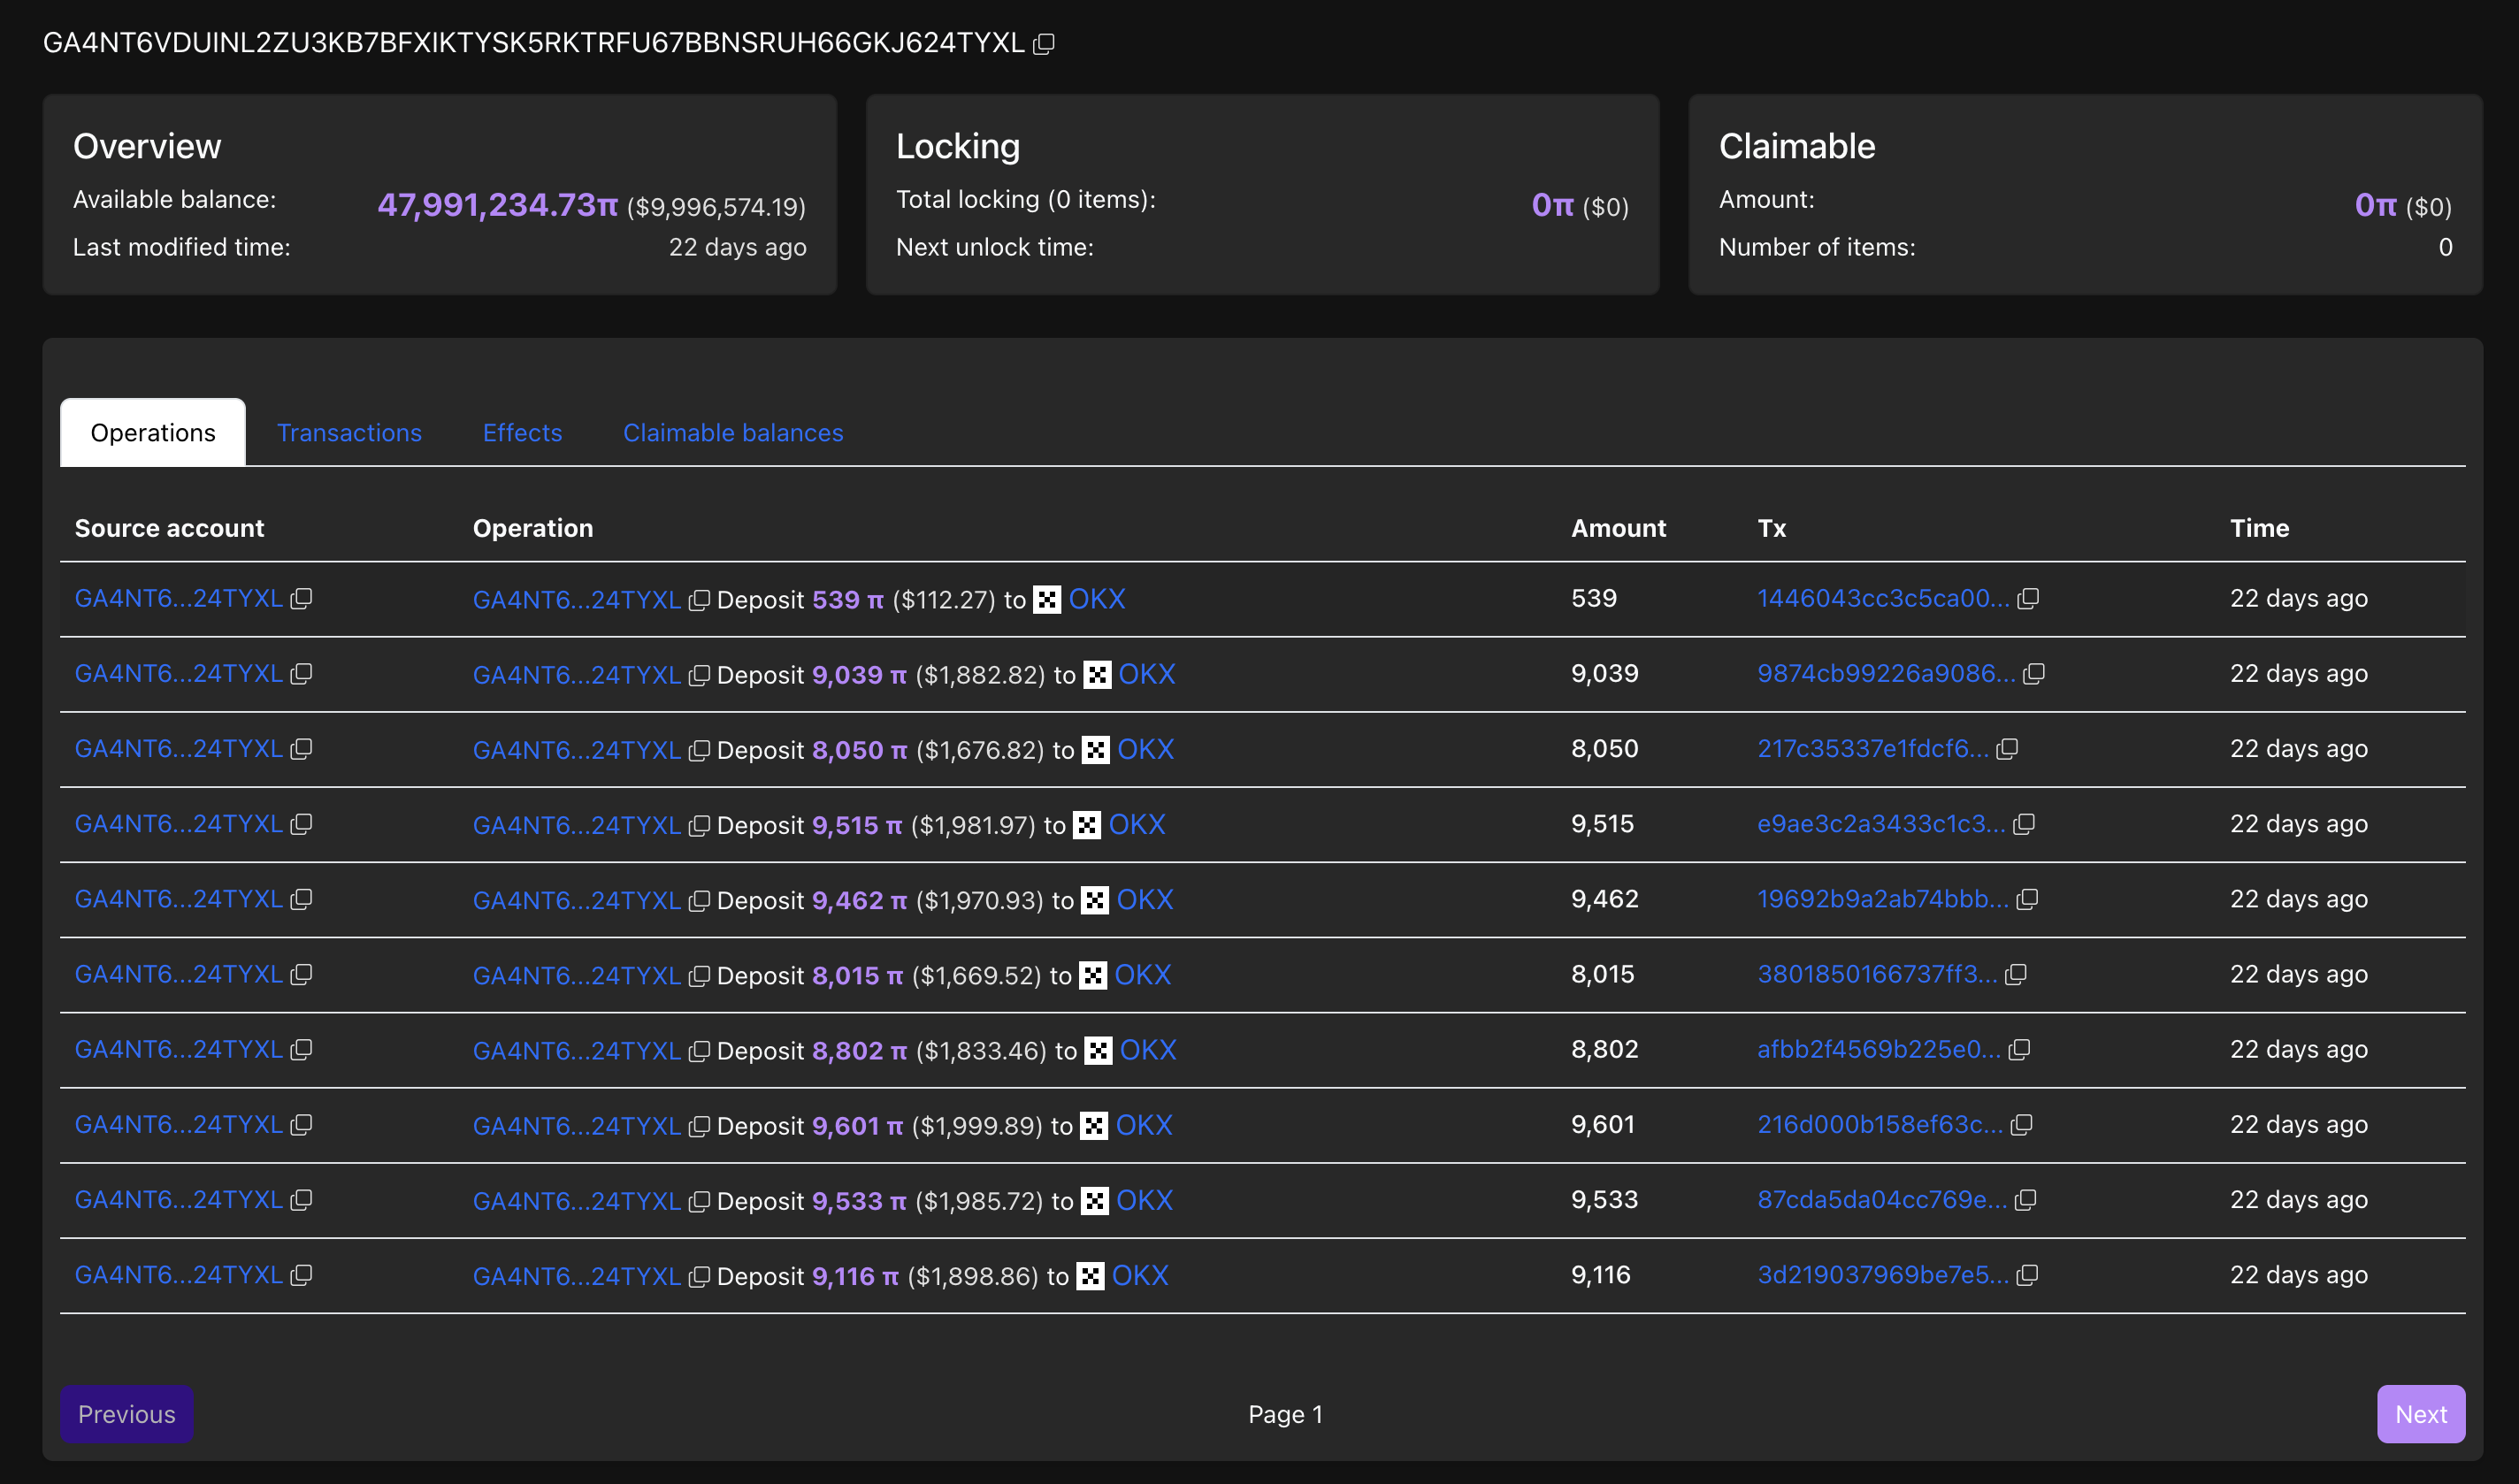
However, a similar transfer of 50 million Pi tokens to a different wallet two months ago saw multiple deposits to the OKX exchange, potentially linked to selling. As of Thursday, the wallet holds less than 48 million tokens after depositing over 3 million tokens to OKX.
With the core team likely consolidating its holdings, bearish sentiment surrounding Pi Network intensifies.
Technical Outlook: Pi Network’s decline eyes its record low as final support
Pi Network is down over 6% this week so far, extending the 7% loss from the previous one. The mobile mining cryptocurrency flashed a sell signal on Tuesday, crossing below the Supertrend indicator line near $0.2200.
Pi Network’s declining trend inches toward the October 11 low at $0.1919 as the immediate support. Below this, the October 10 low at $0.1533 would serve as the PI token's all-time low support.
On the same lines, the momentum indicators on the daily chart suggest a bearish bias. The Relative Strength Index (RSI) at 35 maintains a downward slope, approaching the oversold zone, indicating a steady rise in selling pressure.
At the same time, the Moving Average Convergence Divergence (MACD) crosses below the zero line with its signal line while the red histogram bars successively rise into the negative direction. This indicates that the bearish momentum is increasing.
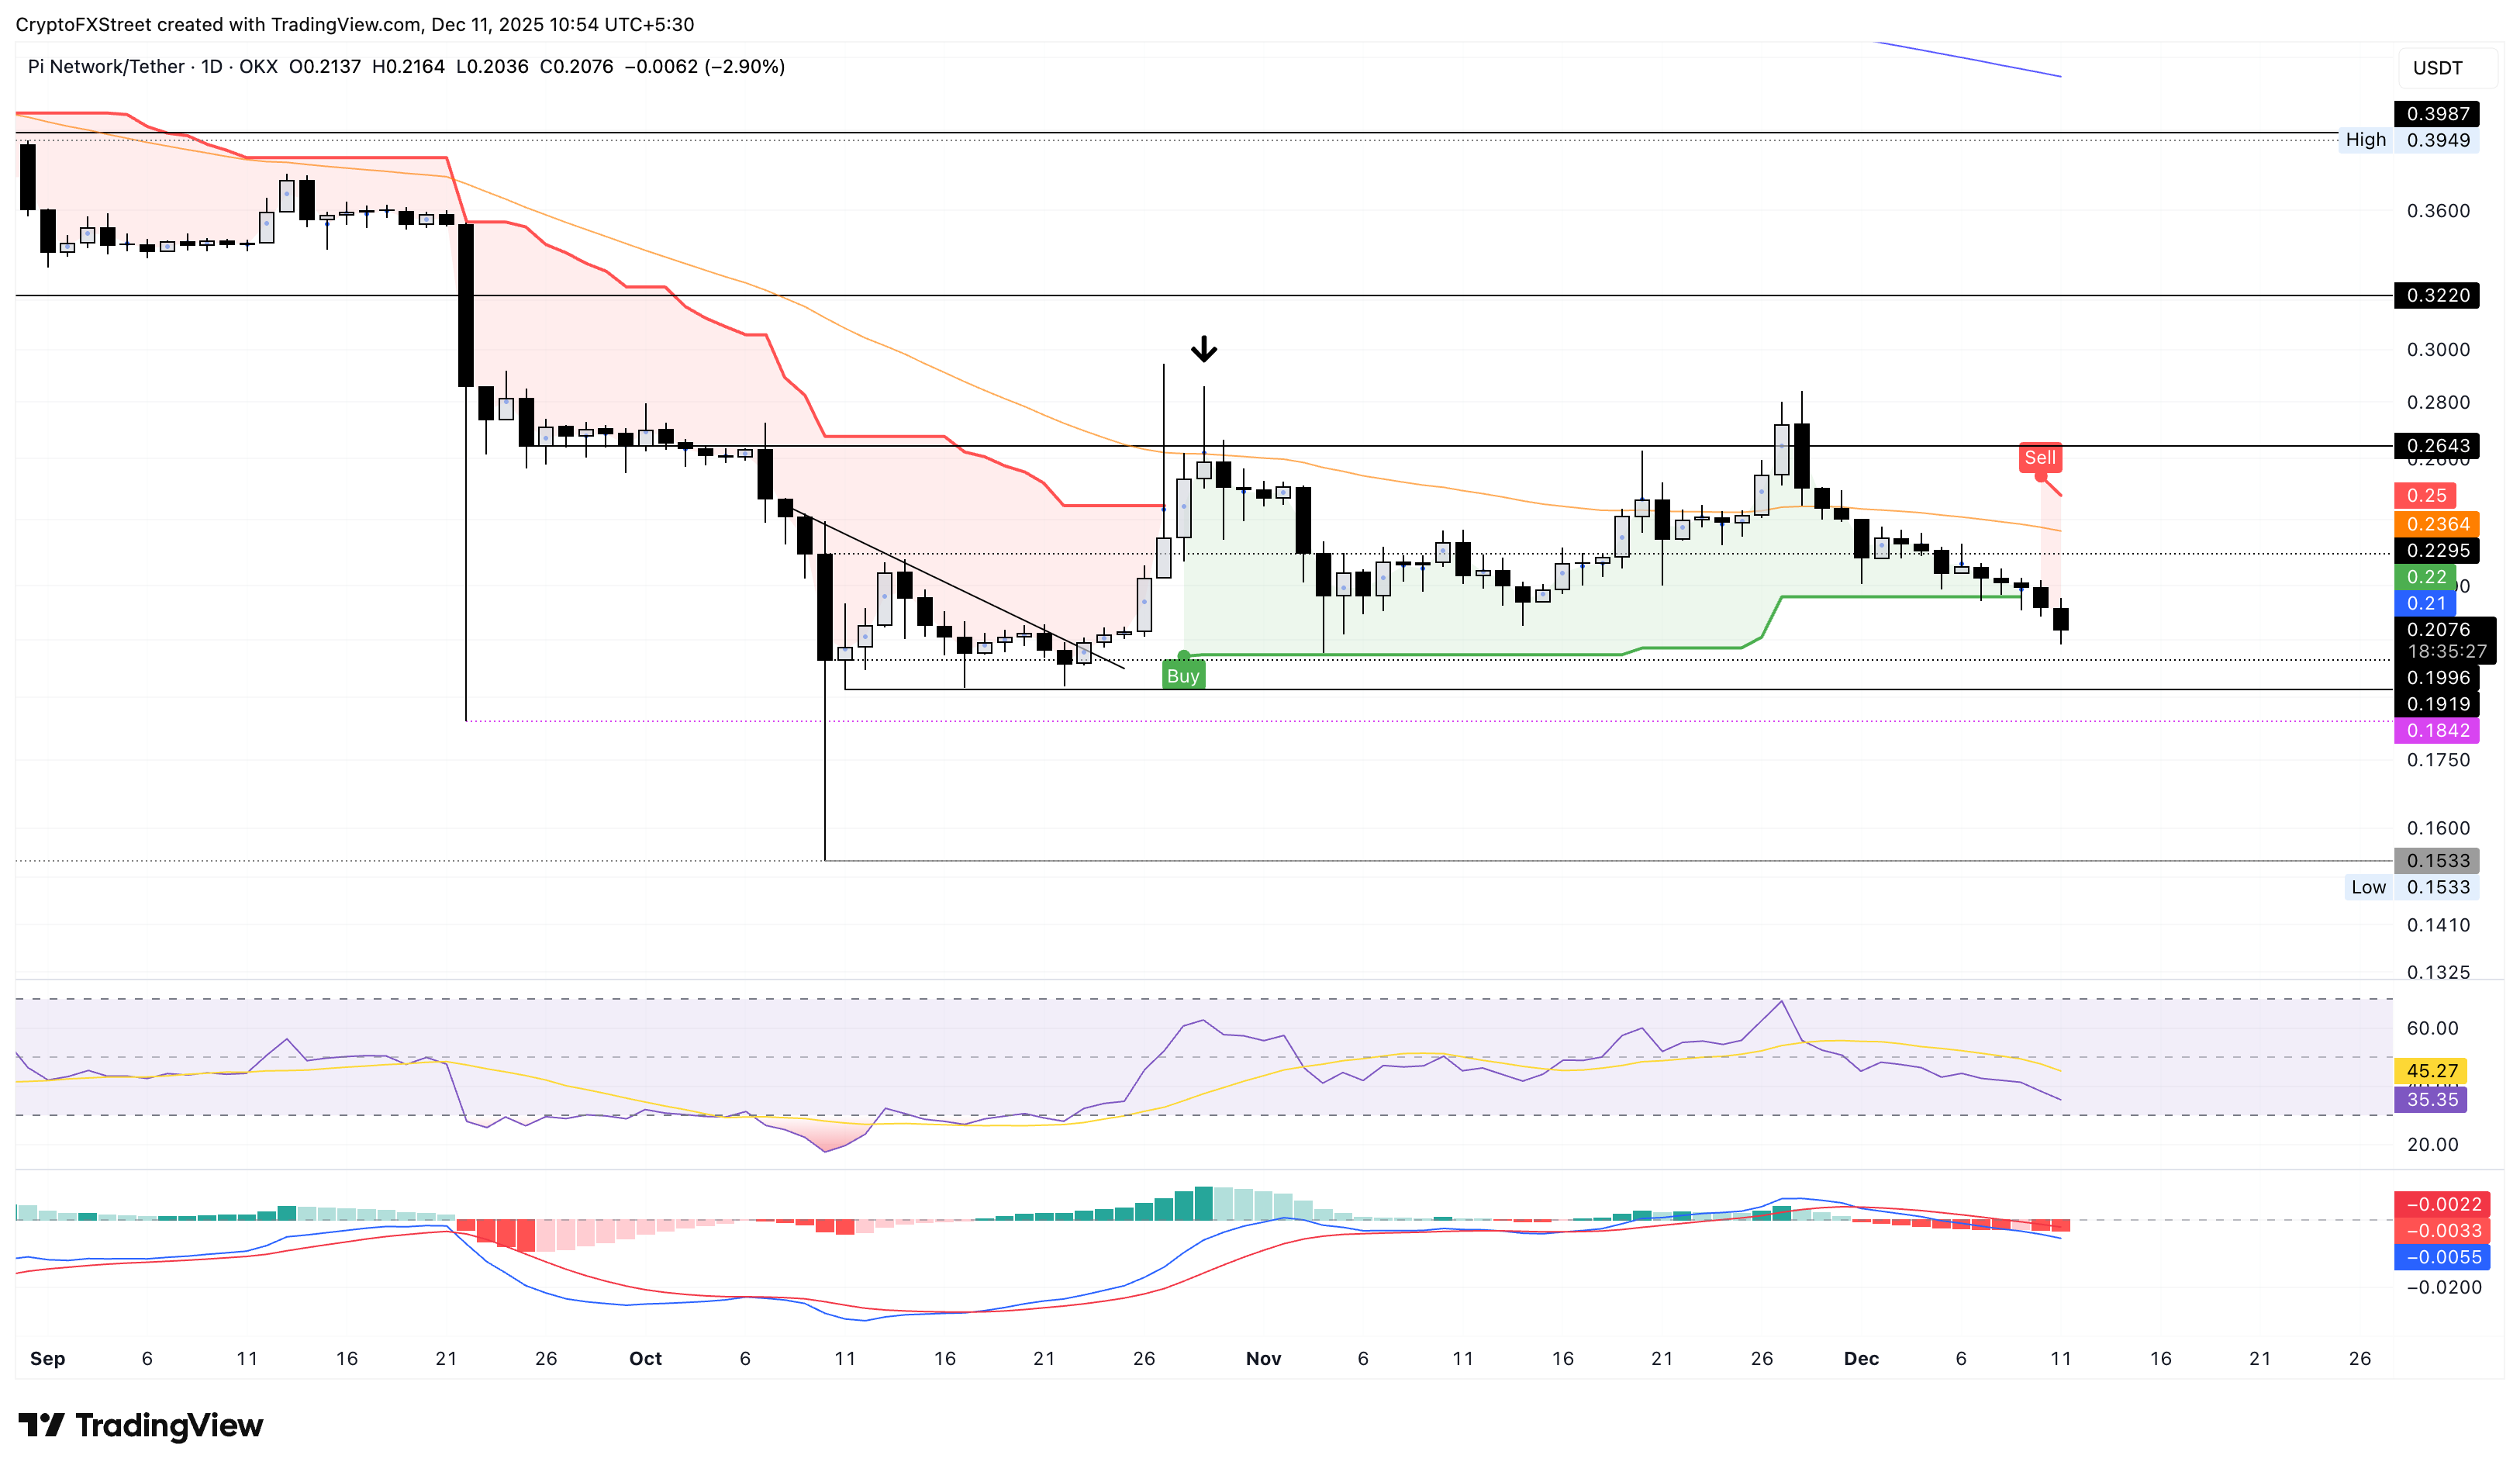
Looking up, a potential bounce back from $0.1919 could push PI to test the 50-day Exponential Moving Average at $0.2364. To reinforce a bullish trend, PI should cross above the Supertrend indicator line at $0.2500.
Cryptocurrency metrics FAQs
The developer or creator of each cryptocurrency decides on the total number of tokens that can be minted or issued. Only a certain number of these assets can be minted by mining, staking or other mechanisms. This is defined by the algorithm of the underlying blockchain technology. On the other hand, circulating supply can also be decreased via actions such as burning tokens, or mistakenly sending assets to addresses of other incompatible blockchains.
Market capitalization is the result of multiplying the circulating supply of a certain asset by the asset’s current market value.
Trading volume refers to the total number of tokens for a specific asset that has been transacted or exchanged between buyers and sellers within set trading hours, for example, 24 hours. It is used to gauge market sentiment, this metric combines all volumes on centralized exchanges and decentralized exchanges. Increasing trading volume often denotes the demand for a certain asset as more people are buying and selling the cryptocurrency.
Funding rates are a concept designed to encourage traders to take positions and ensure perpetual contract prices match spot markets. It defines a mechanism by exchanges to ensure that future prices and index prices periodic payments regularly converge. When the funding rate is positive, the price of the perpetual contract is higher than the mark price. This means traders who are bullish and have opened long positions pay traders who are in short positions. On the other hand, a negative funding rate means perpetual prices are below the mark price, and hence traders with short positions pay traders who have opened long positions.

Hơn một triệu người dùng dựa vào FXStreet để có dữ liệu thị trường thời gian thực, công cụ biểu đồ, góc nhìn chuyên gia và tin tức Forex. Lịch kinh tế toàn diện và các hội thảo web giáo dục giúp nhà giao dịch luôn cập nhật và đưa ra quyết định có tính toán. FXStreet có khoảng 60 nhân sự, chia giữa trụ sở Barcelona và nhiều khu vực toàn cầu.
Đọc thêm


