
Pi Network Price Forecast: PI languishes amid declining social buzz
Bởi Vishal Dixit
Đã cập nhật: 9 Apr 2026


BÀI VIẾT PHỔ BIẾN

Pi Network (PI) trades below $0.1700 at press time on Thursday, largely unaffected by geopolitical factors that have driven whipsaws across major cryptocurrencies. The social volume and dominance of Pi Network have significantly decreased, leading to a gradual decline in the spot market.
- Pi Network extends losses below $0.1700 on Thursday, pointing to a fifth consecutive week of declines.
- Pi Network's social volume and dominance have significantly decreased, indicating reduced retail interest.
- The technical outlook is bearish, with the path of least resistance targeting the immediate support levels.
Pi Network (PI) trades below $0.1700 at press time on Thursday, largely unaffected by geopolitical factors that have driven whipsaws across major cryptocurrencies. The social volume and dominance of Pi Network have significantly decreased, leading to a gradual decline in the spot market. The ongoing correction in the PI token implies a path of least resistance toward the $0.1556 support level.
Social interest in Pi Network wanes
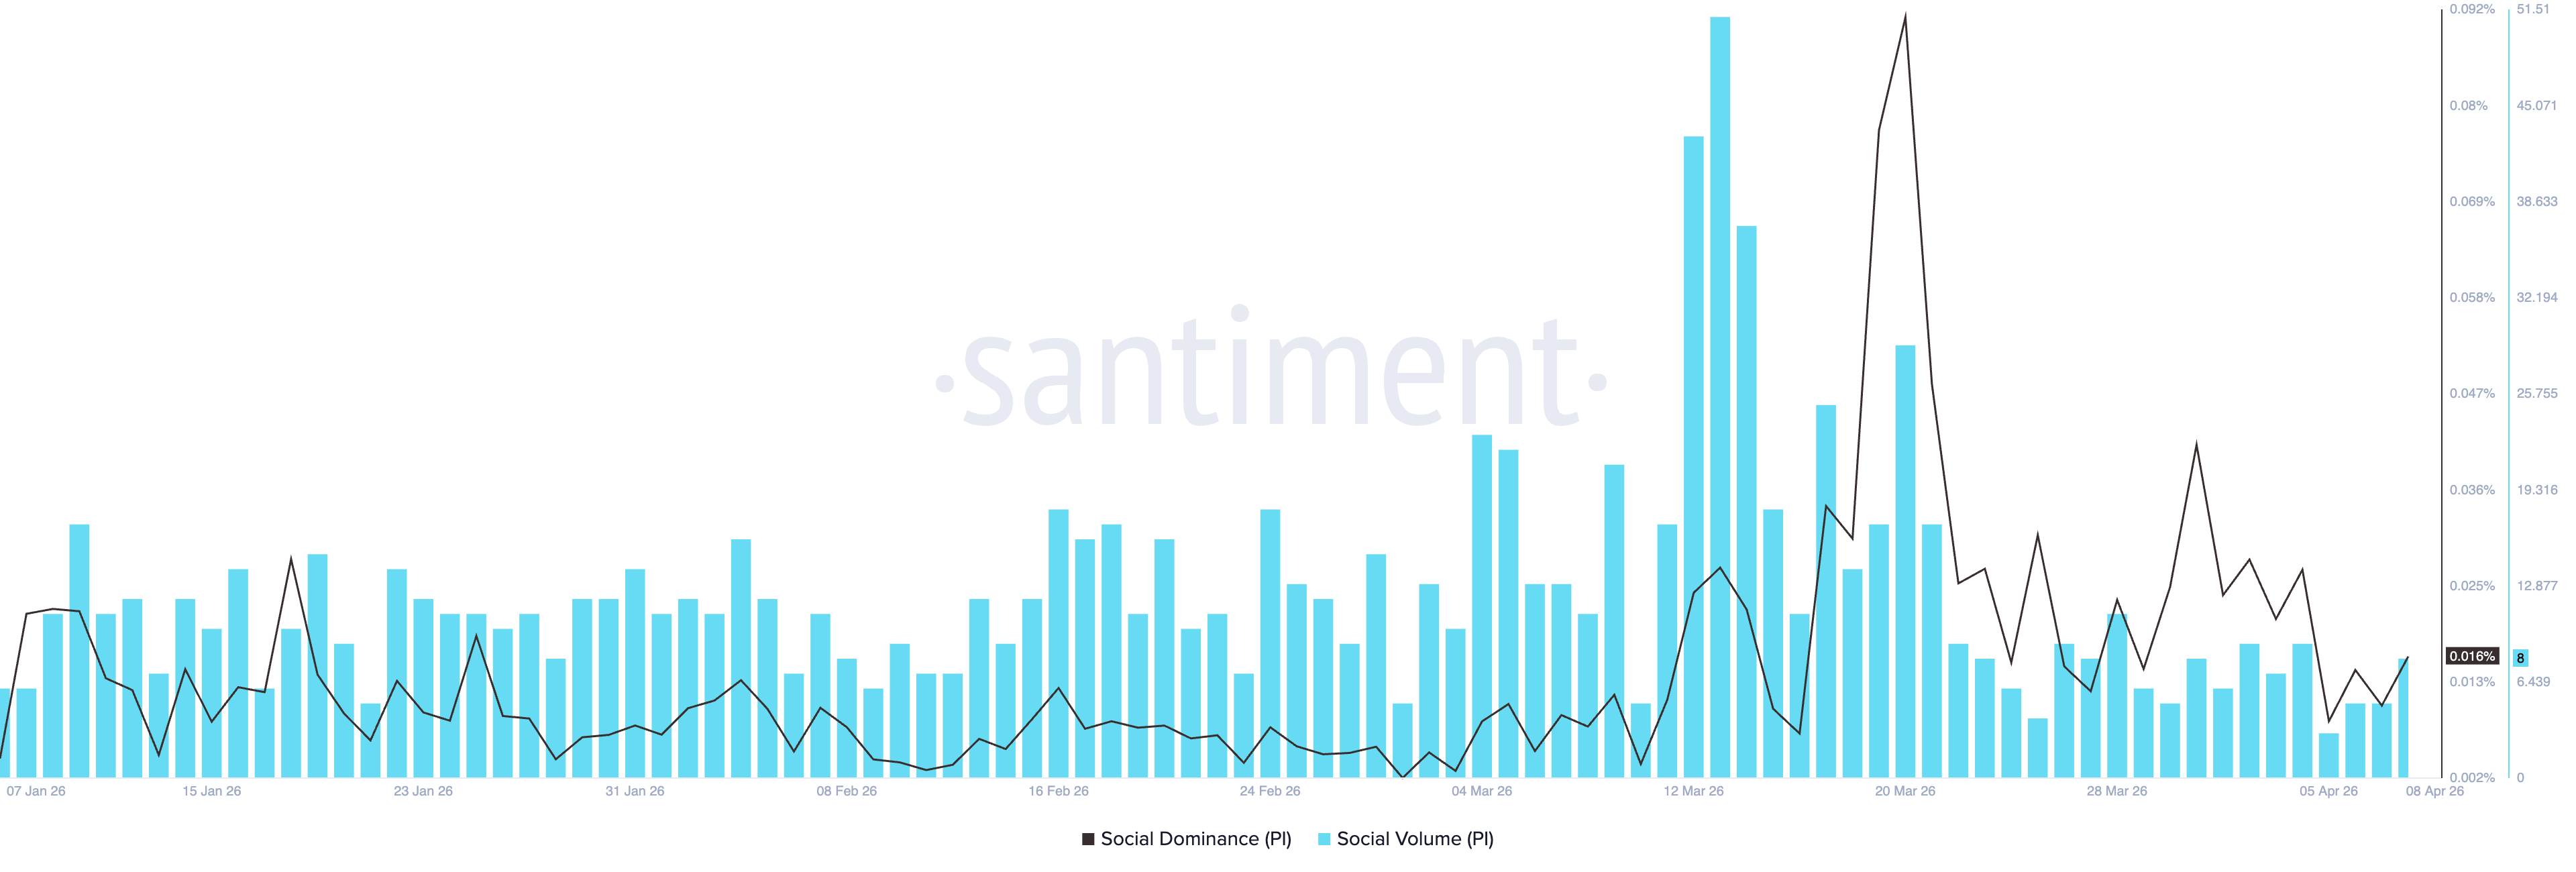
Pi Network reacts quickly during times of speculation and heightened social interest, similar to a meme coin, due to a lack of transparency and community-driven behavior. Santiment data shows a sharp decline in Pi Network’s social volume to 8 and dominance to 0.016%, down from 29 and 0.090% on March 20, respectively, suggesting muted community support and activity amid broader market volatility driven by doubts about the US-Iran ceasefire. A consistent decline of stagnation at lower levels could reflect downside pressure weighing down on Pi Network.
Pi Network searches for the next leg down
Pi Network extends its second consecutive day of losses below $0.1700 at press time on Thursday. The PI token holds a bearish near-term bias as the spot price remains beneath the stack of 50-, 100-, and 200-day Exponential Moving Averages (EMAs).
The 50-day EMA at $0.1821 and the 100-day EMA near $0.1910 both sit overhead as dynamic resistance, reinforcing the broader downward structure defined by the long-term 200-day EMA around $0.2466. Momentum indicators echo a soft tone, with the Relative Strength Index (RSI) at 41 on the daily chart, remaining in a largely declining trend below the midline, which suggests waning buying pressure. Meanwhile, the Moving Average Convergence Divergence (MACD) line is approaching the signal line, pointing to a possible bullish crossover, while the contracting histogram bars suggest muted selling pressure.
A steady downtrend in the PI token, given the muted social interest, has the nearby support aligning with the February 23 low at $0.1556, where a sustained hold would help stabilize the trend. A decisive drop below this zone would reopen the door to the February 11 low at $0.1310. If this level is breached, PI would further weaken toward lower, uncharted levels.
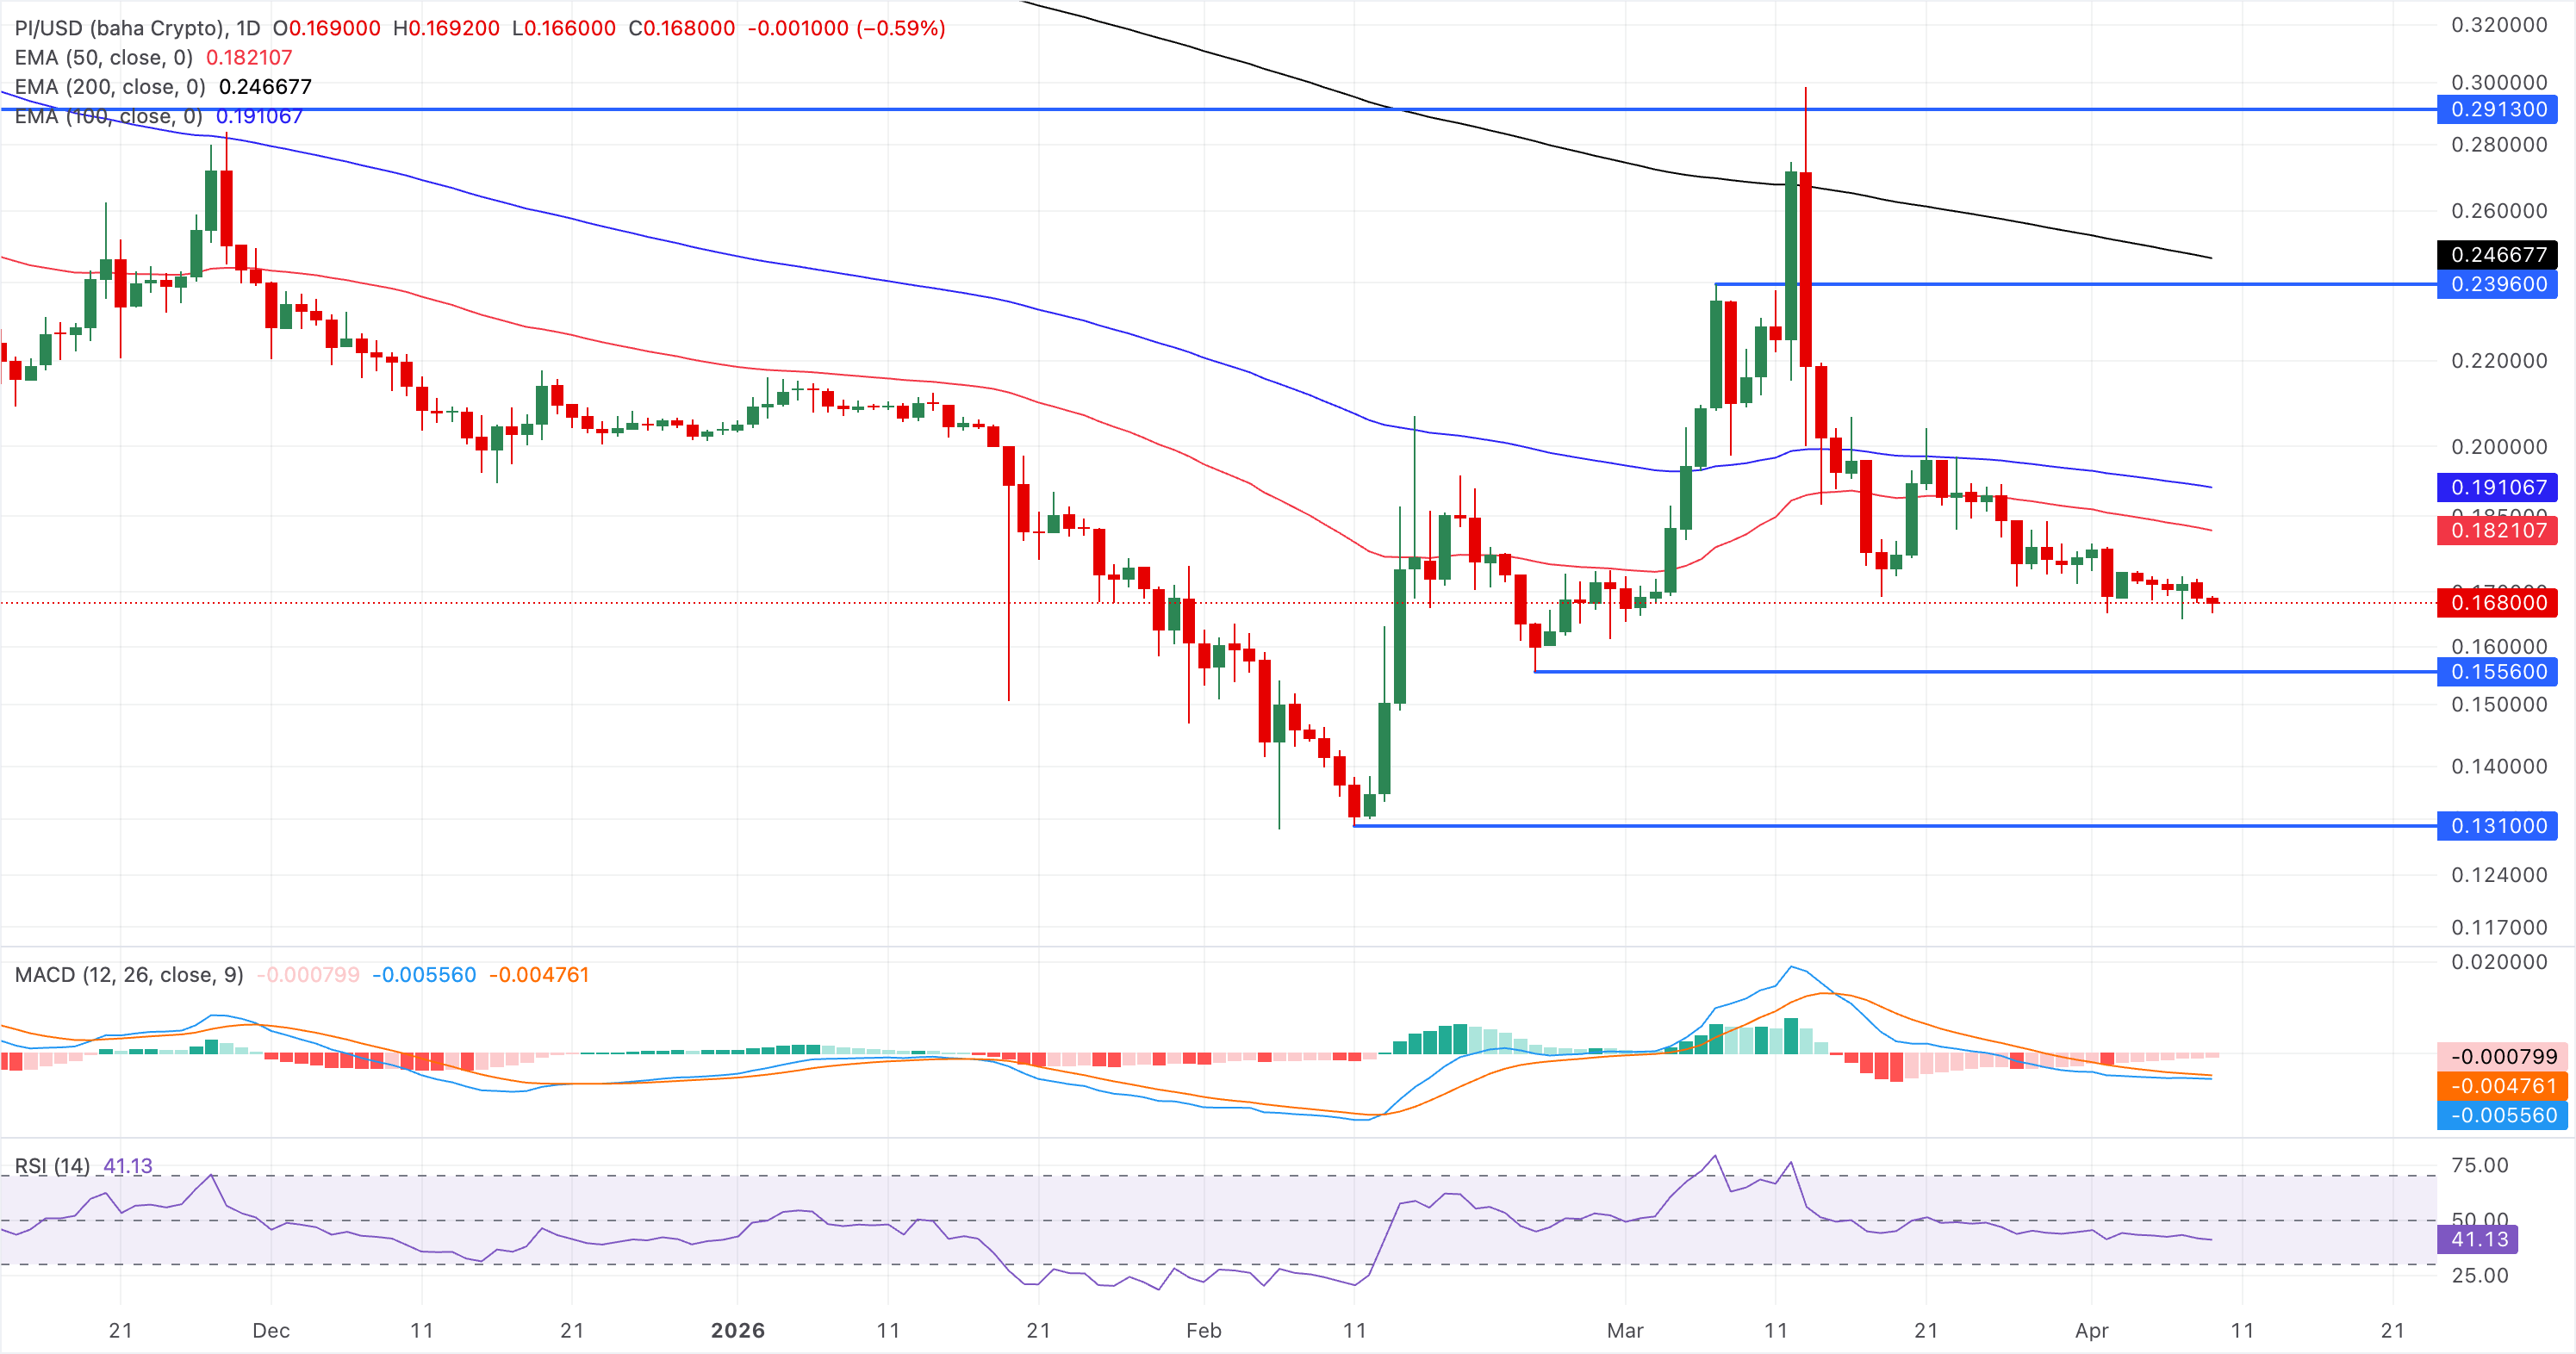
On the topside, immediate resistance is seen first at the 50-day EMA around $0.1821. Meanwhile, the 100-day EMA at $0.1910 marks a much higher structural barrier that would need to be reclaimed to ease the broader downtrend.
(The technical analysis of this story was written with the help of an AI tool.)

Hơn một triệu người dùng dựa vào FXStreet để có dữ liệu thị trường thời gian thực, công cụ biểu đồ, góc nhìn chuyên gia và tin tức Forex. Lịch kinh tế toàn diện và các hội thảo web giáo dục giúp nhà giao dịch luôn cập nhật và đưa ra quyết định có tính toán. FXStreet có khoảng 60 nhân sự, chia giữa trụ sở Barcelona và nhiều khu vực toàn cầu.
Đọc thêm


