
Pump.fun Price Forecast: PUMP slips below critical support as retail capitulation persists
Bởi John Isige
Ngày xuất bản: 19 Feb 2026 | Ngày chỉnh sửa: 19 Feb 2026


BÀI VIẾT PHỔ BIẾN

Pump.fun (PUMP) is edging lower alongside crypto majors like Bitcoin (BTC) and Ethereum (ETH), trading at $0.0019 at the time of writing on Thursday. The meme coin launch and trading platform’s native token marks three consecutive days in the red amid a deteriorating technical picture.
- Pump.fun corrects below $0.0020, weighed down by rising bearish bets amid wider risk-off sentiment.
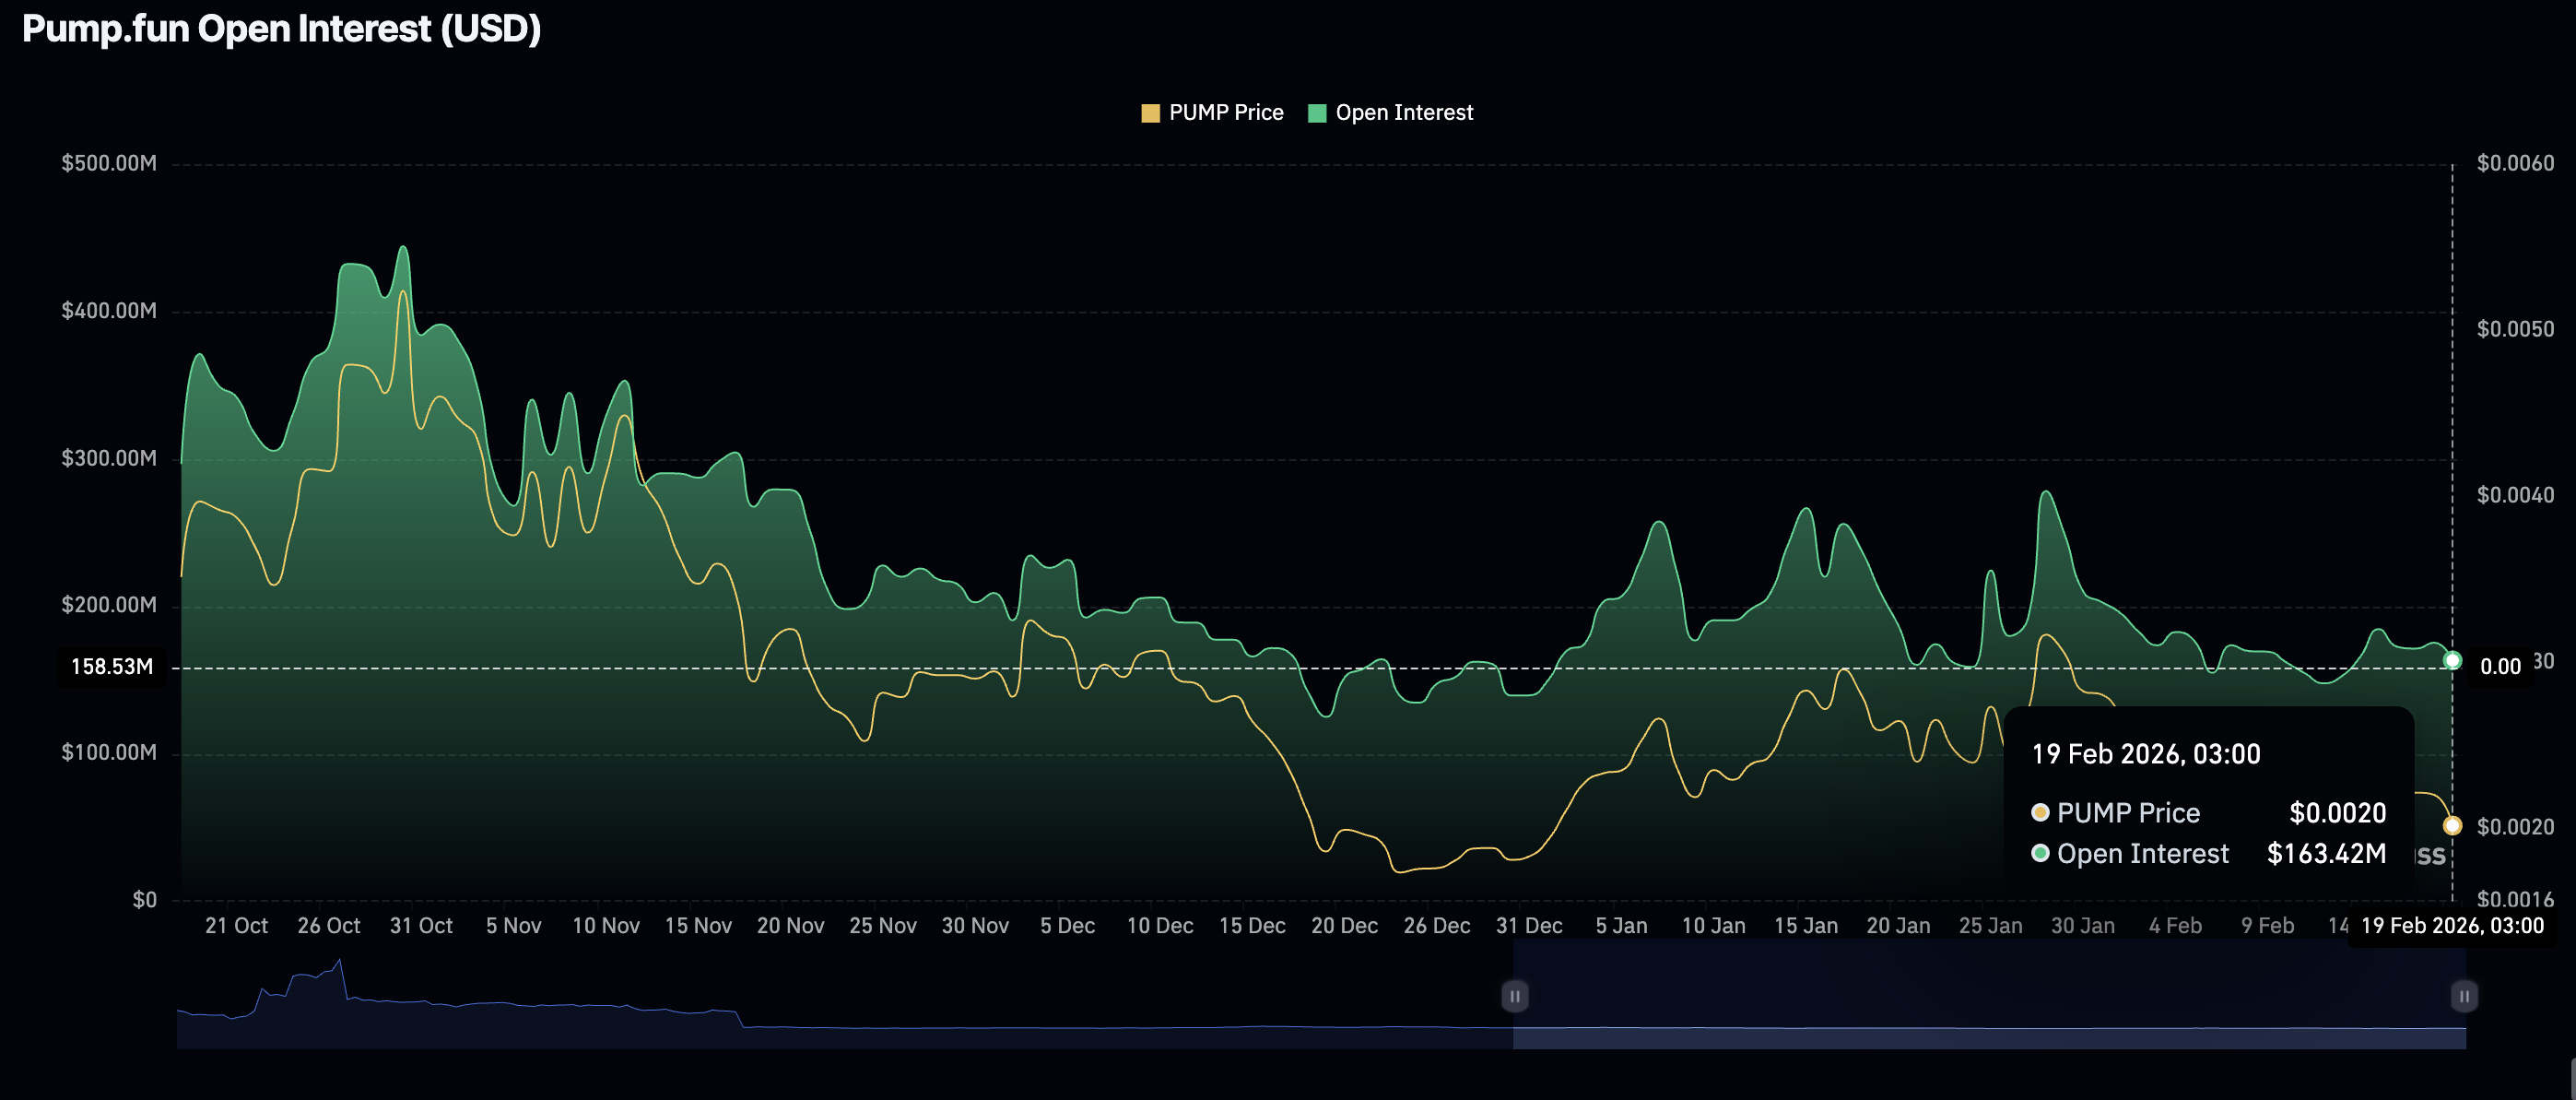
- Low retail interest, as evidenced by futures Open Interest shrinking to $163 million, fuels PUMP’s drawdown.
- Pump.fun revenue and DeFi TVL drop to $1.48 million and $172 million, respectively, amid cooling trading activity.
Pump.fun (PUMP) is edging lower alongside crypto majors like Bitcoin (BTC) and Ethereum (ETH), trading at $0.0019 at the time of writing on Thursday. The meme coin launch and trading platform’s native token marks three consecutive days in the red amid a deteriorating technical picture.
Pump.fun revenue and DeFi TVL fall
The notional value of all tokens in Pump.fun’s smart contracts averaged $172 million on Thursday, down from $178 million the previous day. DefiLlama data shows that the Total Value Locked (TVL) has gradually faded from $335 million, a record set in September.
This downtrend indicates that investors continue to lose confidence in PUMP and the ecosystem – a scenario that could be contributing to the extended sell-off. Traders withdraw their assets from smart contracts to sell, reducing risk exposure.
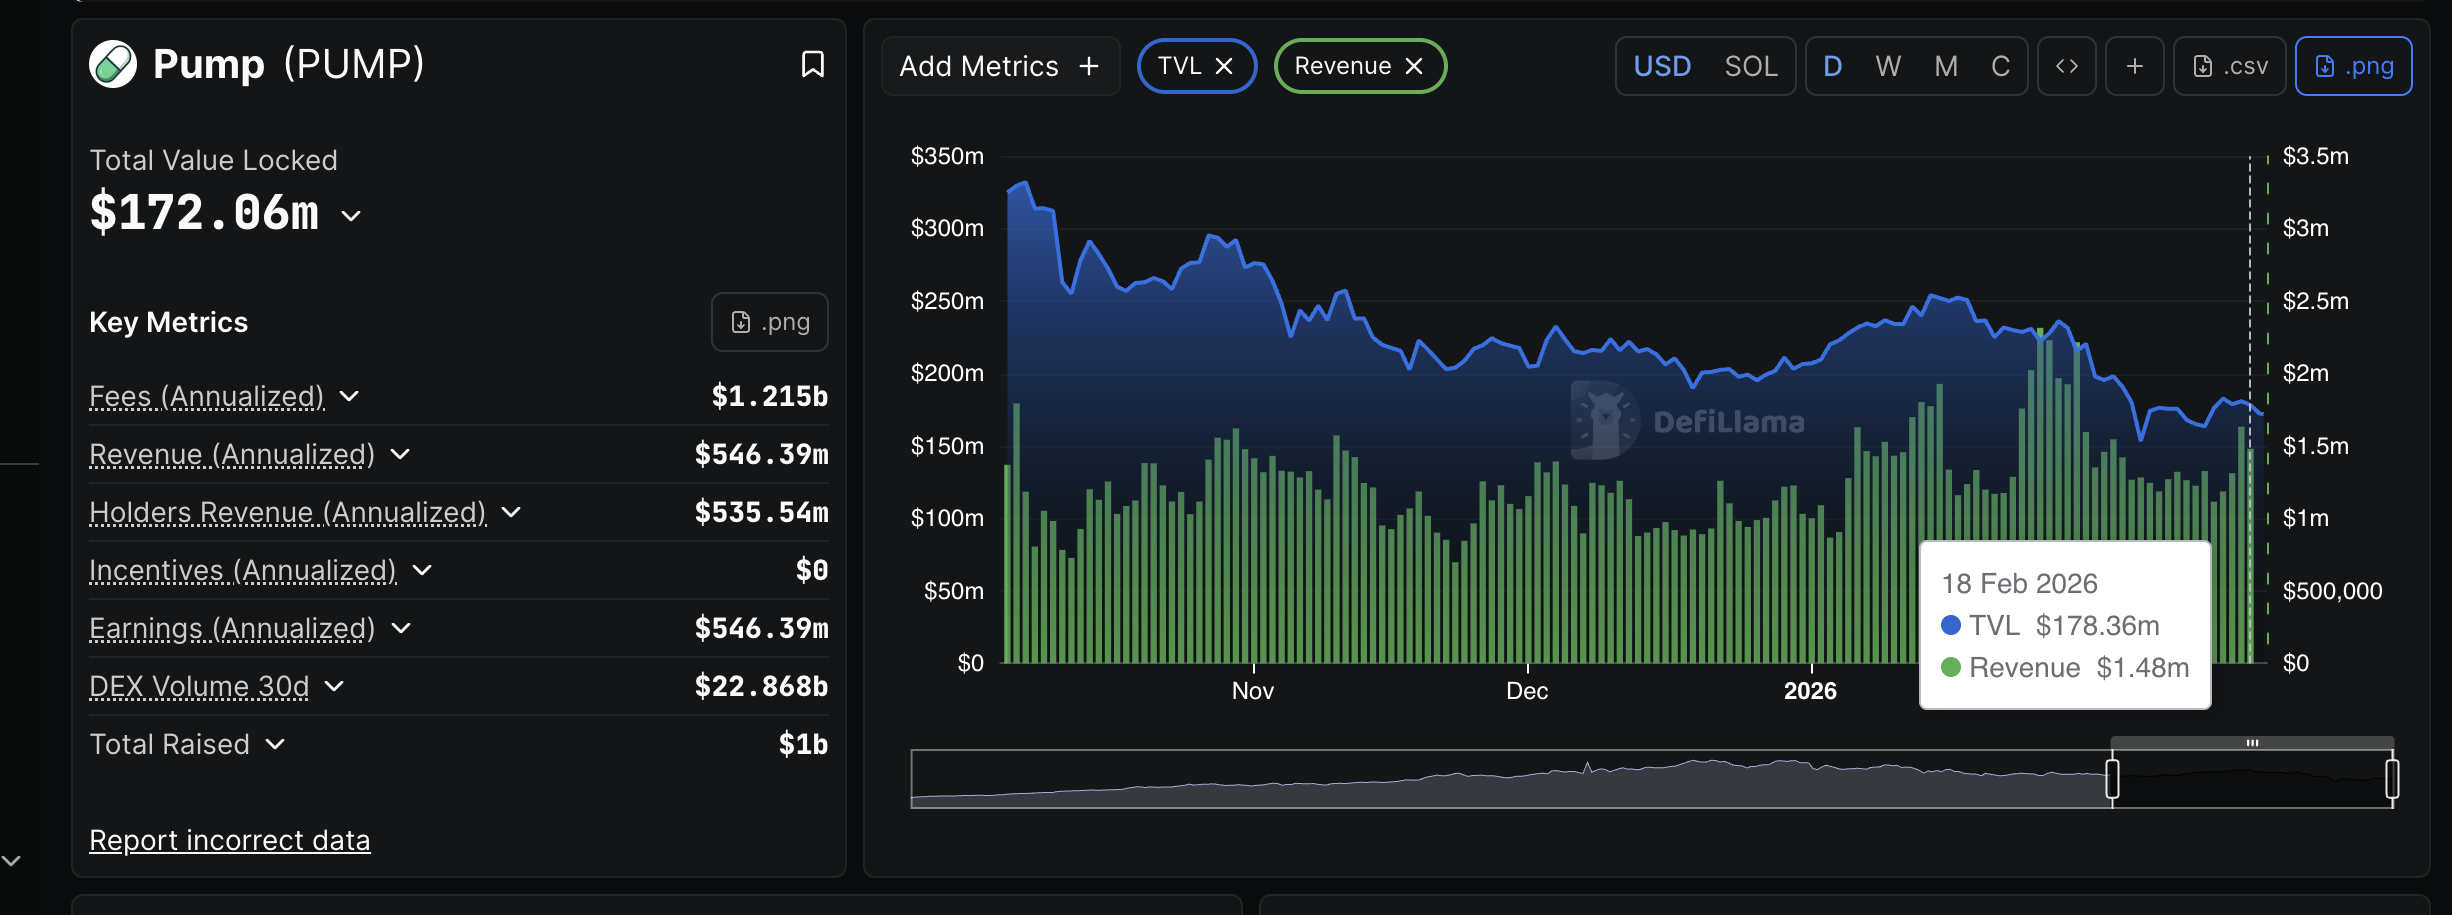
At the same time, the total revenue collected by the meme coin launchpad and trading platform has declined to $1.48 million as of Wednesday, from the $1.63 million recorded on Tuesday. The platform awaits Friday’s data to validate a steady downtrend or positively change its outlook.
The derivatives market also paints a grim picture, with futures Open Interest (OI) shrinking to $163 million on Thursday, down from $175 million the previous day. PUMP’s futures OI peaked at $1.23 in September, underscoring the capitulation of retail investors.
Technical outlook: PUMP at risk of 15% decline
PUMP holds slightly below $0.0020 as sellers tighten their grip, in line with a deteriorating technical structure. The 50-day Exponential Moving Average (EMA) appears to cap rebounds at $0.0024, while the 100-day EMA is positioned above it at $0.0027.
A daily close below the immediate resistance at $0.0020 could see PUMP potentially accelerate its downtrend by 15% to $0.0017, a level tested as support on February 6.
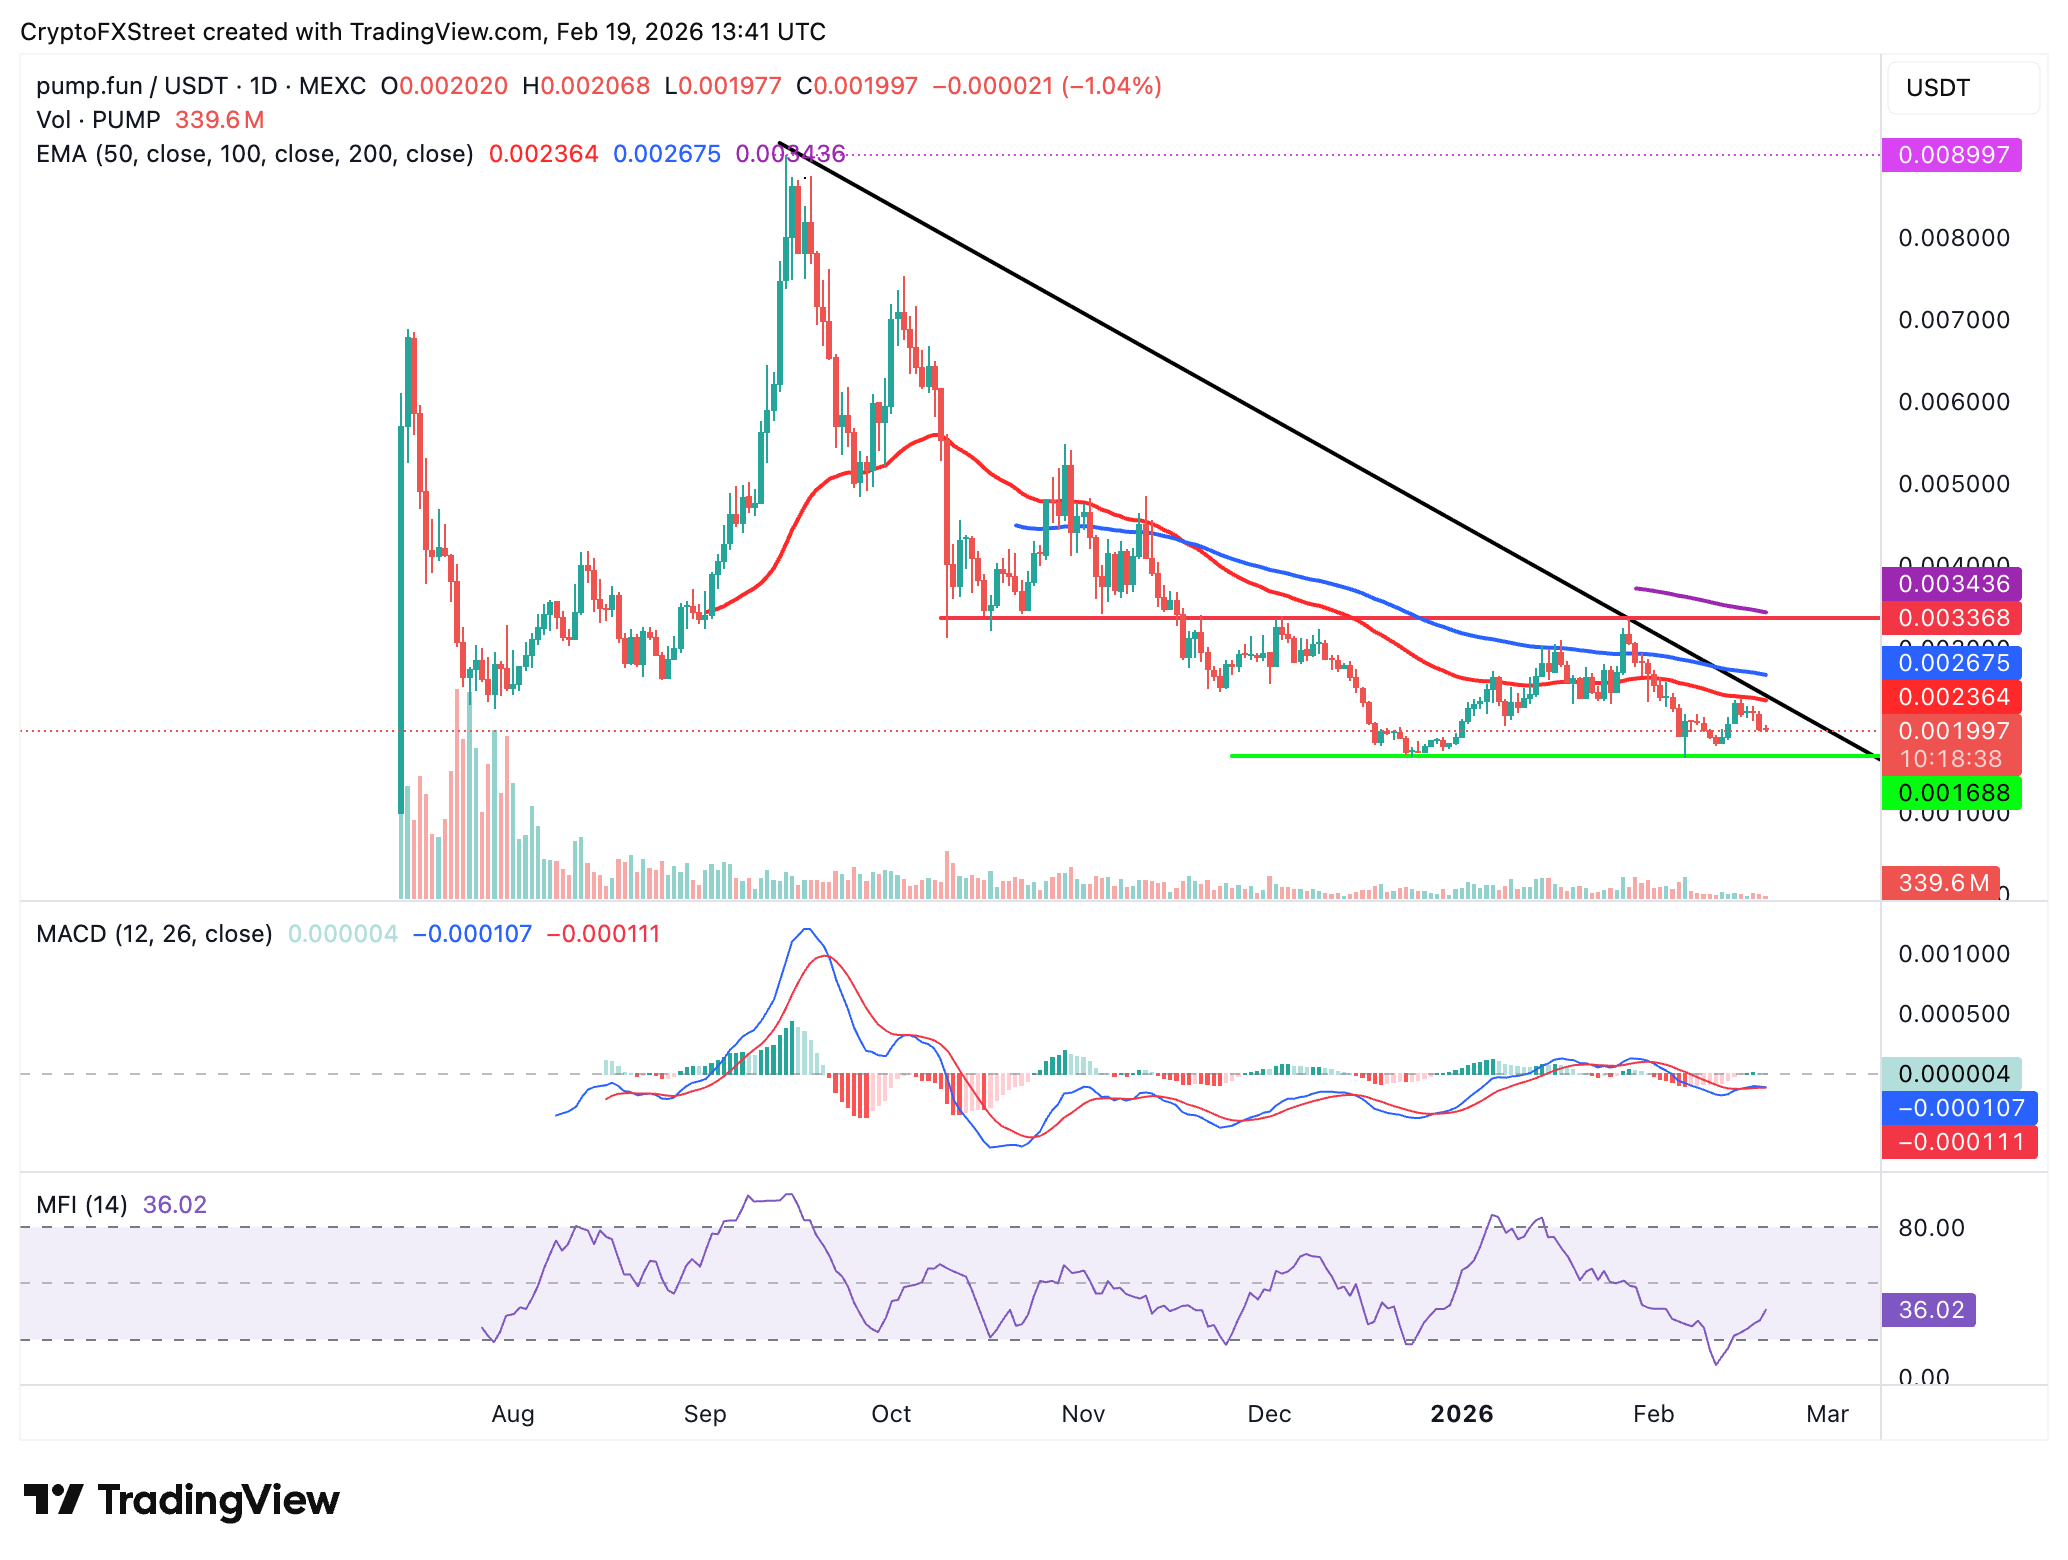
Still, the Money Flow Index (MFI), an indicator that tracks the flow of money in and out of PUMP, has risen to 36, a level that suggests bullishness is on the cards. An increase toward the midline could mark a bullish transition and set PUMP on a recovery path above the 50-day EMA and the 100-day EMA.
Cryptocurrency prices FAQs
Token launches influence demand and adoption among market participants. Listings on crypto exchanges deepen the liquidity for an asset and add new participants to an asset’s network. This is typically bullish for a digital asset.
A hack is an event in which an attacker captures a large volume of the asset from a DeFi bridge or hot wallet of an exchange or any other crypto platform via exploits, bugs or other methods. The exploiter then transfers these tokens out of the exchange platforms to ultimately sell or swap the assets for other cryptocurrencies or stablecoins. Such events often involve an en masse panic triggering a sell-off in the affected assets.
Macroeconomic events like the US Federal Reserve’s decision on interest rates influence crypto assets mainly through the direct impact they have on the US Dollar. An increase in interest rate typically negatively influences Bitcoin and altcoin prices, and vice versa. If the US Dollar index declines, risk assets and associated leverage for trading gets cheaper, in turn driving crypto prices higher.
Halvings are typically considered bullish events as they slash the block reward in half for miners, constricting the supply of the asset. At consistent demand if the supply reduces, the asset’s price climbs.

Hơn một triệu người dùng dựa vào FXStreet để có dữ liệu thị trường thời gian thực, công cụ biểu đồ, góc nhìn chuyên gia và tin tức Forex. Lịch kinh tế toàn diện và các hội thảo web giáo dục giúp nhà giao dịch luôn cập nhật và đưa ra quyết định có tính toán. FXStreet có khoảng 60 nhân sự, chia giữa trụ sở Barcelona và nhiều khu vực toàn cầu.
Đọc thêm


