
Quant Price Prediction: QNT rally nears $80, with on-chain data suggesting further upside
Bởi Vishal Dixit
Đã cập nhật: 19 Mar 2026


BÀI VIẾT PHỔ BIẾN

Quant (QNT) is up roughly 4% on Thursday, stretching a rally for the eighth consecutive day to cross above $75.
- Quant extends its recovery on Thursday for the eighth straight day, accumulating roughly 15% gains so far this week.
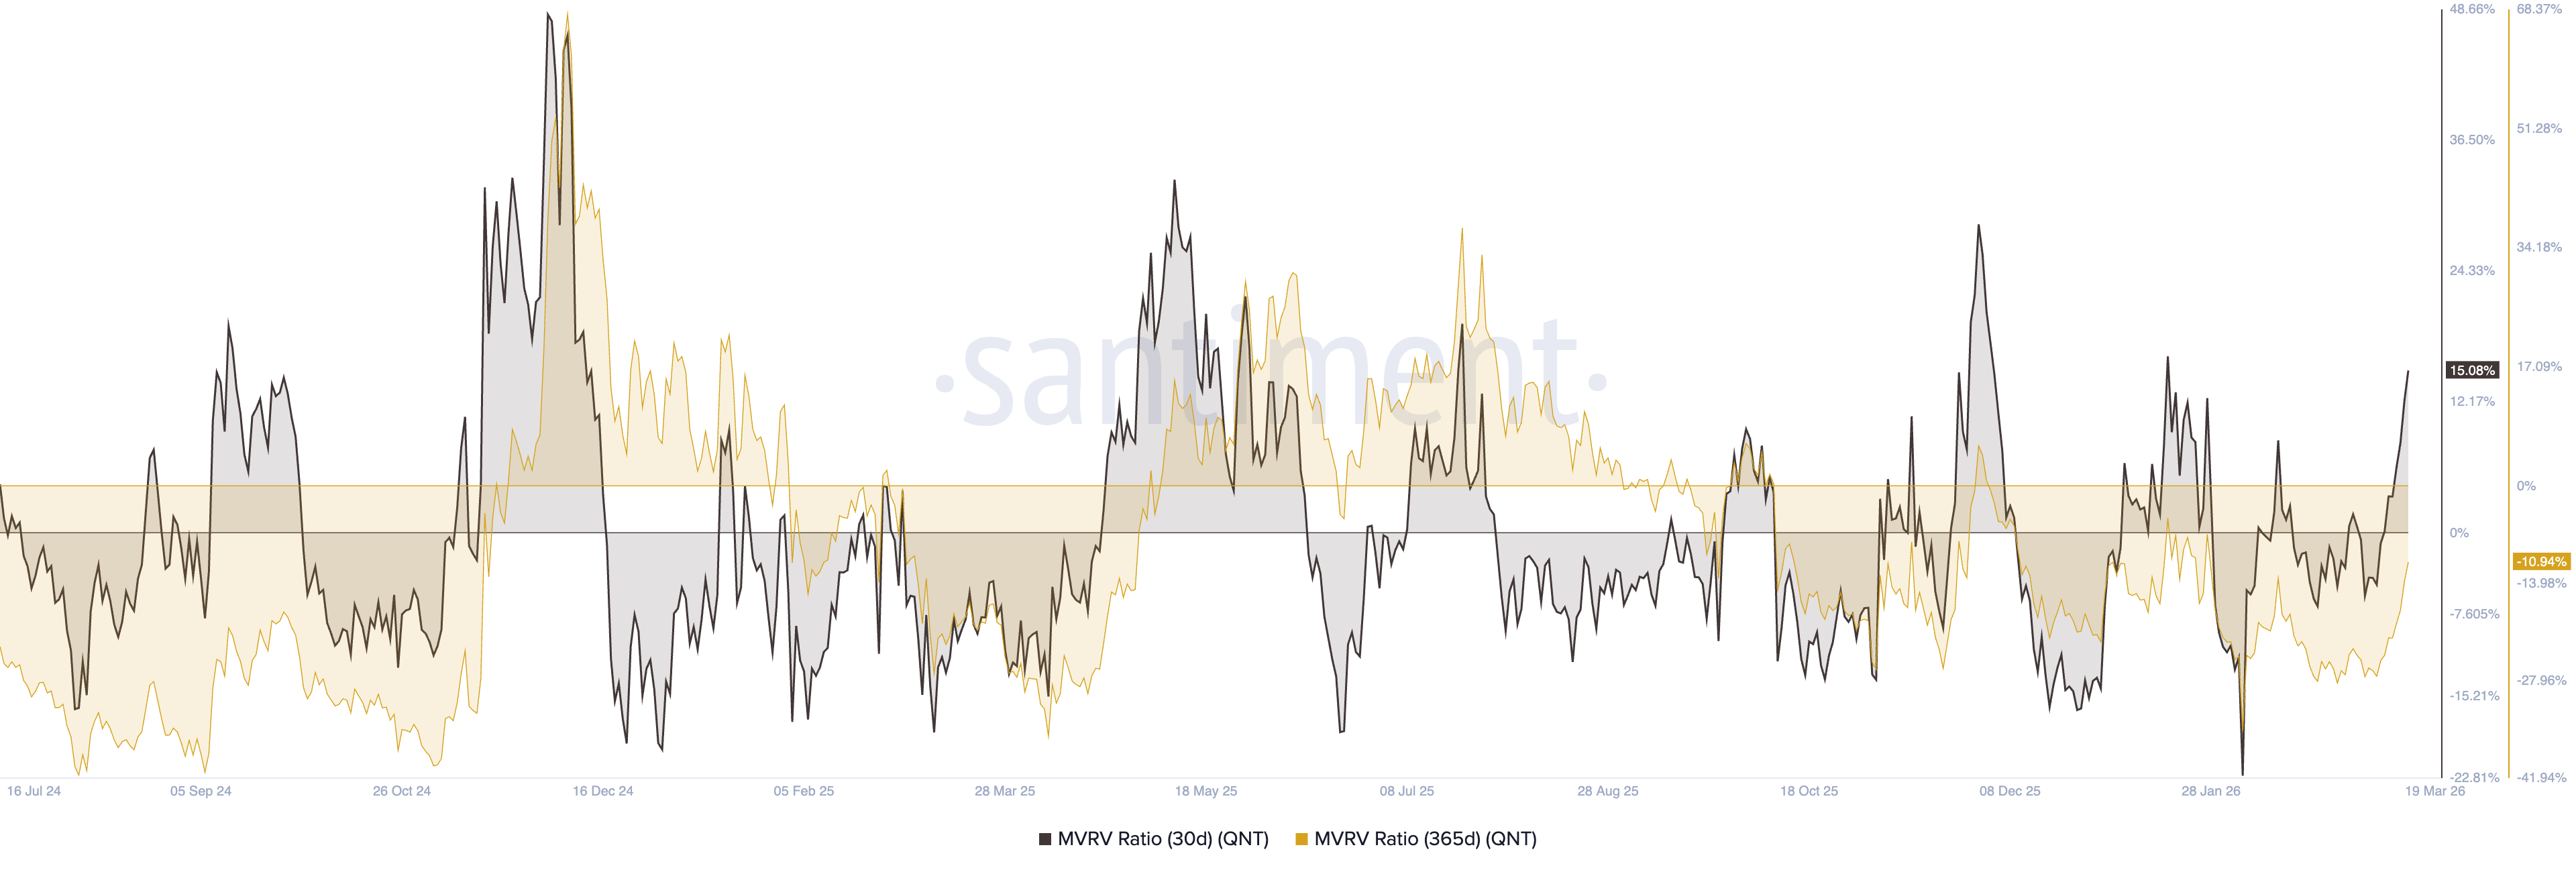
- On-chain data show the MVRV ratio over the past 365 days remains negative, suggesting further upside in the near term.
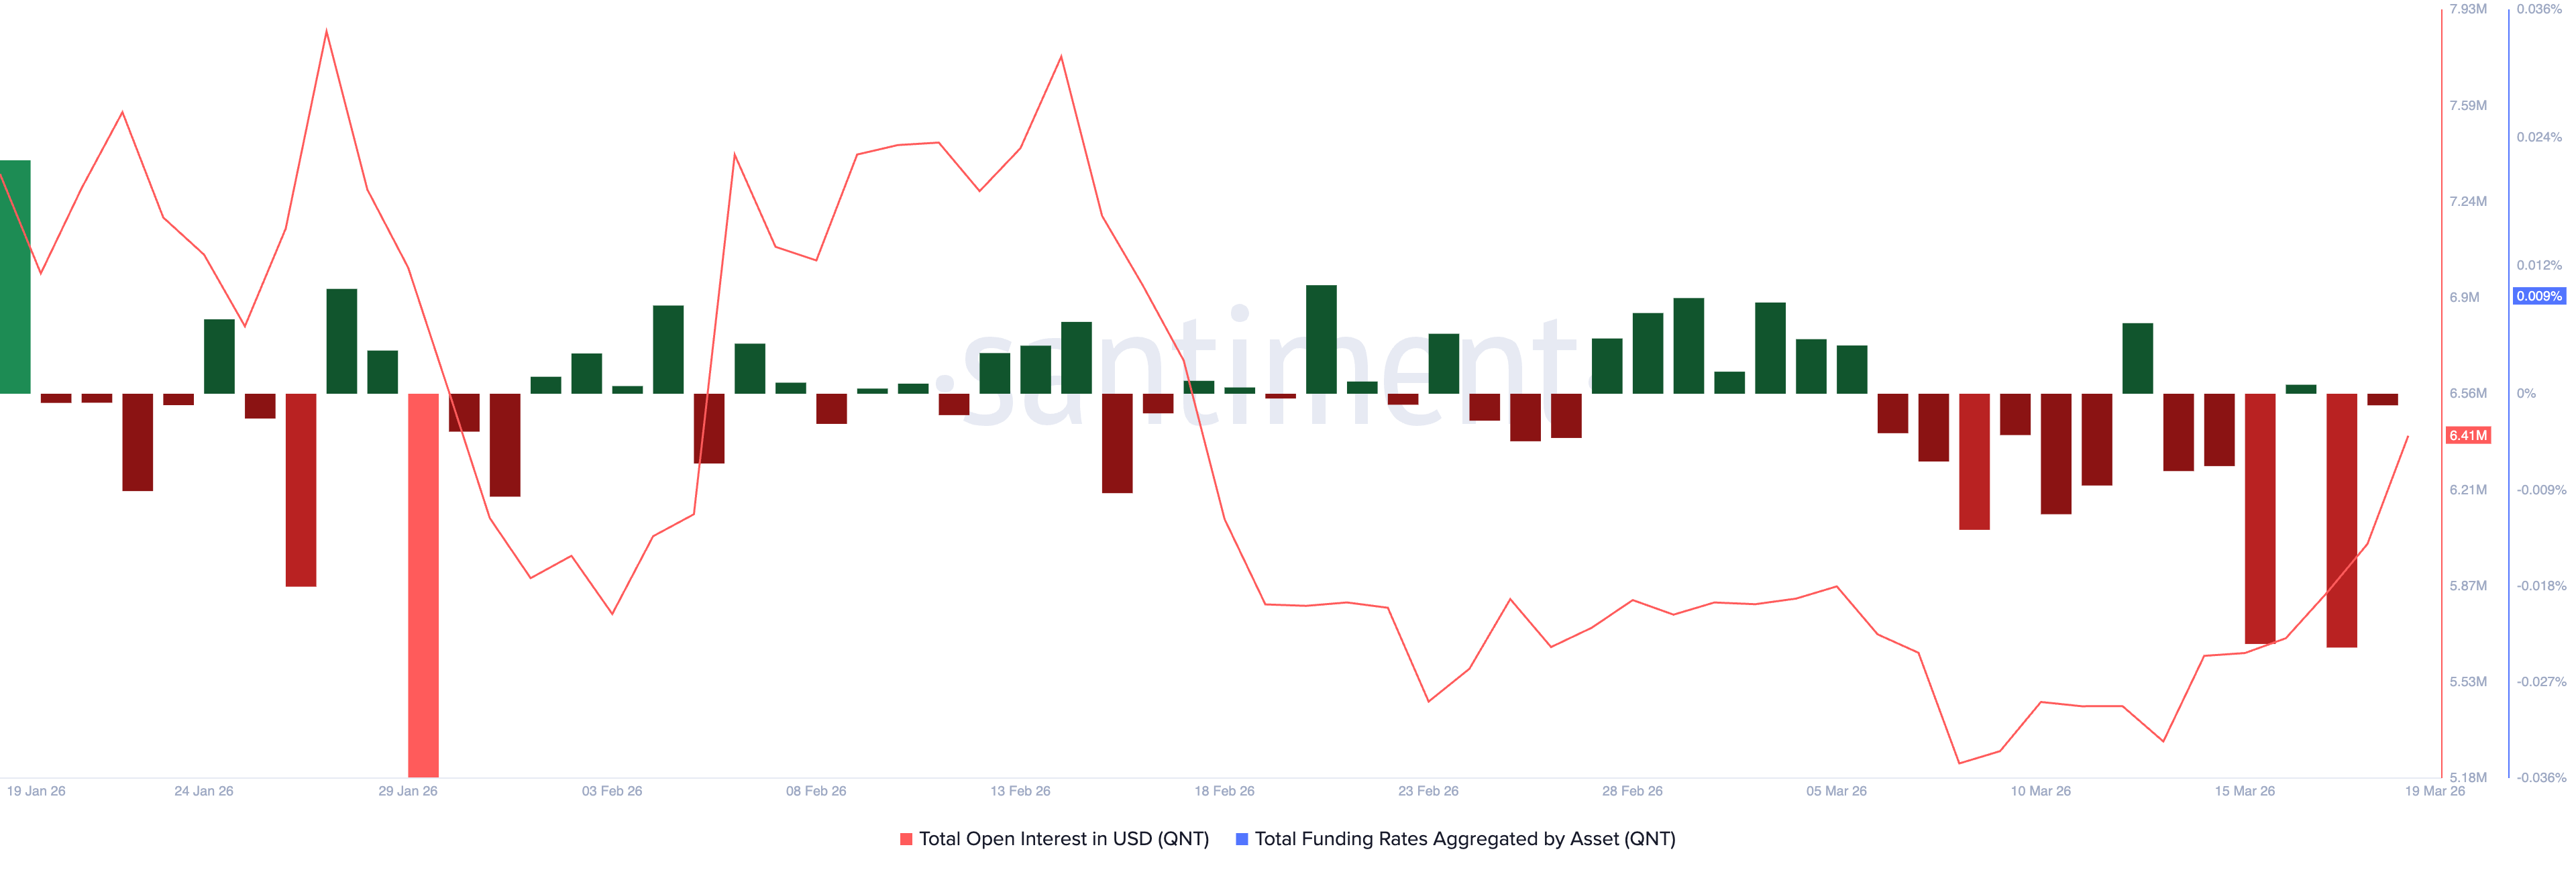
- A recovery in QNT Open Interest and the funding rate implies that investors are maintaining risk appetite.
Quant (QNT) is up roughly 4% on Thursday, stretching a rally for the eighth consecutive day to cross above $75. On-chain data signals more upside for Quant as the 365-day Market Value to Realized Value (MVRV) ratio remains negative, while the recovery in QNT futures Open Interest and funding rate reflects near-term retail support.
Renewed demand across markets signals further upside
Quant rises 20% so far this month, maintaining a steady upward trend since March 12, supported by the recent partnerships to build tokenized deposit infrastructure in Japan and the UK. The growing adoption of Quant as a network for building rails for tokenized deposits globally appears to be boosting investor confidence in the token.
On-chain data backs the thesis of further upside in QNT prices. According to Santiment, the MVRV ratio over the last 365 days is -10.94%, indicating there is still a lot of room to cover before breakeven for medium to long-term holders, as this metric below 0% suggests most investors are, on average, in unrealized losses.
However, the previous two breakevens in December and October led to a quick profit-taking phase, suggesting that an MVRV above 0% could signal a top in Quant’s rally.
QNT futures Open Interest (OI) rose slightly to $6.41 million from $6.02 million on Wednesday. Meanwhile, the funding rate has improved to -0.004% from -0.0163% the previous day, suggesting reduced bearish interest among traders.
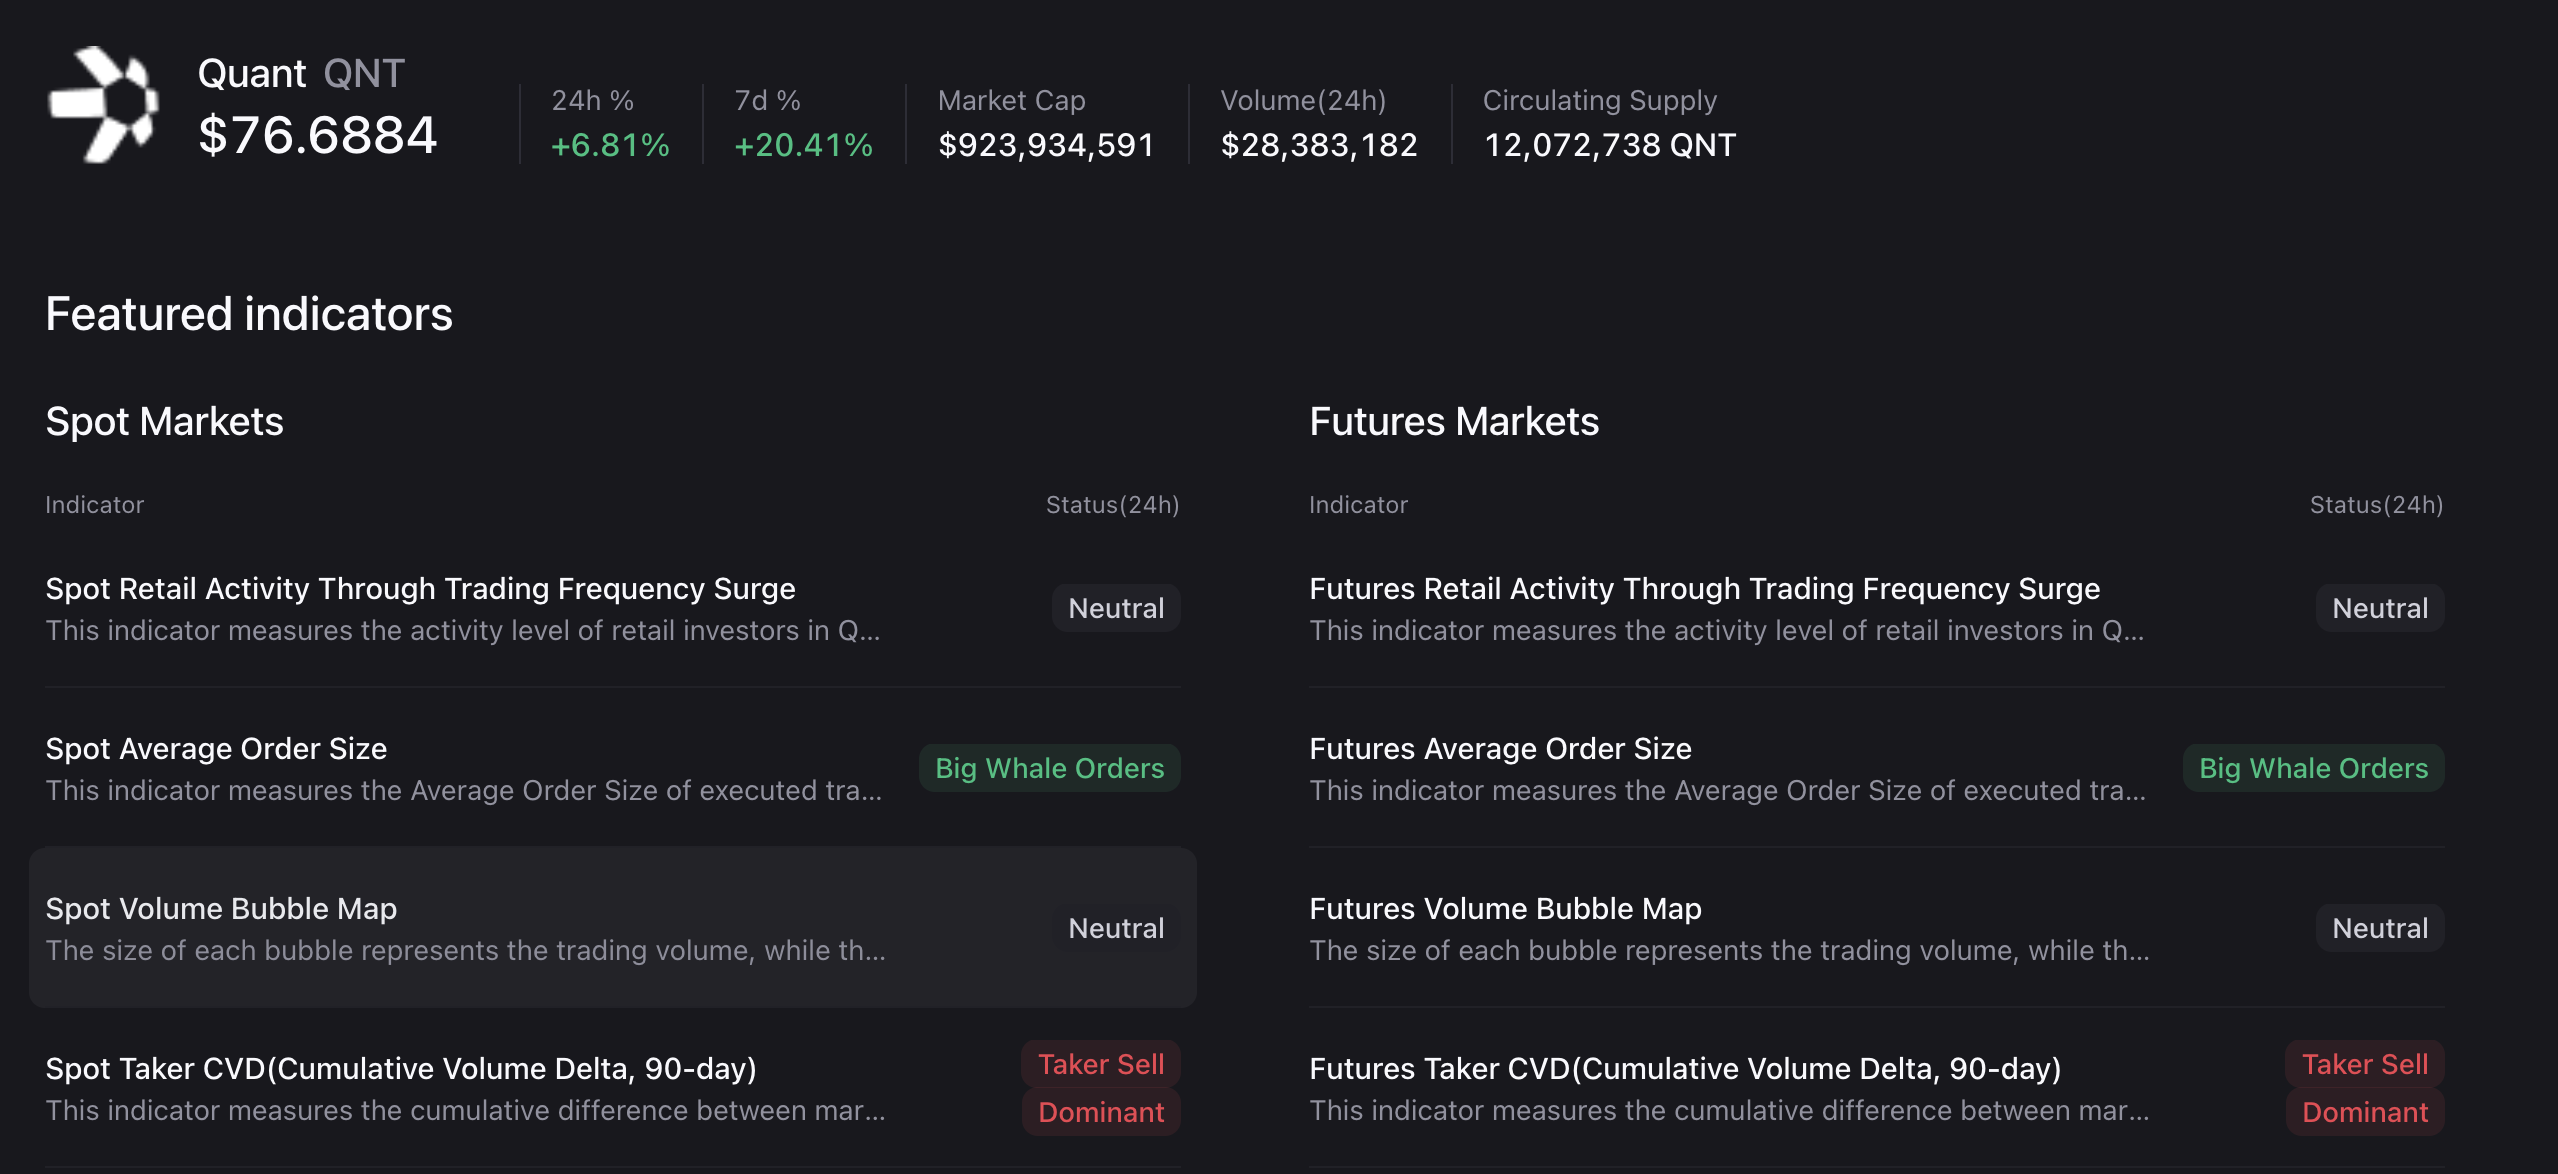
CryptoQuant data shows an increase in the average size of executed orders across spot and futures markets, suggesting strong interest from large wallet investors, commonly called whales.
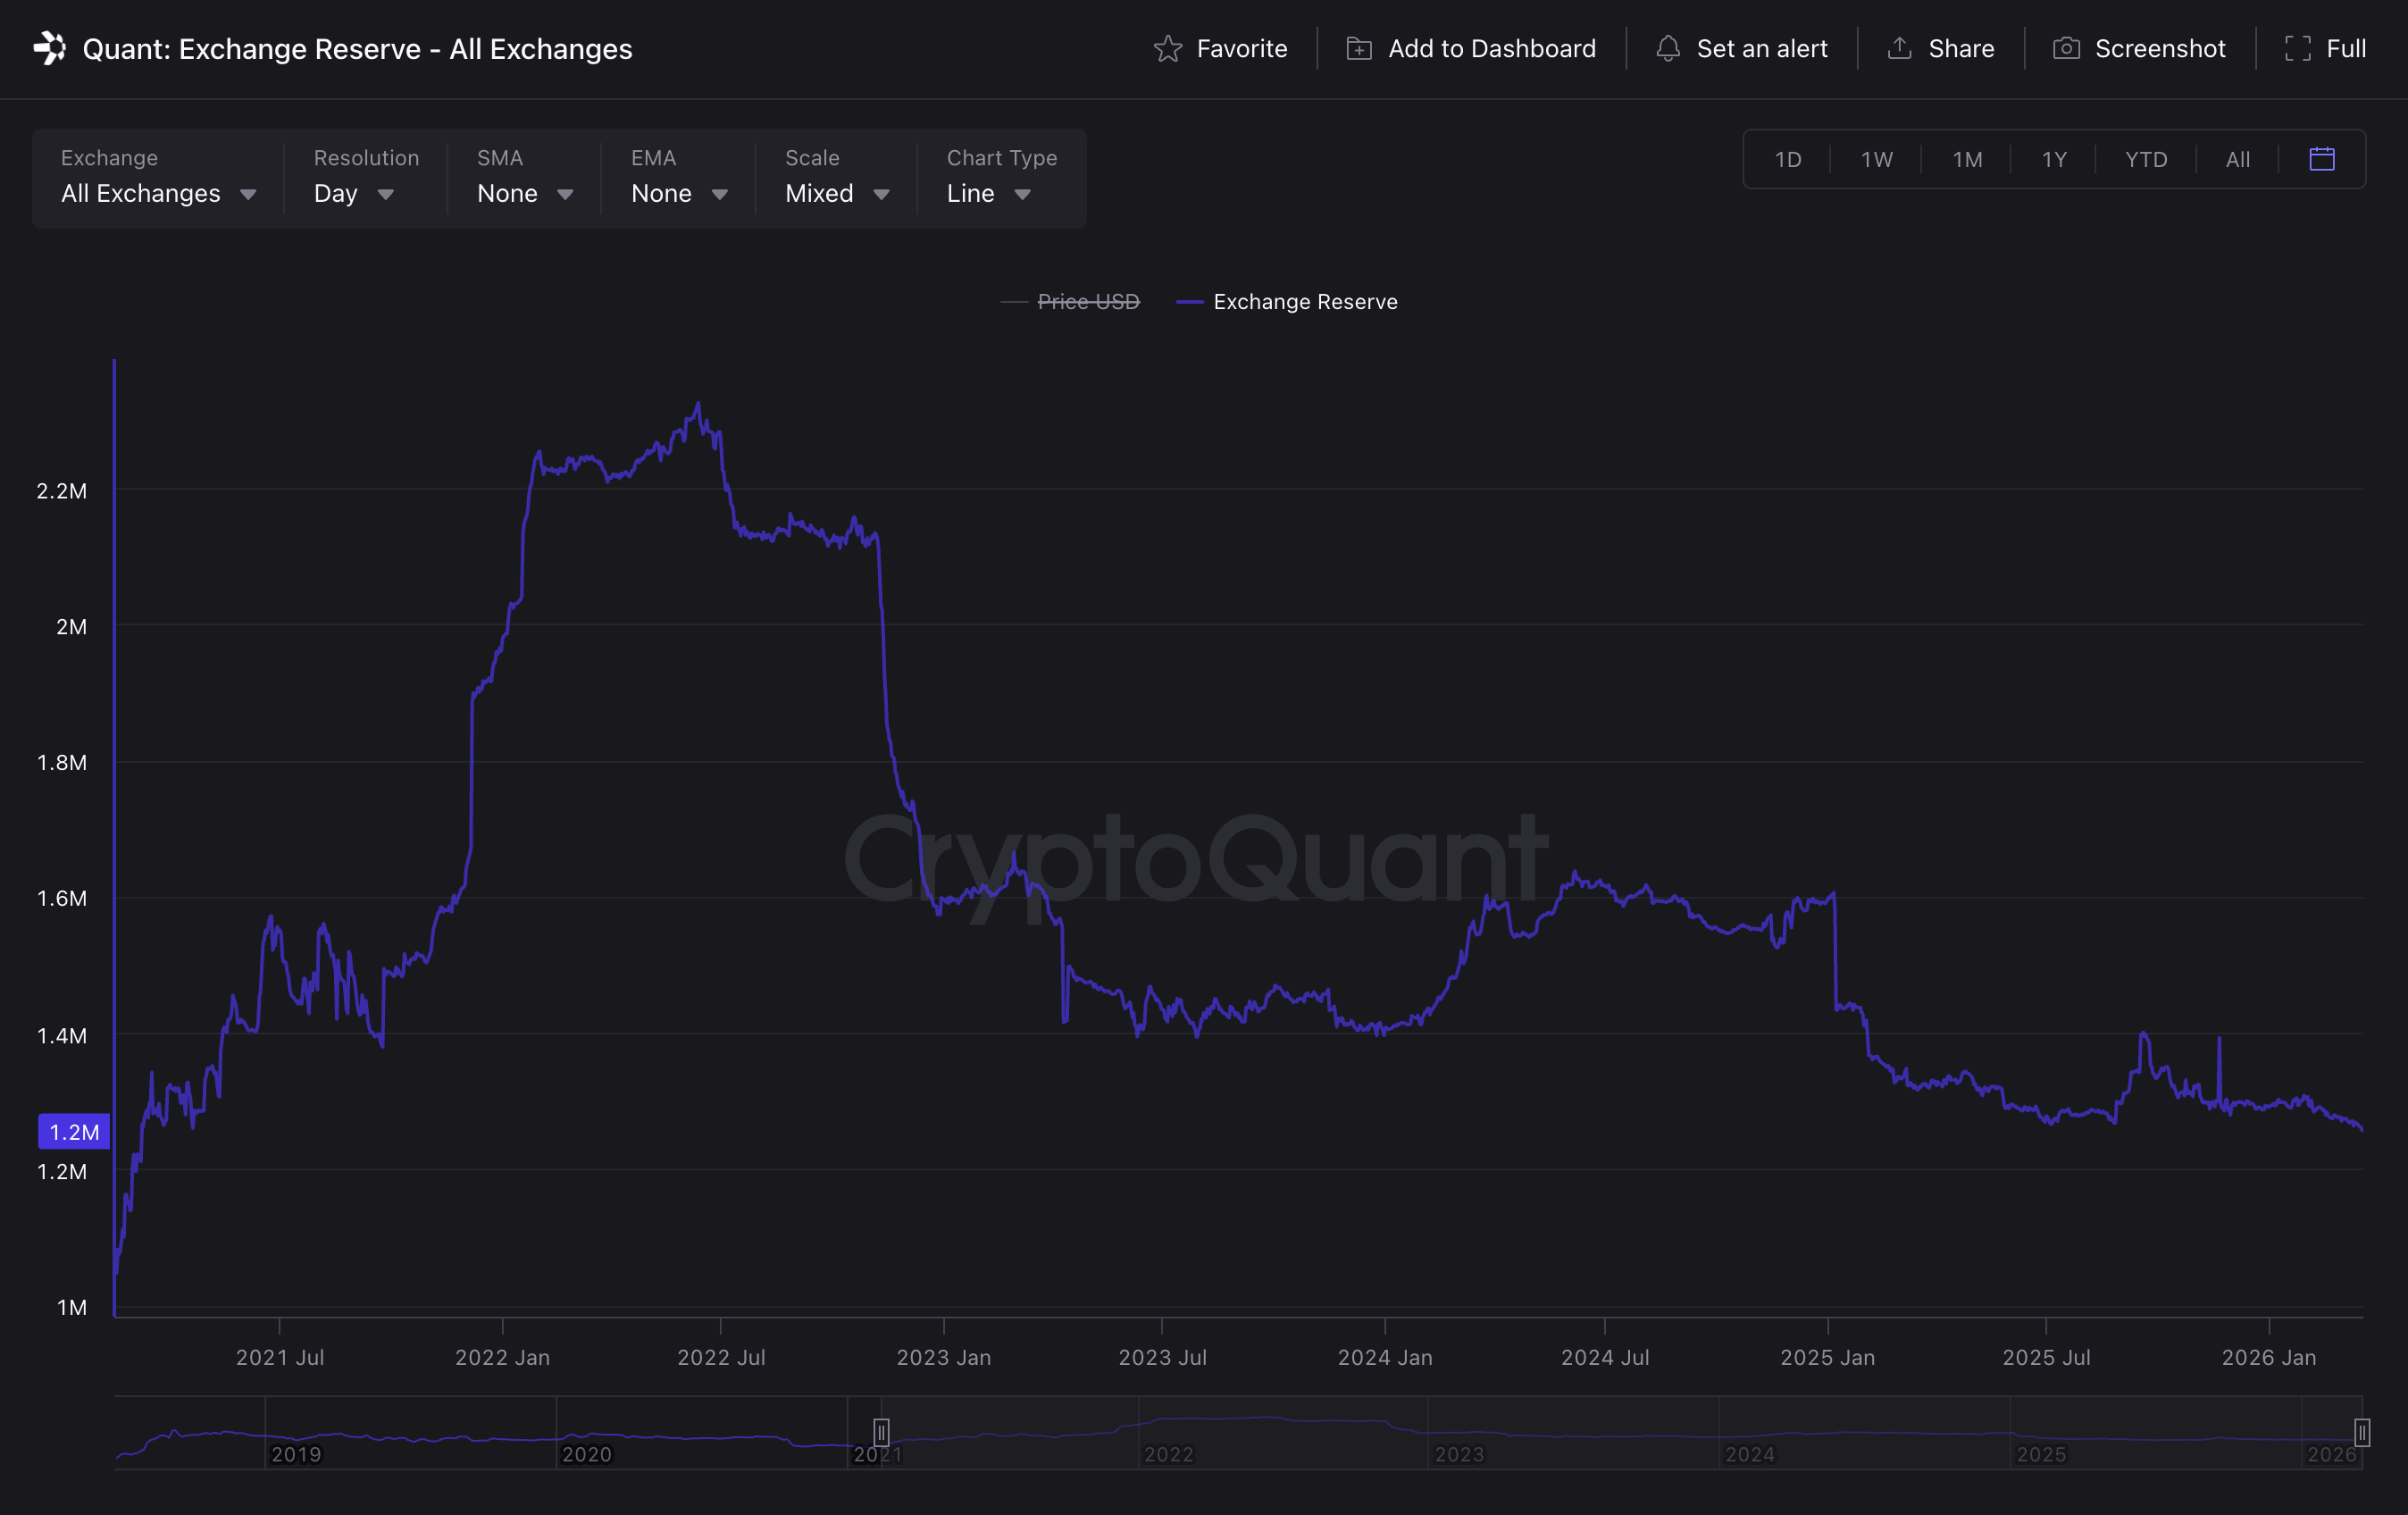
Additionally, the QNT supply available on exchanges has fallen to 1.2 million tokens, approaching levels not seen since April 2021. Reduced downside pressure due to depleting QNT supply on exchanges amid steady demand from medium- and long-term holders across spot and futures markets creates bullish conditions.
Technical outlook: Will Quant price hit $100?
Quant rally holds above the 50-day and 100-day EMAs but faces headwinds near the 200-day EMA at $78.22, indicating an early recovery within a broader downtrend.
The token is approaching a key resistance level near $80, which could signal either a breakout or a reversal: a decisive close above this moving average could extend the rally to $86.67, a swing high in mid-January which was capped by the 200-day EMA.
The Moving Average Convergence Divergence (MACD) line is above its signal line and has decisively moved into positive territory, with an expanding histogram suggesting a boost in bullish momentum. The Relative Strength Index (RSI) at 71 signals overbought conditions but still points upwards. That said, the recent behaviour of the momentum indicator also suggests that the overheated rally could be overstretching.
Looking down, the 100-day and 50-day EMAs at $72.25 and $68.24, respectively, could serve as support bands to absorb short-term corrections.
(The technical analysis of this story was written with the help of an AI tool.)

Hơn một triệu người dùng dựa vào FXStreet để có dữ liệu thị trường thời gian thực, công cụ biểu đồ, góc nhìn chuyên gia và tin tức Forex. Lịch kinh tế toàn diện và các hội thảo web giáo dục giúp nhà giao dịch luôn cập nhật và đưa ra quyết định có tính toán. FXStreet có khoảng 60 nhân sự, chia giữa trụ sở Barcelona và nhiều khu vực toàn cầu.
Đọc thêm


