
Ripple Price Forecast: XRP bearish outlook holds despite ETF inflows, falling exchange reserves
Bởi John Isige
Đã cập nhật: 22 May 2026


BÀI VIẾT PHỔ BIẾN

Ripple (XRP) is trending lower toward the key $1.35 support level at the time of writing on Friday, following a failed attempt to break above $1.39 the previous day.
- XRP remains below major averages, as pressure mounts on $1.35 short-term support.
- XRP reserves on the Binance exchange drop to 2.74 billion tokens on Thursday after peaking at 2.78 billion tokens in May.
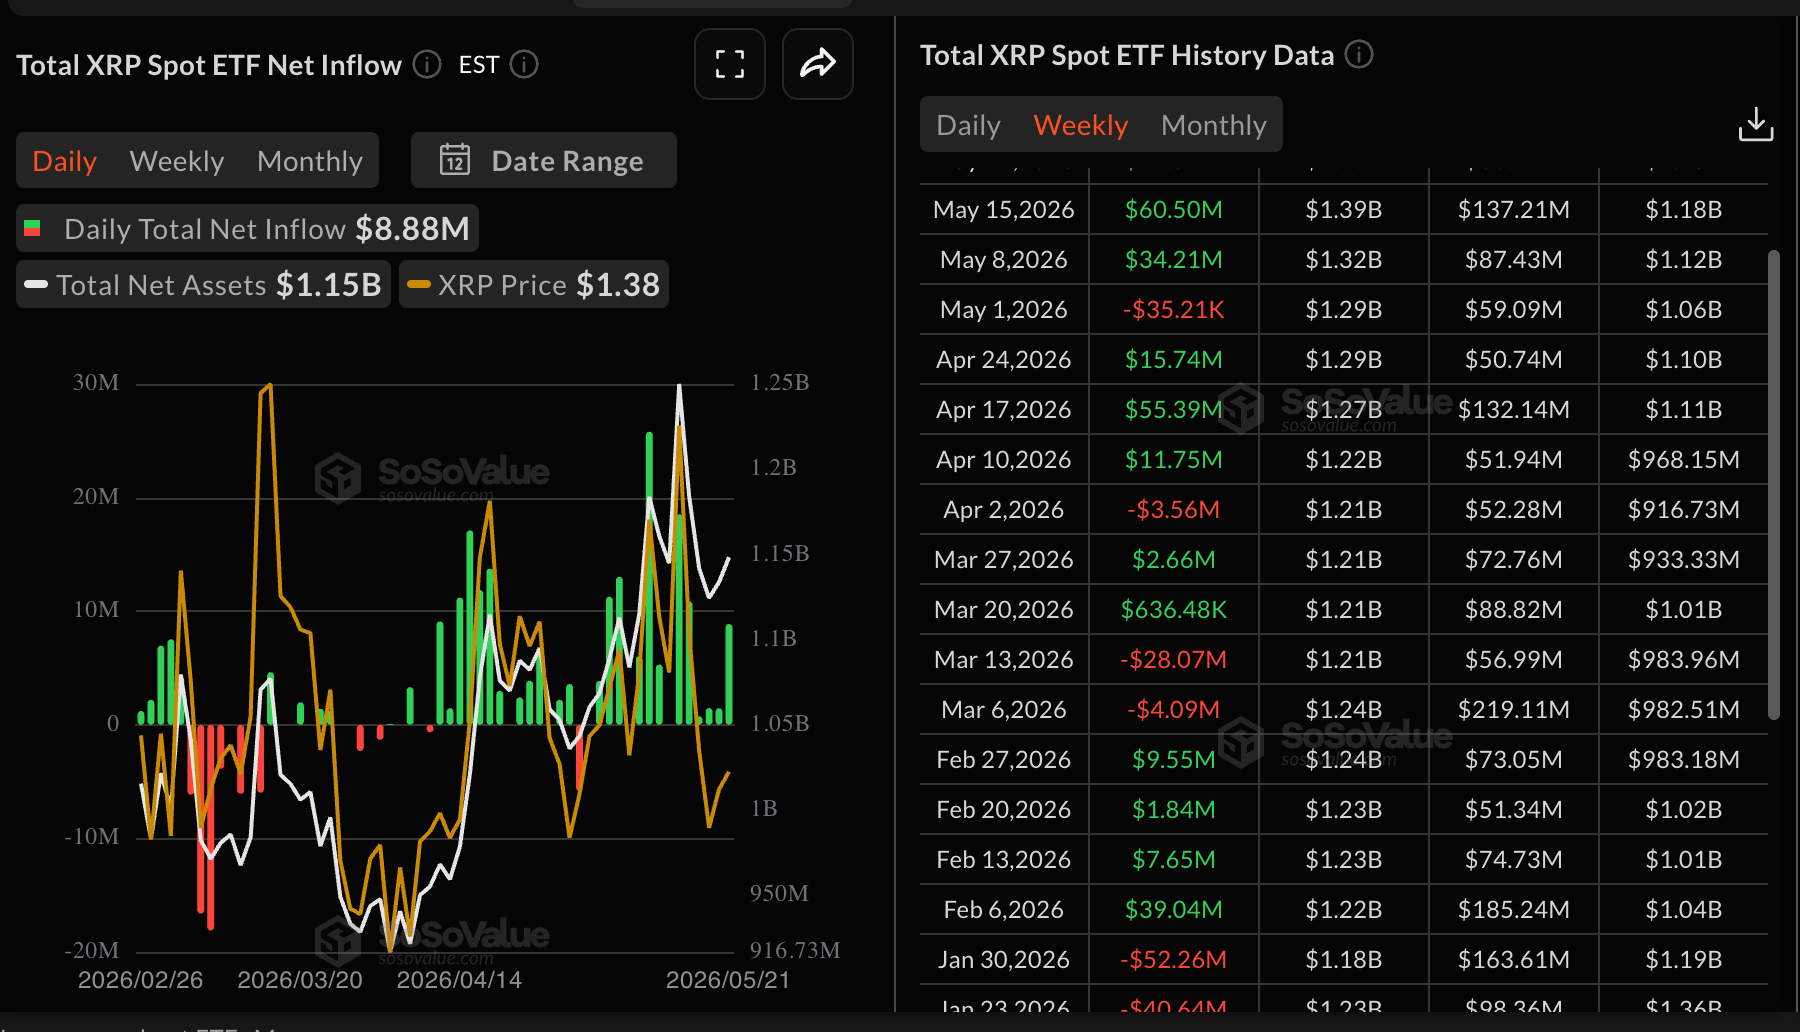
- XRP ETFs post steady inflows totaling $12.57 million this week through Thursday but fail to lift price outlook.
Ripple (XRP) is trending lower toward the key $1.35 support level at the time of writing on Friday, following a failed attempt to break above $1.39 the previous day. Despite the dominant pressure, capital inflows continue through related digital investment products while investors appear intent on withdrawing their holdings from exchanges.
XRP ETF inflows stand out amid fading exchange reserves
Institutional interest in XRP has remained mild but steady this week, with total inflows into spot Exchange-Traded Funds (ETFs) averaging $12.57 million through Thursday. This marks the third consecutive week of inflows, reinforcing steady demand for US-listed XRP investment products. Meanwhile, Cumulative inflows stand at $1.39 billion, with net assets under management averaging $1.15 billion.
XRP holders, on the other hand, are increasingly withdrawing their assets from exchanges, as evidenced by the token’s balance on Binance falling to 2.74 billion on Thursday, from a May high of 2.78 billion. A decline in exchange reserves is typically viewed as bullish, since it limits the circulating supply available for sale and often indicates that investors are opting to hold XRP rather than trade it.
Price analysis: XRP holds key support
XRP trades at $1.36, maintaining a bearish near-term bias as price holds beneath the cluster of key moving averages. The 50-day Exponential Moving Average (EMA) at $1.41, the 100-day EMA at $1.48 and the 200-day EMA at $1.70 all sit overhead, suggesting rallies are likely to be capped while the pair trades below these trend barriers.
The Relative Strength Index (RSI) near 42 on the daily chart hints at lingering downside pressure without yet reaching oversold conditions. At the same time, the Moving Average Convergence Divergence (MACD) histogram remains below zero on the same chart, and its recent deterioration suggests momentum continues to favor sellers in the short term.
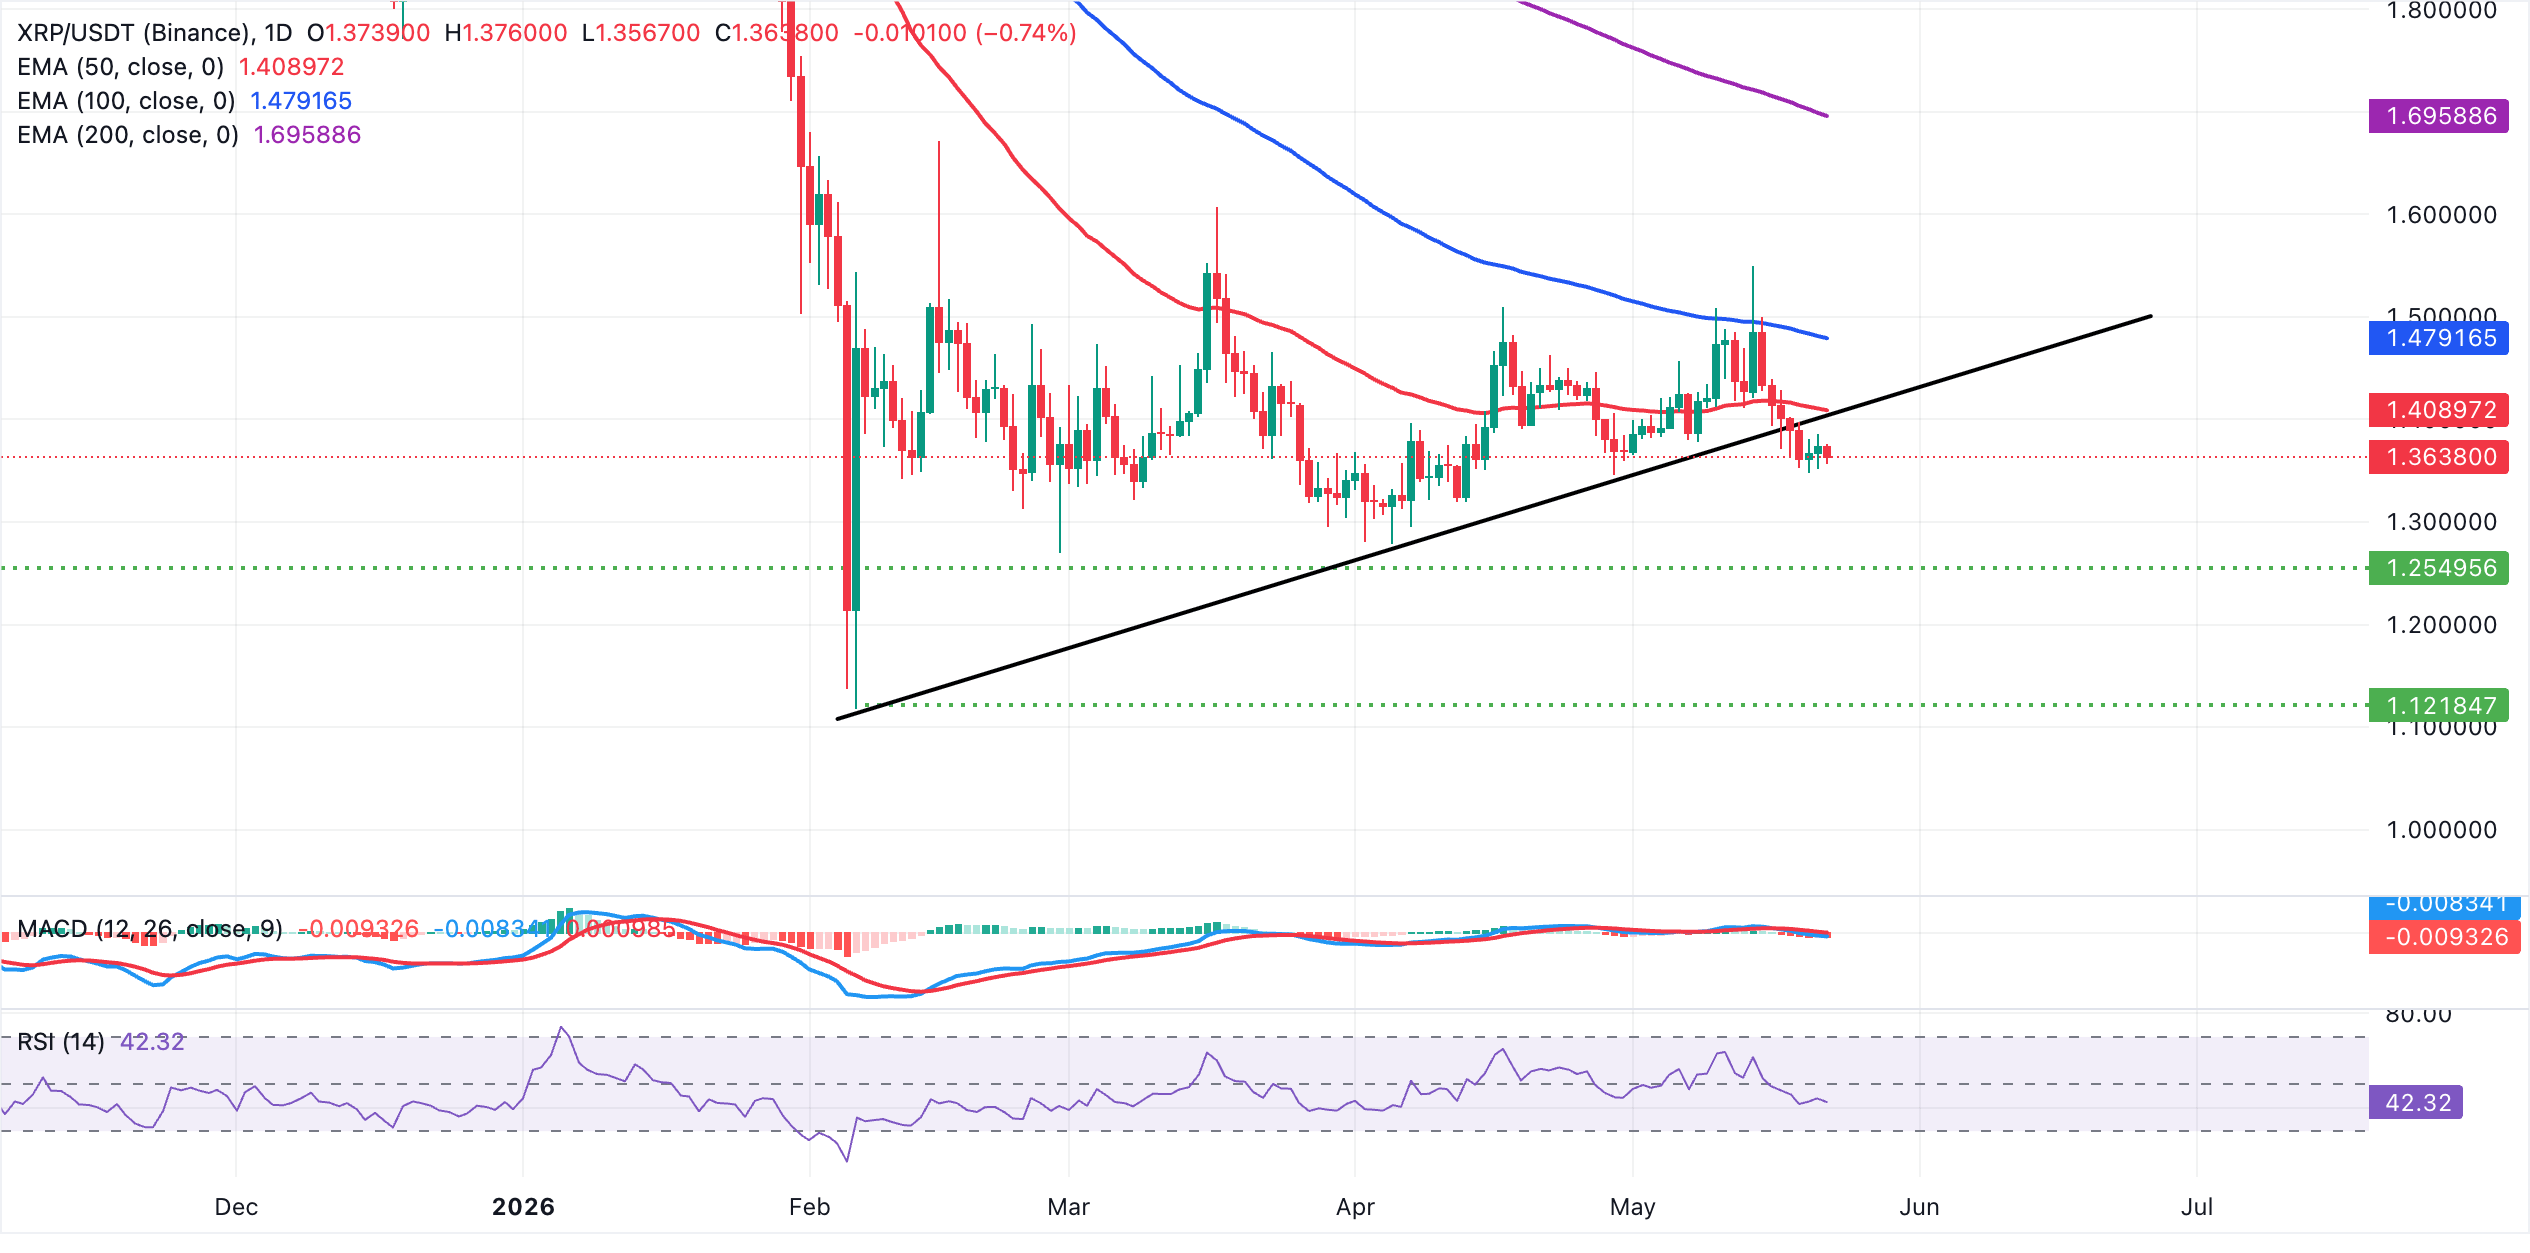
On the topside, immediate resistance lies at the former rising trendline around $1.41, coinciding with the 50-day EMA. Above that, the 100-day EMA at $1.48 marks the next significant barrier before the longer-term bearish cap at the 200-day EMA near $1.70. If XRP extends its decline below the near-term $1.35 support, the next key demand area lies at $1.30, where buyers could seek lower entries.
(The technical analysis of this story was written with the help of an AI tool.)
Cryptocurrency metrics FAQs
The developer or creator of each cryptocurrency decides on the total number of tokens that can be minted or issued. Only a certain number of these assets can be minted by mining, staking or other mechanisms. This is defined by the algorithm of the underlying blockchain technology. On the other hand, circulating supply can also be decreased via actions such as burning tokens, or mistakenly sending assets to addresses of other incompatible blockchains.
Market capitalization is the result of multiplying the circulating supply of a certain asset by the asset’s current market value.
Trading volume refers to the total number of tokens for a specific asset that has been transacted or exchanged between buyers and sellers within set trading hours, for example, 24 hours. It is used to gauge market sentiment, this metric combines all volumes on centralized exchanges and decentralized exchanges. Increasing trading volume often denotes the demand for a certain asset as more people are buying and selling the cryptocurrency.
Funding rates are a concept designed to encourage traders to take positions and ensure perpetual contract prices match spot markets. It defines a mechanism by exchanges to ensure that future prices and index prices periodic payments regularly converge. When the funding rate is positive, the price of the perpetual contract is higher than the mark price. This means traders who are bullish and have opened long positions pay traders who are in short positions. On the other hand, a negative funding rate means perpetual prices are below the mark price, and hence traders with short positions pay traders who have opened long positions.

Hơn một triệu người dùng dựa vào FXStreet để có dữ liệu thị trường thời gian thực, công cụ biểu đồ, góc nhìn chuyên gia và tin tức Forex. Lịch kinh tế toàn diện và các hội thảo web giáo dục giúp nhà giao dịch luôn cập nhật và đưa ra quyết định có tính toán. FXStreet có khoảng 60 nhân sự, chia giữa trụ sở Barcelona và nhiều khu vực toàn cầu.
Đọc thêm


