
XRP struggles around $1.40 despite institutional inflows
Bởi John Isige
Ngày xuất bản: 9 Feb 2026 | Ngày chỉnh sửa: 9 Feb 2026


BÀI VIẾT PHỔ BIẾN

Ripple (XRP) is extending its intraday decline to around $1.40 at the time of writing on Monday amid growing pressure from the retail market and risk-off sentiment that continues to keep investors on the sidelines.
- XRP resumes its downtrend, trading around $1.40 amid risk-off sentiment weighing on the broader cryptocurrency market.
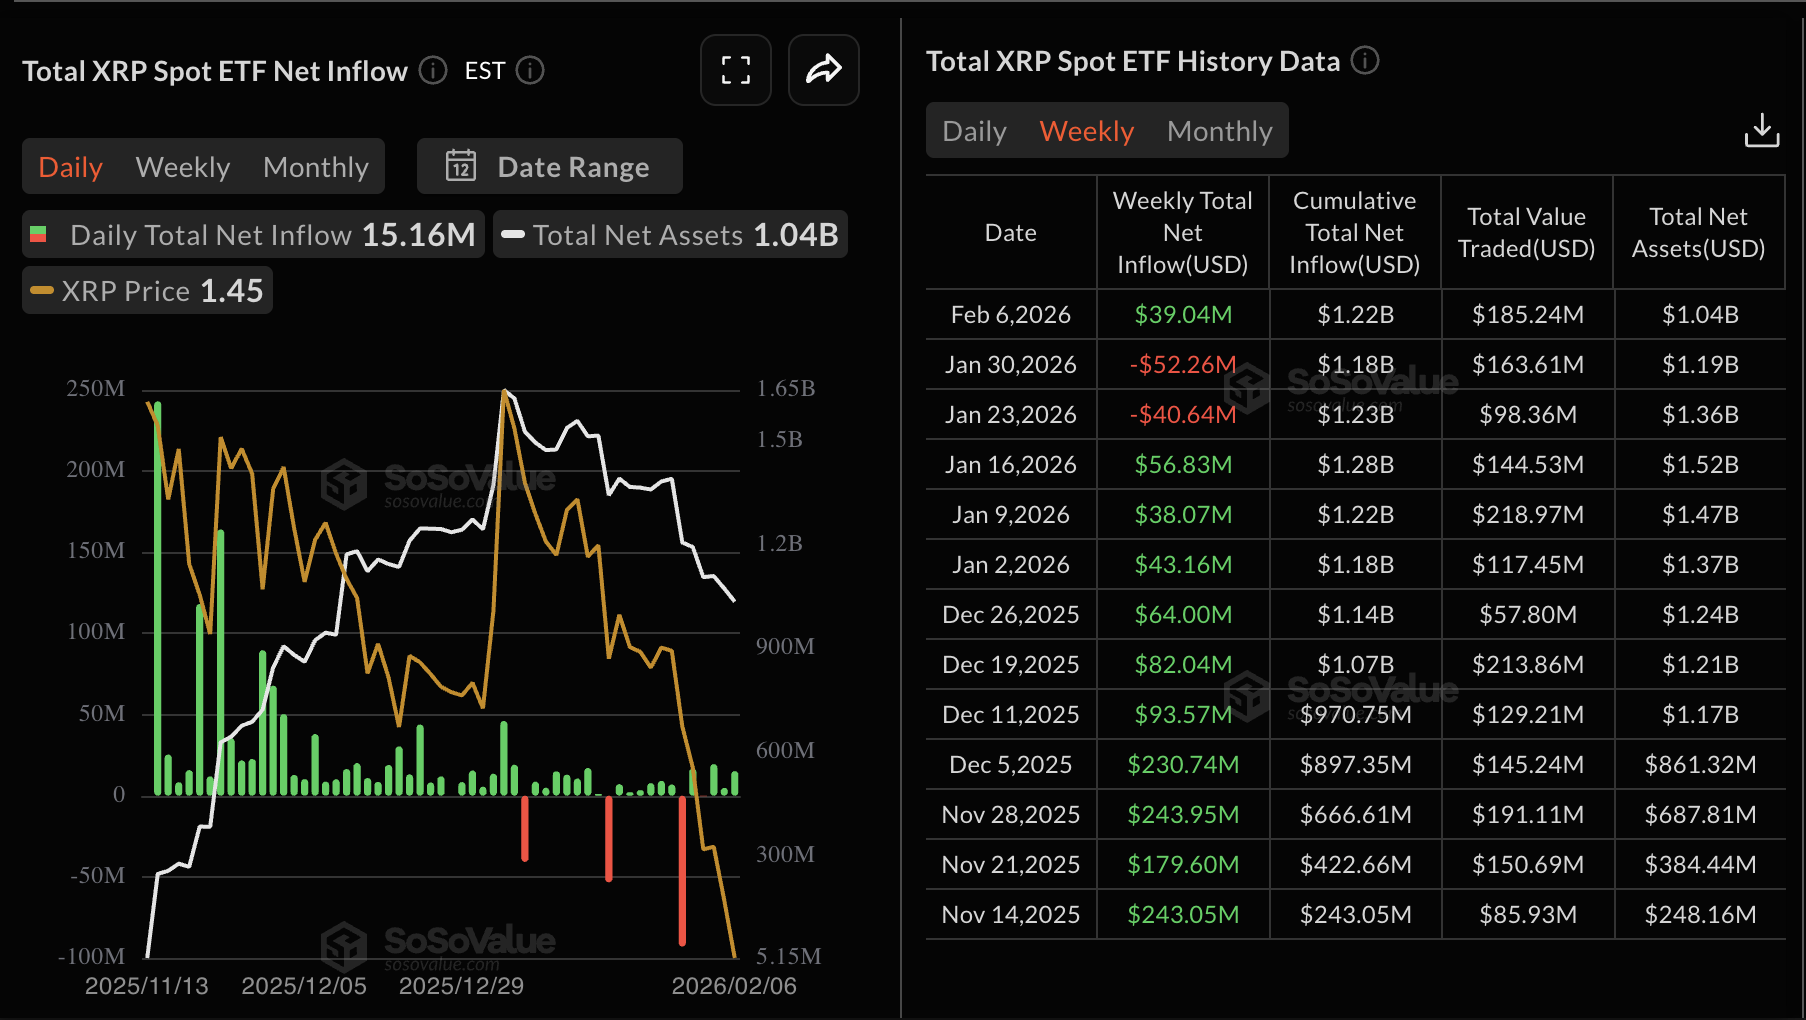
- XRP-related investment products recorded $63.1 million weekly inflows last week, with spot ETFs accounting for $39 million on Friday.
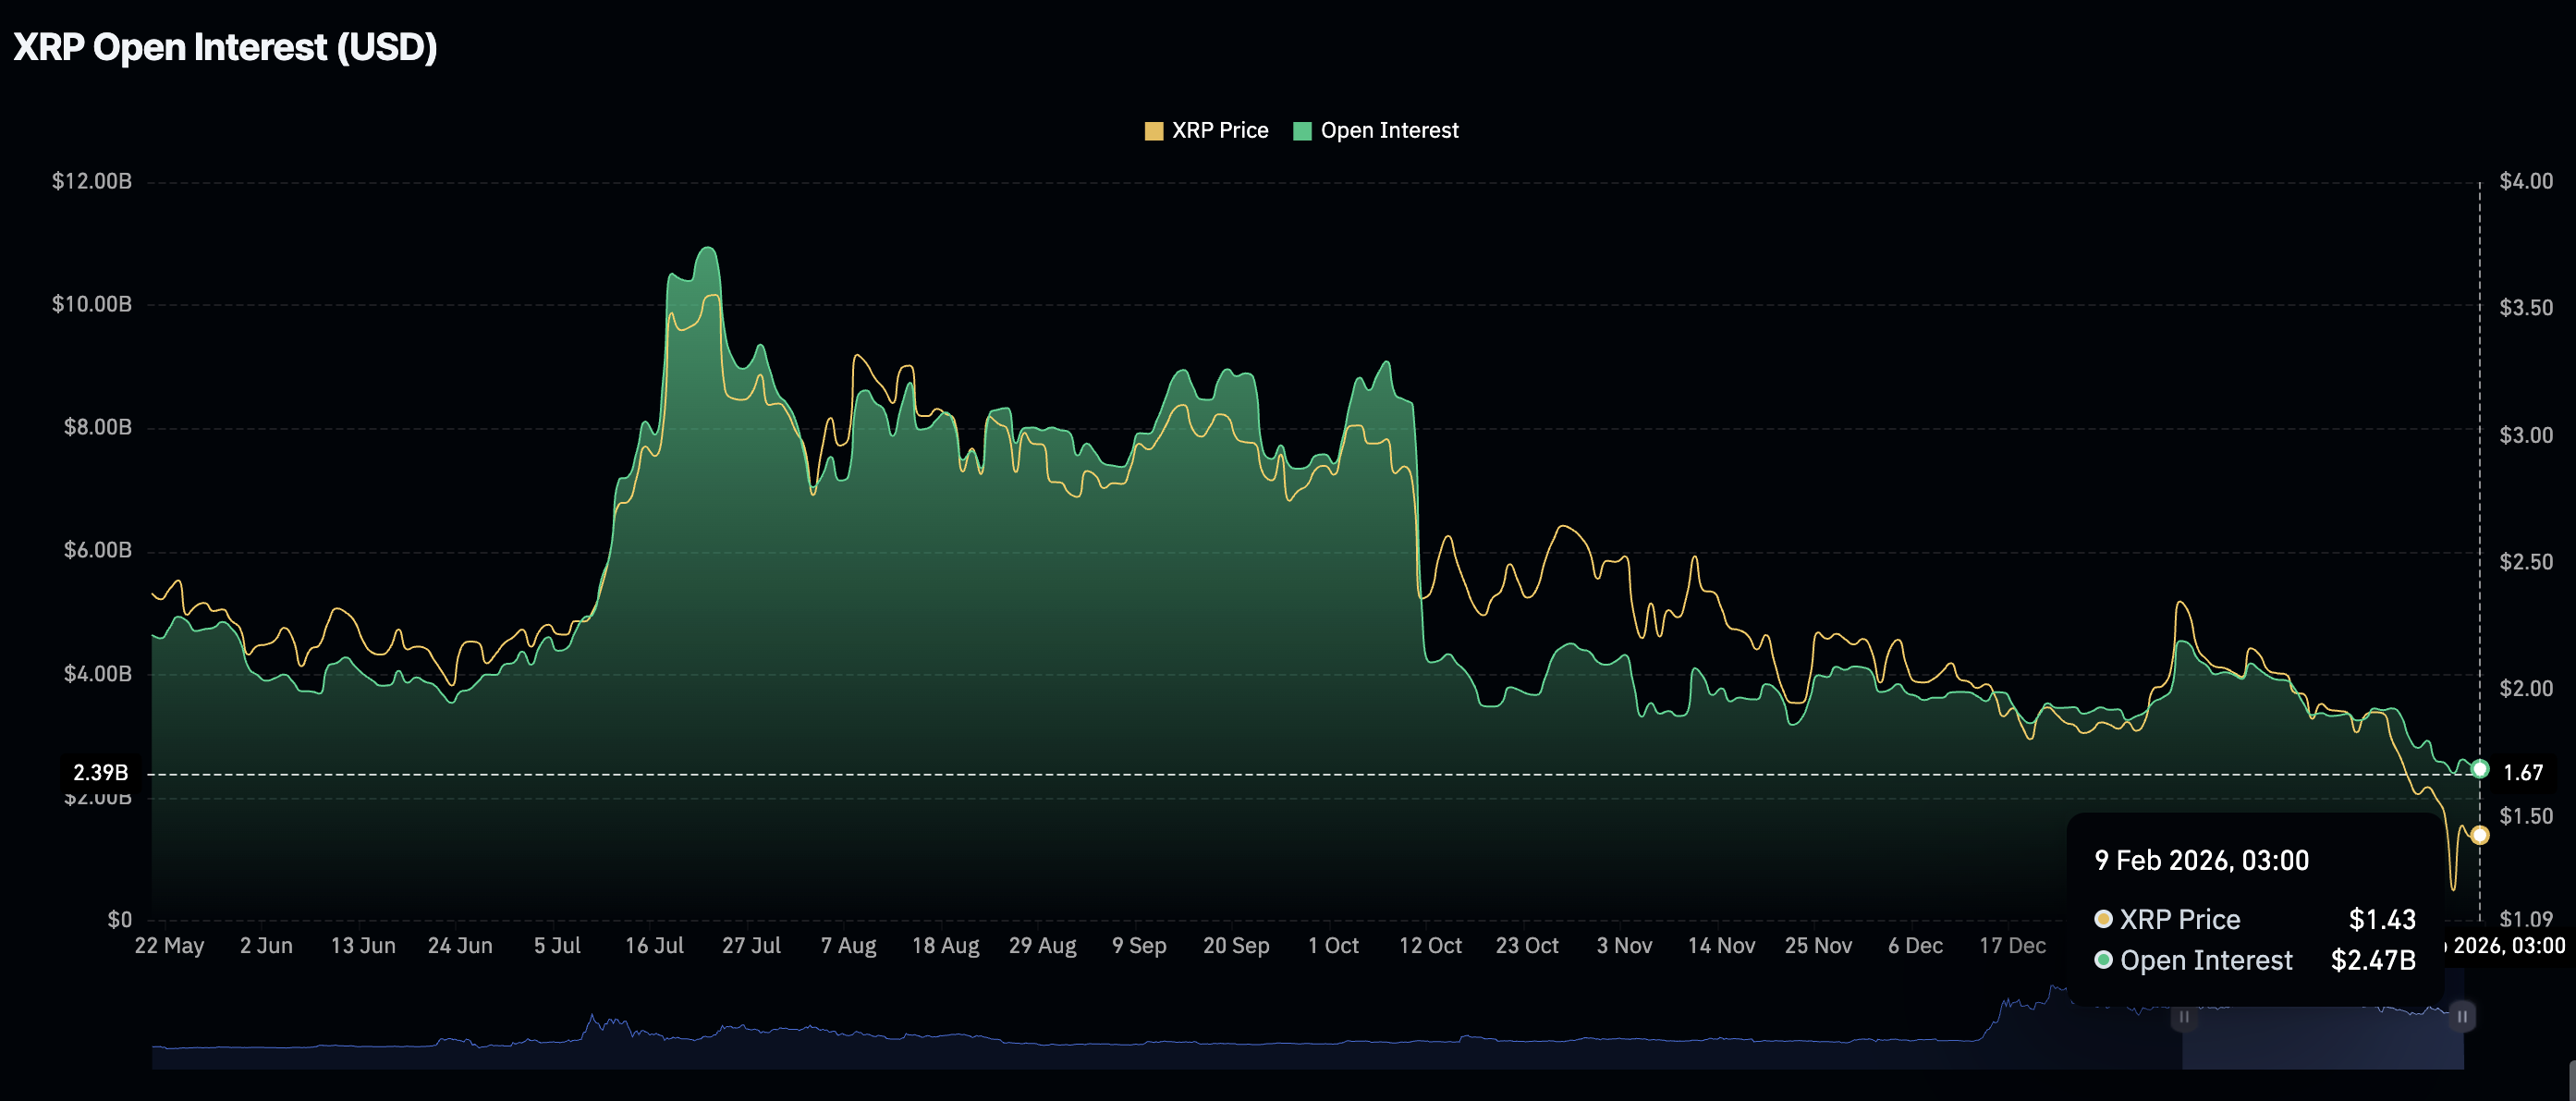
- The XRP derivatives market remains fragile, with futures Open Interest falling to $2.47 billion.
Ripple (XRP) is extending its intraday decline to around $1.40 at the time of writing on Monday amid growing pressure from the retail market and risk-off sentiment that continues to keep investors on the sidelines.
Following last week’s turbulence, XRP hit a yearly low at $1.12 on Friday but quickly rebounded to $1.54. A brief consolidation followed amid price fluctuations around the $1.40 psychological threshold.
XRP wobbles as institutional and retail interest clash
XRP continues to attract institutional investors, with total inflows into related financial products averaging $63.1 million last week, according to CoinShares data. Outflows generally slowed, signalling a potential inflection point.
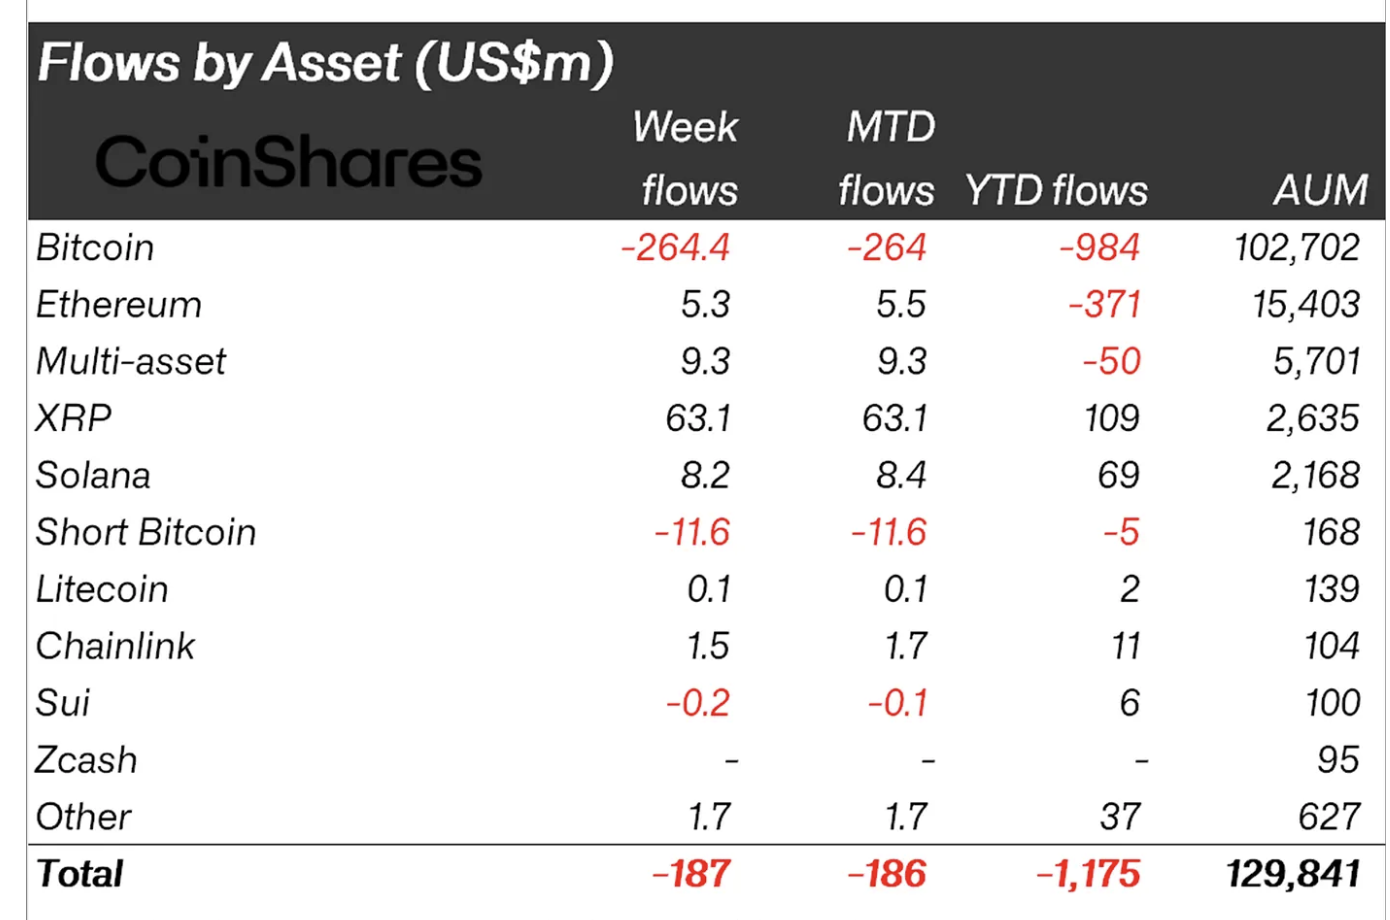
Inflows into US-listed spot Exchange-Traded Funds (ETFs) totaled $39 million through the week, accounting for the lion’s share of the aforementioned $63.1 million. The cumulative inflow into XRP ETFs stands at $1.22 billion, with net assets under management at $1.04 billion.
Meanwhile, the XRP derivatives market remains weak, as reflected by futures OI falling to $2.47 billion on Monday, from $2.53 billion on the previous day. A minor recovery on Saturday had elevated the OI to $2.63 billion. Still, growing uncertainty in the broader crypto market, risk-off sentiment, and profit-taking, retail interest remains on the back foot.
Technical outlook: XRP upside limited as sellers tighten grip
XRP is trading around $1.40 as the 50-day Exponential Moving Average (EMA) descends to $1.83, capping near-term rebounds, while the 100-day EMA at $2.01 reinforces the overall downtrend. The remittance token holds well below both of the moving averages, keeping the broader structure bearish.
Similarly, the Moving Average Convergence Divergence (MACD) shows the MACD line below the signal line, while the red histogram bars have been contracting, emphasizing the short-term bearish outlook. The Relative Strength Index (RSI) sits at 34, below the midline and edging toward oversold. A recovery of the RSI above 40 would be necessary to ease pressure.
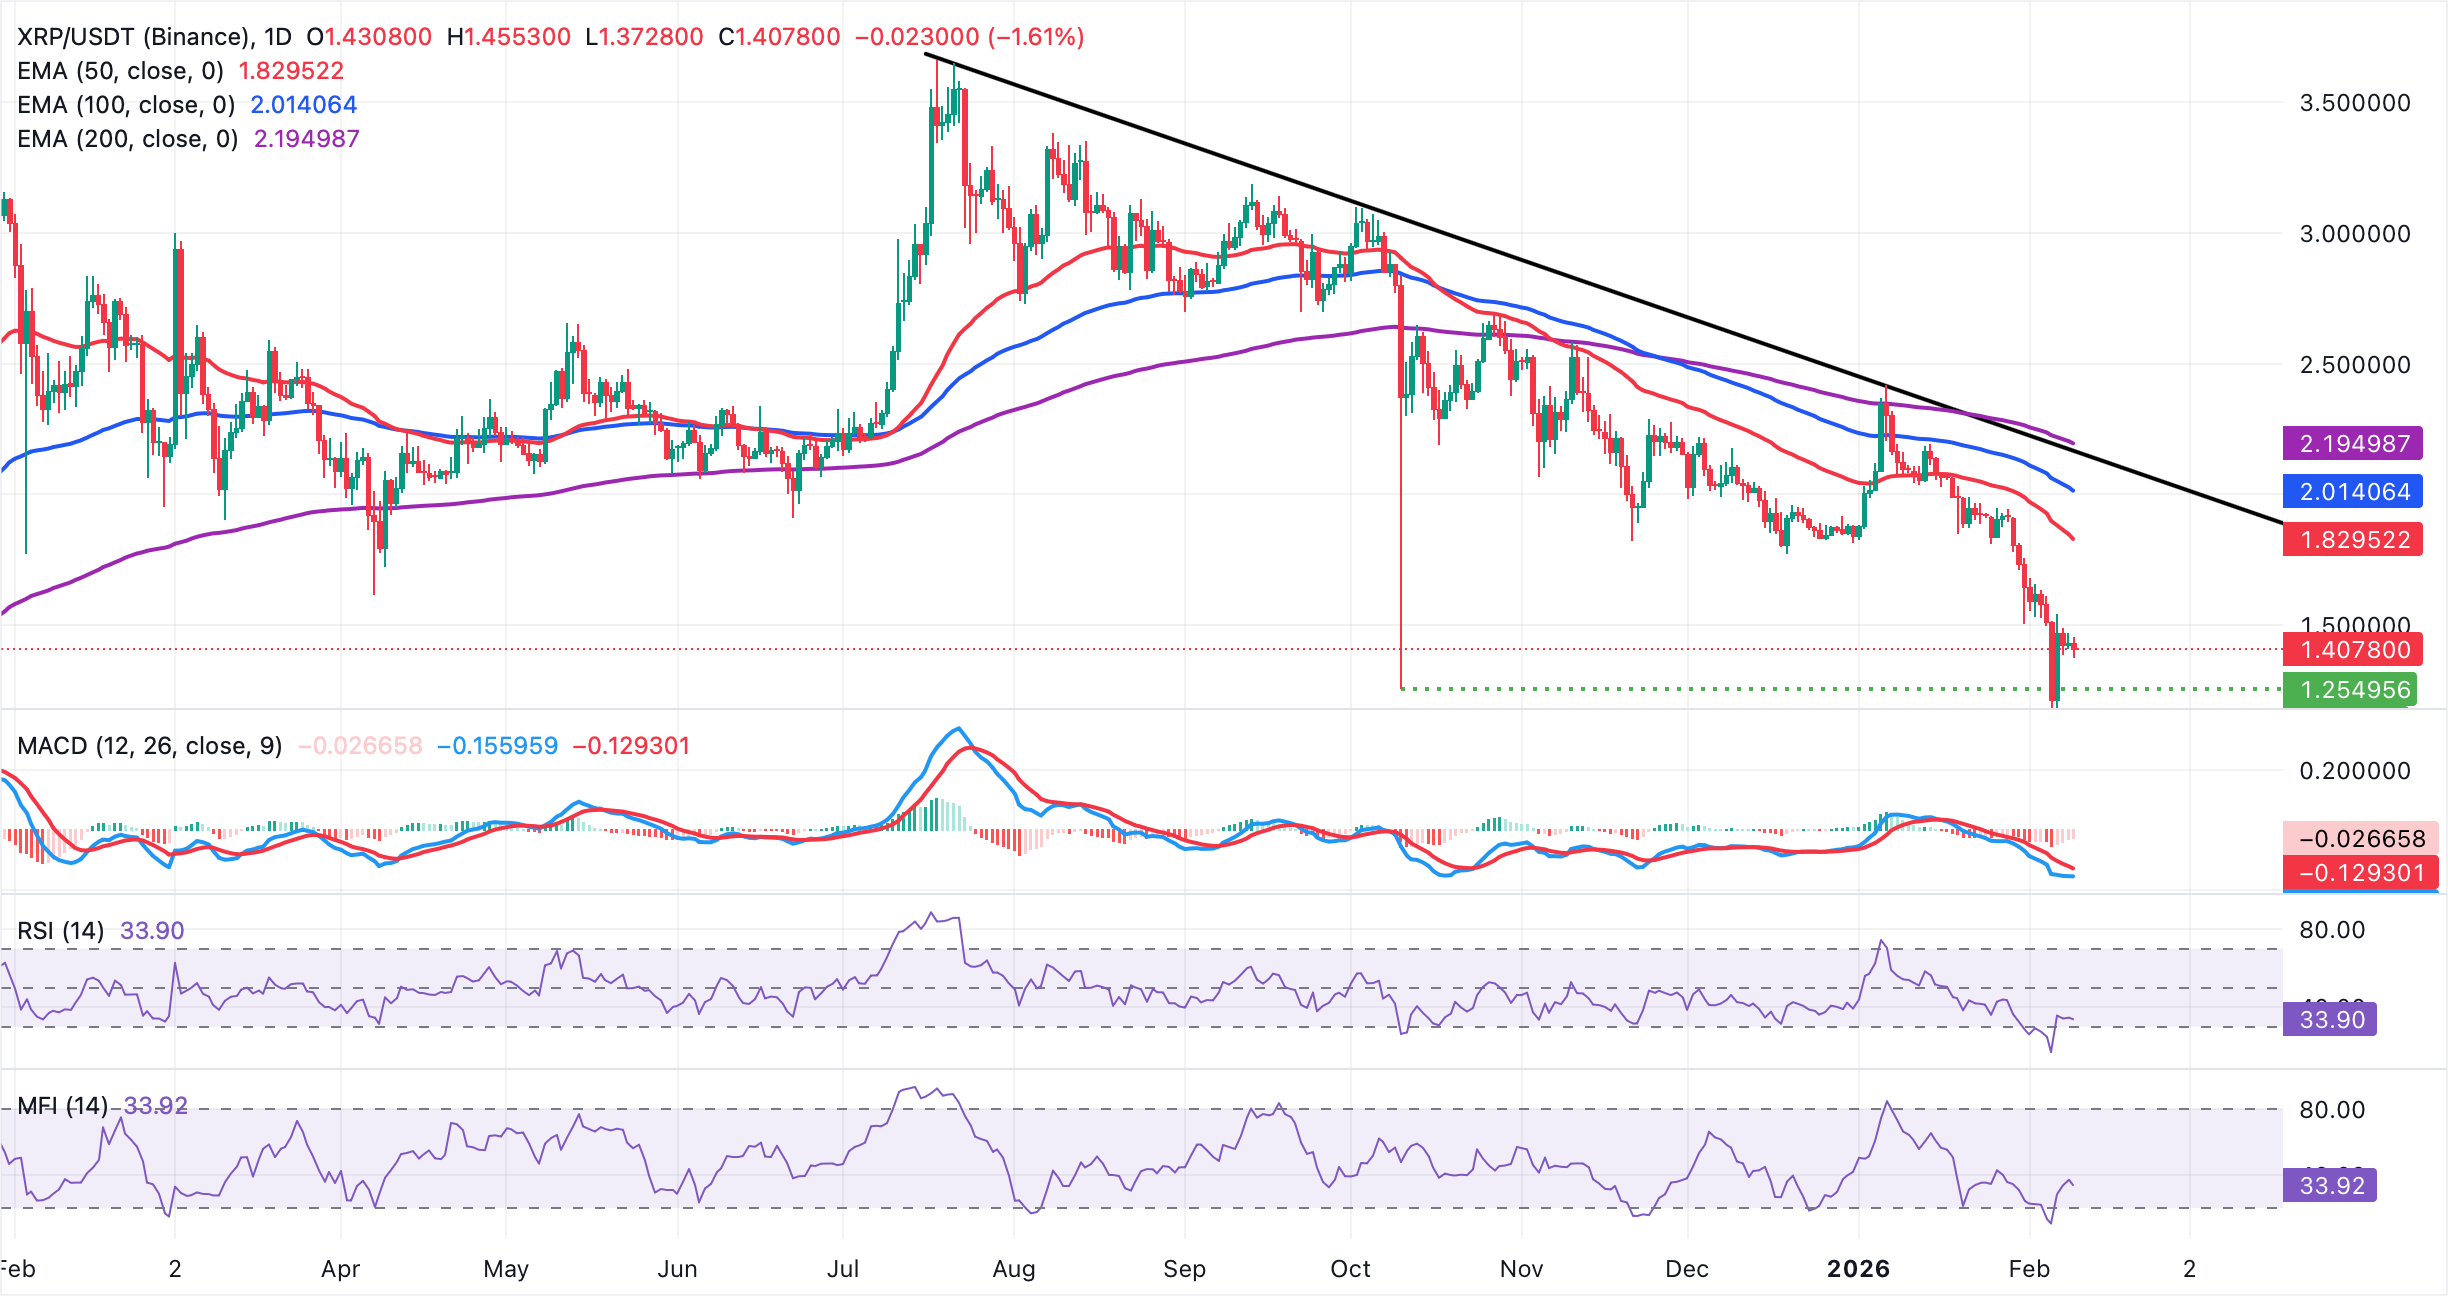
The descending trend line from $3.66 limits advances, with resistance near $2.16. Meanwhile, the 200-day EMA at $2.19 marks the next barrier. A daily close above the pivotal level at $1.40 could help shift the tone positively as investors lean into risk, and increase the odds of a breakout above the 50-day EMA at $1.83. Still, failure to do so would keep rallies contained and possibly trigger a sell-off toward Friday's low at $1.12.
Cryptocurrency metrics FAQs
The developer or creator of each cryptocurrency decides on the total number of tokens that can be minted or issued. Only a certain number of these assets can be minted by mining, staking or other mechanisms. This is defined by the algorithm of the underlying blockchain technology. On the other hand, circulating supply can also be decreased via actions such as burning tokens, or mistakenly sending assets to addresses of other incompatible blockchains.
Market capitalization is the result of multiplying the circulating supply of a certain asset by the asset’s current market value.
Trading volume refers to the total number of tokens for a specific asset that has been transacted or exchanged between buyers and sellers within set trading hours, for example, 24 hours. It is used to gauge market sentiment, this metric combines all volumes on centralized exchanges and decentralized exchanges. Increasing trading volume often denotes the demand for a certain asset as more people are buying and selling the cryptocurrency.
Funding rates are a concept designed to encourage traders to take positions and ensure perpetual contract prices match spot markets. It defines a mechanism by exchanges to ensure that future prices and index prices periodic payments regularly converge. When the funding rate is positive, the price of the perpetual contract is higher than the mark price. This means traders who are bullish and have opened long positions pay traders who are in short positions. On the other hand, a negative funding rate means perpetual prices are below the mark price, and hence traders with short positions pay traders who have opened long positions.
(The technical analysis of this story was written with the help of an AI tool.)

Hơn một triệu người dùng dựa vào FXStreet để có dữ liệu thị trường thời gian thực, công cụ biểu đồ, góc nhìn chuyên gia và tin tức Forex. Lịch kinh tế toàn diện và các hội thảo web giáo dục giúp nhà giao dịch luôn cập nhật và đưa ra quyết định có tính toán. FXStreet có khoảng 60 nhân sự, chia giữa trụ sở Barcelona và nhiều khu vực toàn cầu.
Đọc thêm


