
XRP vulnerable to deeper losses amid weak derivatives and lackluster ETF inflows
Bởi John Isige
Ngày xuất bản: 23 Jan 2026 | Ngày chỉnh sửa: 23 Jan 2026


BÀI VIẾT PHỔ BIẾN

Ripple (XRP) is trading under pressure, hovering above the immediate support level at $1.90 at the time of writing on Friday. Despite mild inflows into spot exchange-traded funds (ETFs), XRP has declined for a second consecutive day, reflecting weak retail demand and persistent selling pressure.
- XRP holds intraday losses above immediate support at $1.90 as crypto market remains in bears’ control.
- Subdued XRP derivatives signal a lack of investor confidence in the token.
- Mild ETF inflows fail to move prices as XRP declines for a second consecutive day.
Ripple (XRP) is trading under pressure, hovering above the immediate support level at $1.90 at the time of writing on Friday. Despite mild inflows into spot exchange-traded funds (ETFs), XRP has declined for a second consecutive day, reflecting weak retail demand and persistent selling pressure.
XRP struggles as retail interest wanes
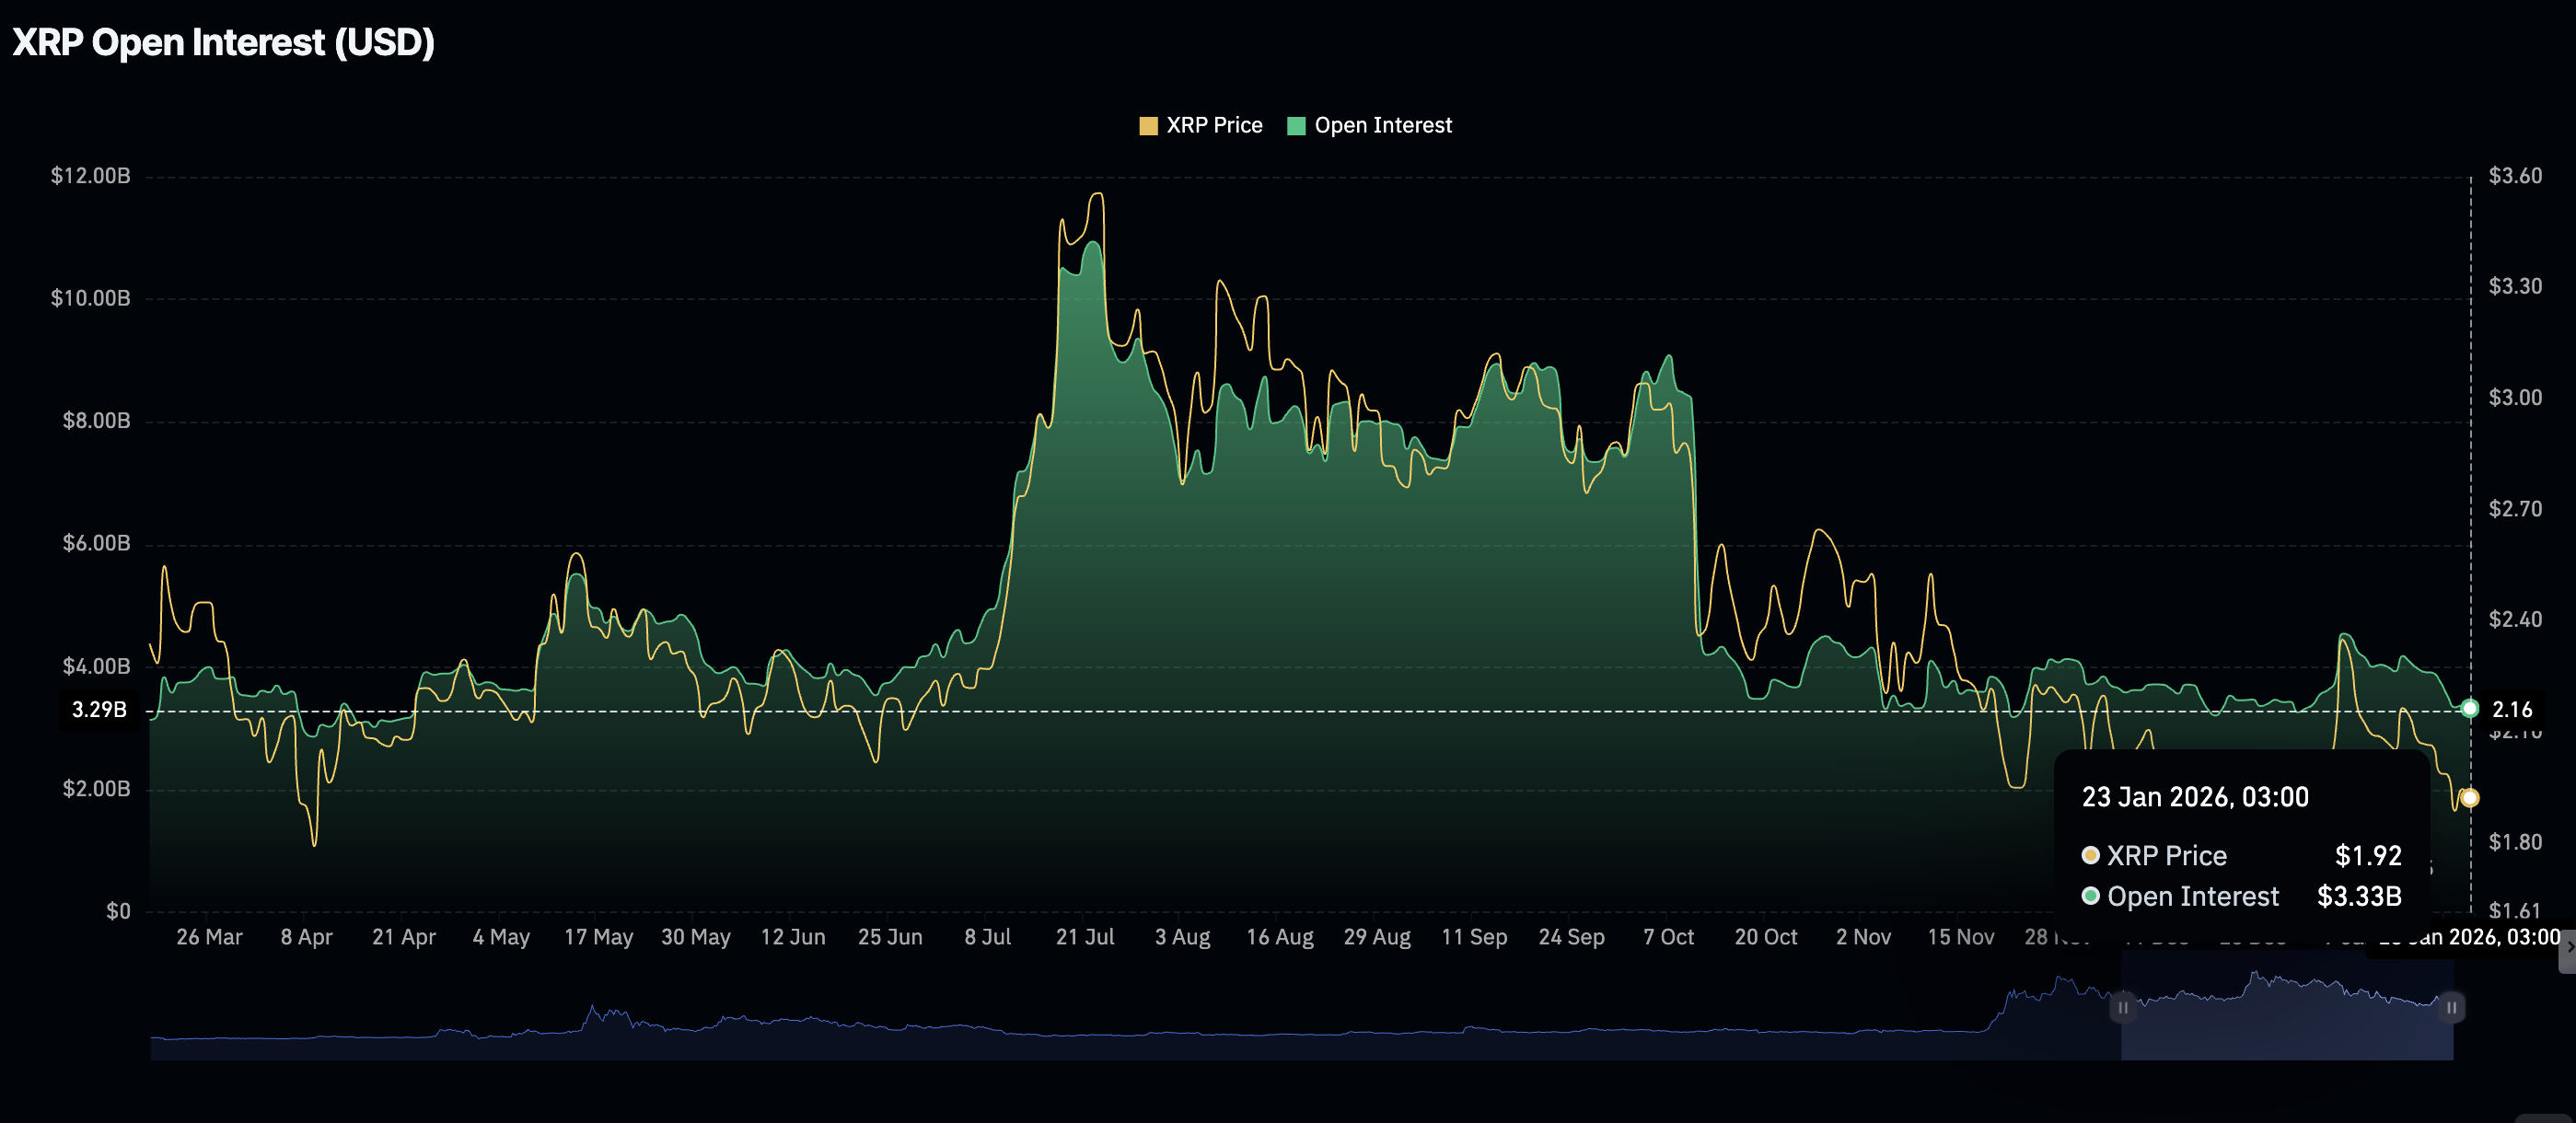
Retail interest weakened significantly since the October crash, which liquidated over $19 billion in crypto assets in a single day. The headwinds affected XRP derivatives, as future Open Interest (OI) tumbled from $8.36 billion on October 10 to $3.33 billion on Friday.
An attempt by the bulls to accelerate demand faltered at $4.55 billion on January 6, leaving XRP vulnerable to further losses. If derivative weakness continues, it could drive prices lower toward the April low of $1.61.
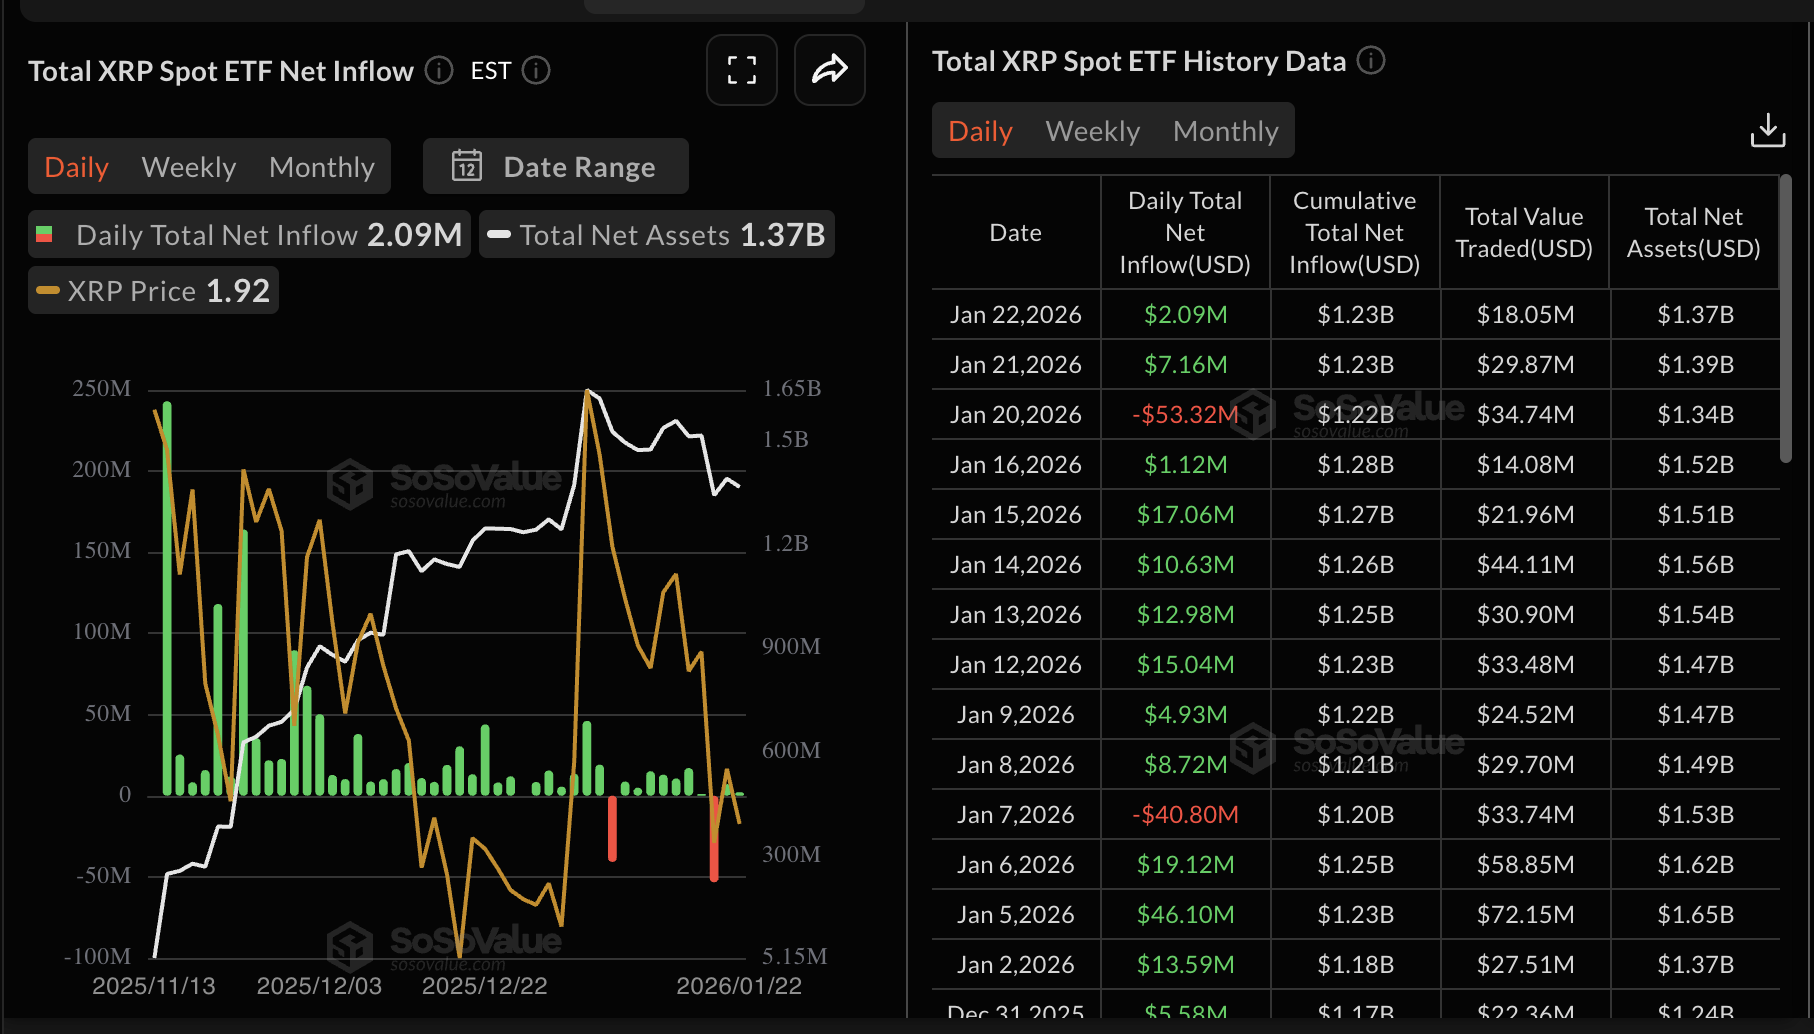
XRP spot ETFs recorded mild inflows of approximately $2 million on Thursday despite risk appetite deteriorating across crypto assets this week. The cumulative total inflow stands at $1.23 billion, and the net assets at $1.37 million, according to SoSoValue data. Demand for US-listed XRP ETFs has remained relatively stable, with only two days of outflows.
Technical outlook: XRP trades amid downtrend pressure
XRP continues to trade below the 50-day Exponential Moving Average (EMA) at $2.05, the 100-day EMA at $2.17, and the 200-day EMA at $2.30, confirming a steady bearish bias.
The immediate support at $1.90 absorbs the prevailing selling pressure. However, the Relative Strength Index (RSI) has declined to 41, indicating that bears are largely in control. An extended drop in the RSI toward the oversold region may accelerate the down leg, testing the Monday low at $1.85 and the April low at $1.61.
The Moving Average Convergence Divergence (MACD) indicator highlights another sell signal, as it holds below the signal line. Traders would be inclined to reduce exposure if the histogram bars below the zero line continue to expand.
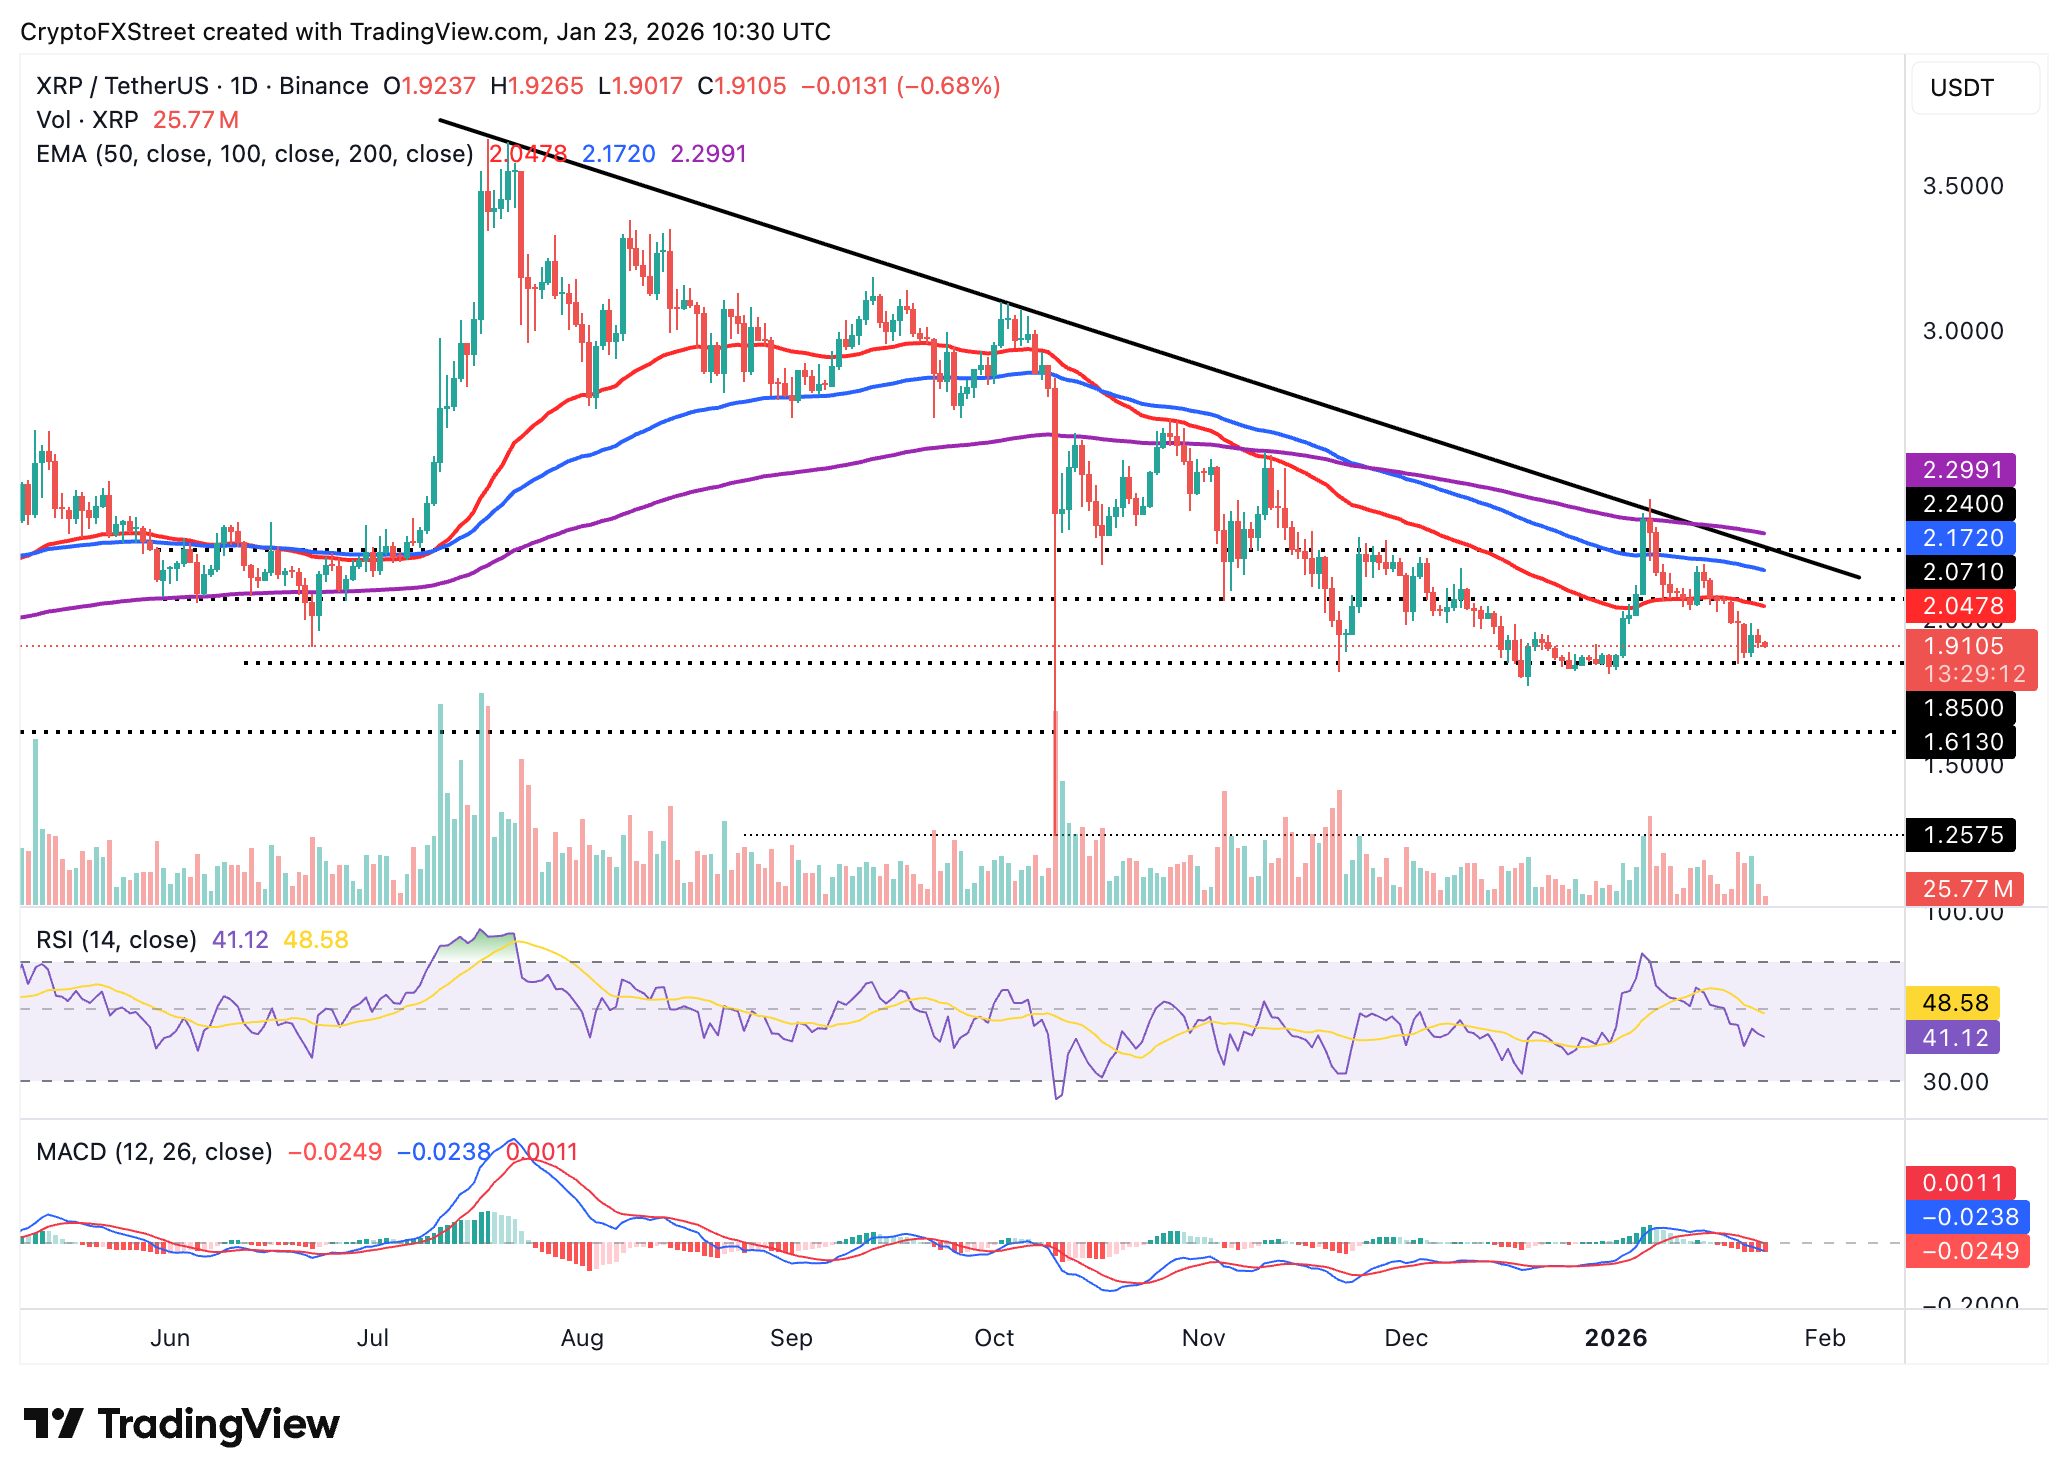
Conversely, the $1.90 support level remains critical for XRP to resume recovery and reclaim the $2.00 psychological threshold. Beyond this range, the 50-day EMA caps the upside at $2.05, the 100-day EMA at $2.17 and the 200-day EMA at $2.30.
Open Interest, funding rate FAQs
Higher Open Interest is associated with higher liquidity and new capital inflow to the market. This is considered the equivalent of increase in efficiency and the ongoing trend continues. When Open Interest decreases, it is considered a sign of liquidation in the market, investors are leaving and the overall demand for an asset is on a decline, fueling a bearish sentiment among investors.
Funding fees bridge the difference between spot prices and prices of futures contracts of an asset by increasing liquidation risks faced by traders. A consistently high and positive funding rate implies there is a bullish sentiment among market participants and there is an expectation of a price hike. A consistently negative funding rate for an asset implies a bearish sentiment, indicating that traders expect the cryptocurrency’s price to fall and a bearish trend reversal is likely to occur.

Hơn một triệu người dùng dựa vào FXStreet để có dữ liệu thị trường thời gian thực, công cụ biểu đồ, góc nhìn chuyên gia và tin tức Forex. Lịch kinh tế toàn diện và các hội thảo web giáo dục giúp nhà giao dịch luôn cập nhật và đưa ra quyết định có tính toán. FXStreet có khoảng 60 nhân sự, chia giữa trụ sở Barcelona và nhiều khu vực toàn cầu.
Đọc thêm


