
Ripple Price Forecast: XRP trims modest weekly gains amid retail capital flight
Bởi John Isige
Đã cập nhật: 9 Apr 2026


BÀI VIẾT PHỔ BIẾN

Ripple (XRP) is edging lower for a second consecutive day, below its weekly peak of $1.40 and trading at around $1.33 at the time of writing on Thursday.
- XRP extends its correction from this week’s high of $1.40, amid intensifying bearish sentiment in the broader crypto market.
- The XRP derivatives market remains significantly depressed as falling futures Open Interest weighs.
- XRP trades within a broadly defined bearish trend, with price action persistently rejected at key moving averages.
Ripple (XRP) is edging lower for a second consecutive day, below its weekly peak of $1.40 and trading at around $1.33 at the time of writing on Thursday. The remittance token aligns with the broader crypto market’s outlook, which appears largely defined by increasing doubts over the United States (US) and Iran’s ceasefire deal.
Although holding, the ceasefire remains edgy, with Iran still blocking passage through the Strait of Hormuz and US President Donald Trump warning that strikes will continue if Iran does not strike a deal.
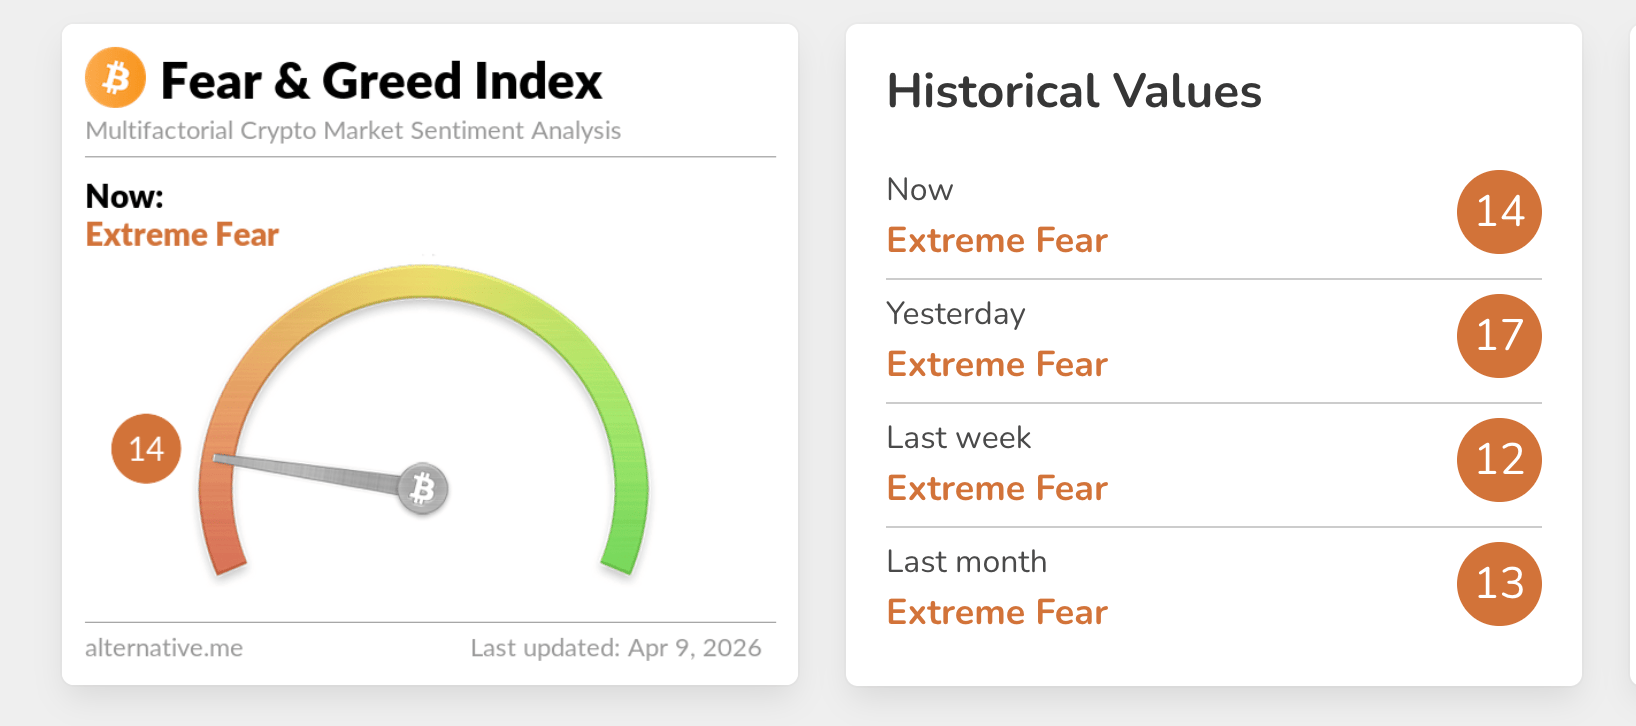
Crypto market sentiment has significantly deteriorated since the war broke out in late February, as reflected in the Fear & Greed Index, which reads 14 in the extreme fear region on Thursday, down from 17 the previous day. This outlook shows that investors lack conviction in the broader market’s ability to sustain short to medium-term recovery.
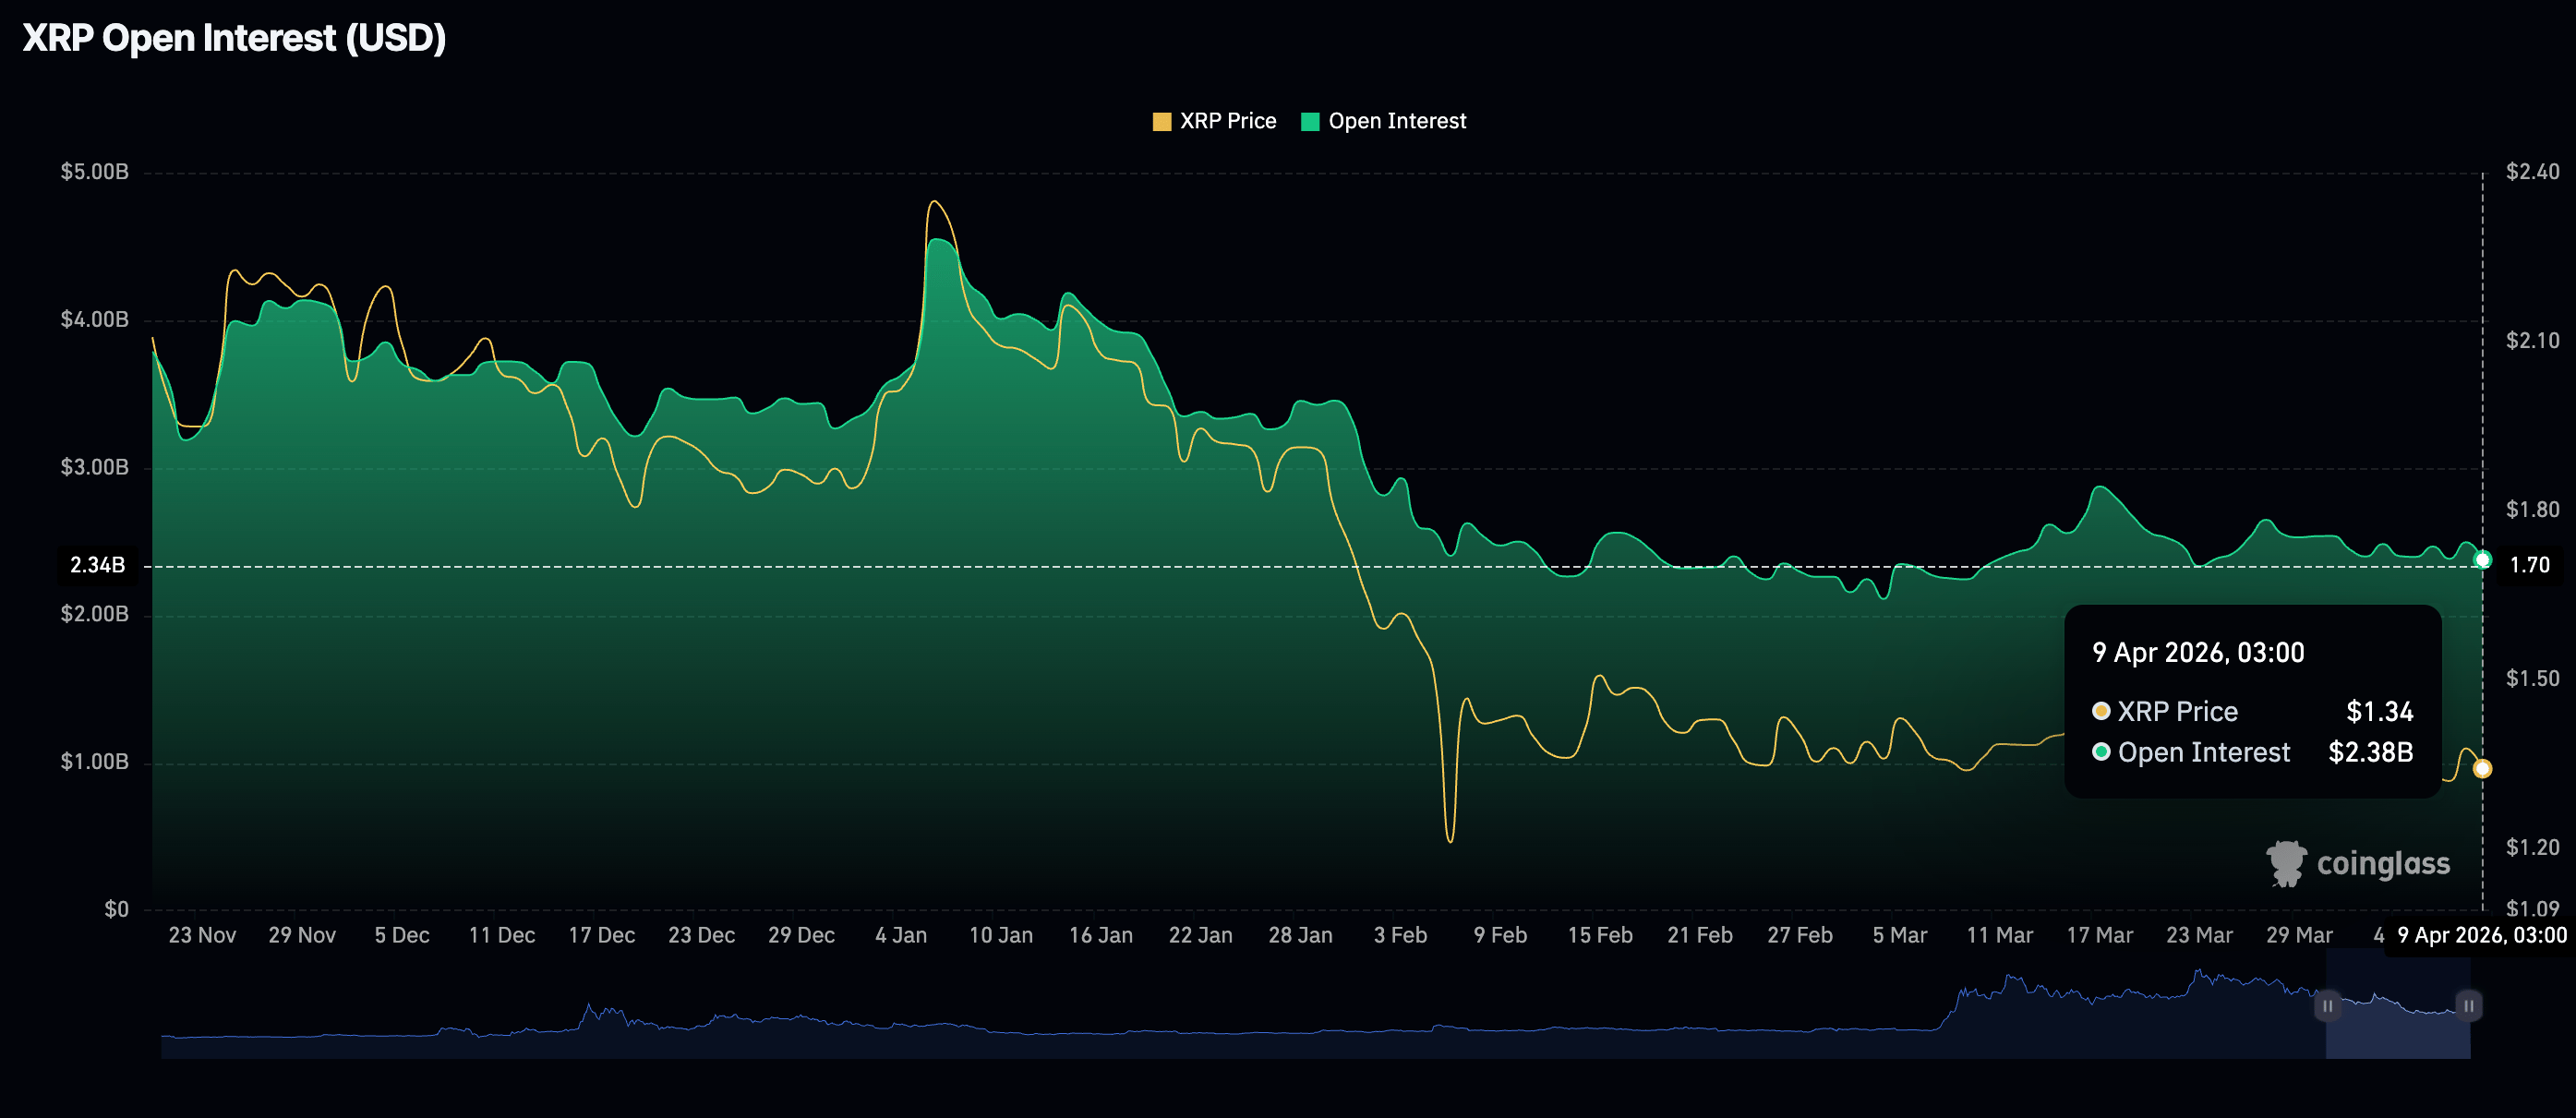
XRP falters, weighed down by weak derivatives
Retail demand is weakening, as Open Interest (OI), which reflects the value of outstanding futures and options contracts, falls to $2.38 billion on Thursday from $2.50 billion the previous day. If the decline persists, XRP will likely remain confined to the broader downtrend toward support at $1.30.
Technical outlook: XRP faces increasing downside risks as technicals falter
XRP is trading at roughly $1.33, under clear downside pressure, with price holding beneath the 50-day, 100-day, and 200-day Exponential Moving Averages (EMAs) at $1.42, $1.58, and $1.83, respectively, which keeps the broader trend tilted to the downside despite the recent bounce.
The Relative Strength Index (RSI) near 44 on the daily chart suggests only modest negative bias rather than outright oversold conditions, while the Moving Average Convergence Divergence (MACD), hovering just above the zero line, hints at tentative recovery attempts that are still capped by a solid overhead structure.
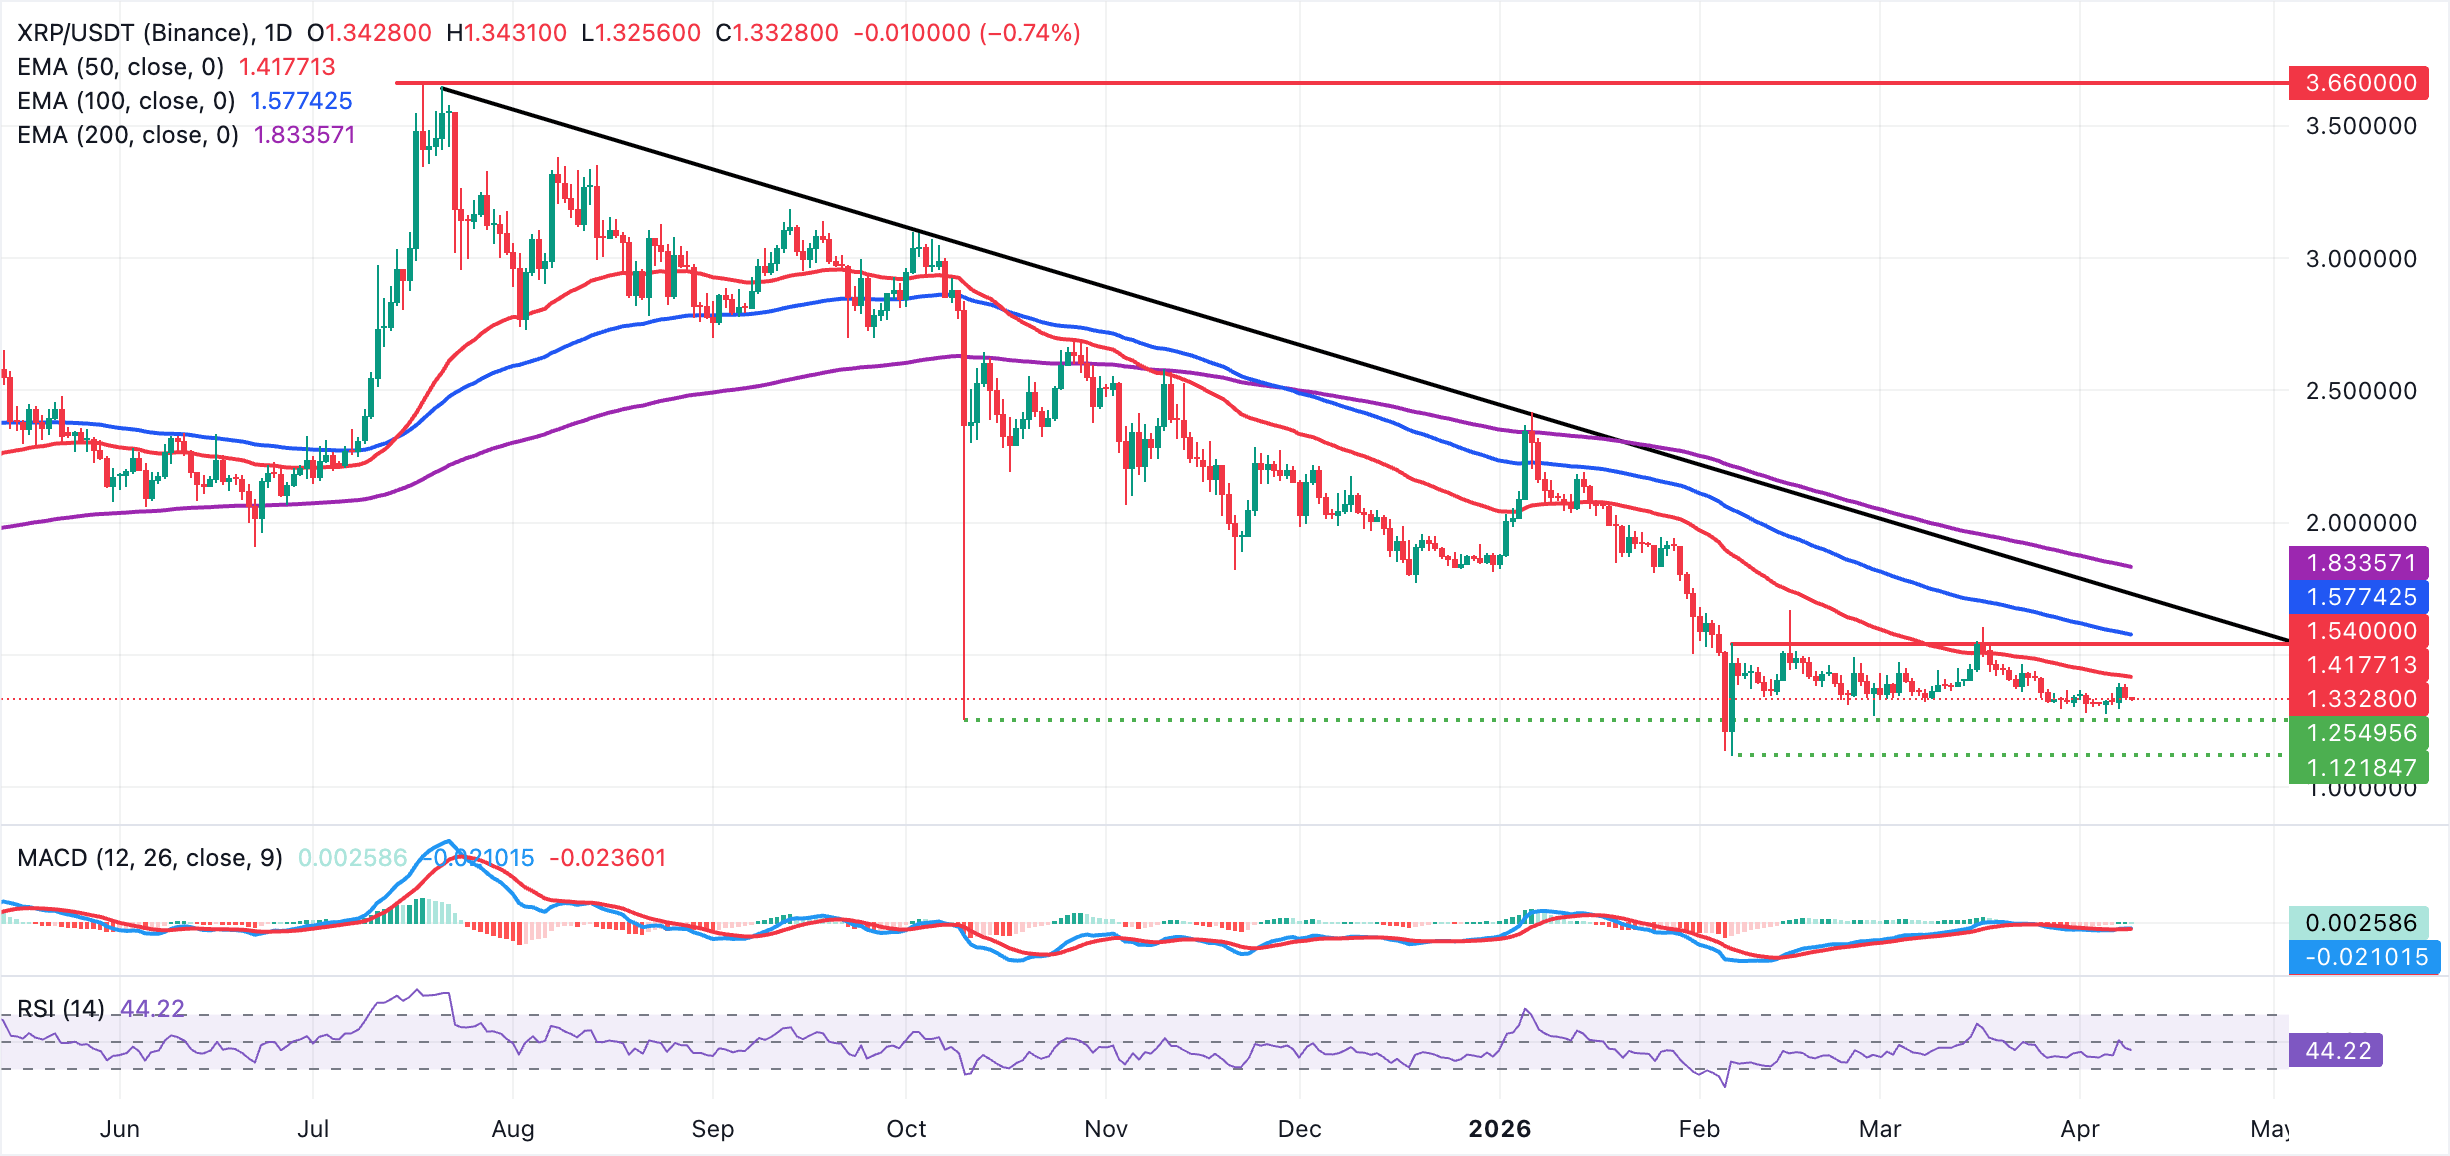
On the topside, XRP's initial resistance is at the 50-day EMA around $1.42, with further hurdles at the 100-day EMA near $1.58 and the descending trendline break zone around $1.73. The 200-day EMA at $1.83 reinforces this broader supply band that would need to be reclaimed to ease the bearish backdrop.
With no clearly defined moving-average support levels on the daily chart, traders may look to recent swing lows at $1.30 and $1.28 for interim floors, while recognizing that the dominant risk remains and that rallies will likely fade against these layered EMAs until buyers can secure a sustained daily close above the first resistance cluster.
Crypto ETF FAQs
An Exchange-Traded Fund (ETF) is an investment vehicle or an index that tracks the price of an underlying asset. ETFs can not only track a single asset, but a group of assets and sectors. For example, a Bitcoin ETF tracks Bitcoin’s price. ETF is a tool used by investors to gain exposure to a certain asset.
Yes. The first Bitcoin futures ETF in the US was approved by the US Securities & Exchange Commission in October 2021. A total of seven Bitcoin futures ETFs have been approved, with more than 20 still waiting for the regulator’s permission. The SEC says that the cryptocurrency industry is new and subject to manipulation, which is why it has been delaying crypto-related futures ETFs for the last few years.
Yes. The SEC approved in January 2024 the listing and trading of several Bitcoin spot Exchange-Traded Funds, opening the door to institutional capital and mainstream investors to trade the main crypto currency. The decision was hailed by the industry as a game changer.
The main advantage of crypto ETFs is the possibility of gaining exposure to a cryptocurrency without ownership, reducing the risk and cost of holding the asset. Other pros are a lower learning curve and higher security for investors since ETFs take charge of securing the underlying asset holdings. As for the main drawbacks, the main one is that as an investor you can’t have direct ownership of the asset, or, as they say in crypto, “not your keys, not your coins.” Other disadvantages are higher costs associated with holding crypto since ETFs charge fees for active management. Finally, even though investing in ETFs reduces the risk of holding an asset, price swings in the underlying cryptocurrency are likely to be reflected in the investment vehicle too.
(The technical analysis of this story was written with the help of an AI tool.)

Hơn một triệu người dùng dựa vào FXStreet để có dữ liệu thị trường thời gian thực, công cụ biểu đồ, góc nhìn chuyên gia và tin tức Forex. Lịch kinh tế toàn diện và các hội thảo web giáo dục giúp nhà giao dịch luôn cập nhật và đưa ra quyết định có tính toán. FXStreet có khoảng 60 nhân sự, chia giữa trụ sở Barcelona và nhiều khu vực toàn cầu.
Đọc thêm


