
Ripple Price Forecast: XRP tumbles toward $1.00 amid aggressive selling
Bởi John Isige
Đã cập nhật: 5 Jun 2026


BÀI VIẾT PHỔ BIẾN

Ripple (XRP) extends its downtrend, trading around $1.09 at the time of writing on Friday, its lowest level since November 2024.
- XRP trades under dense headwinds, targeting lows around $1.00 on Friday.
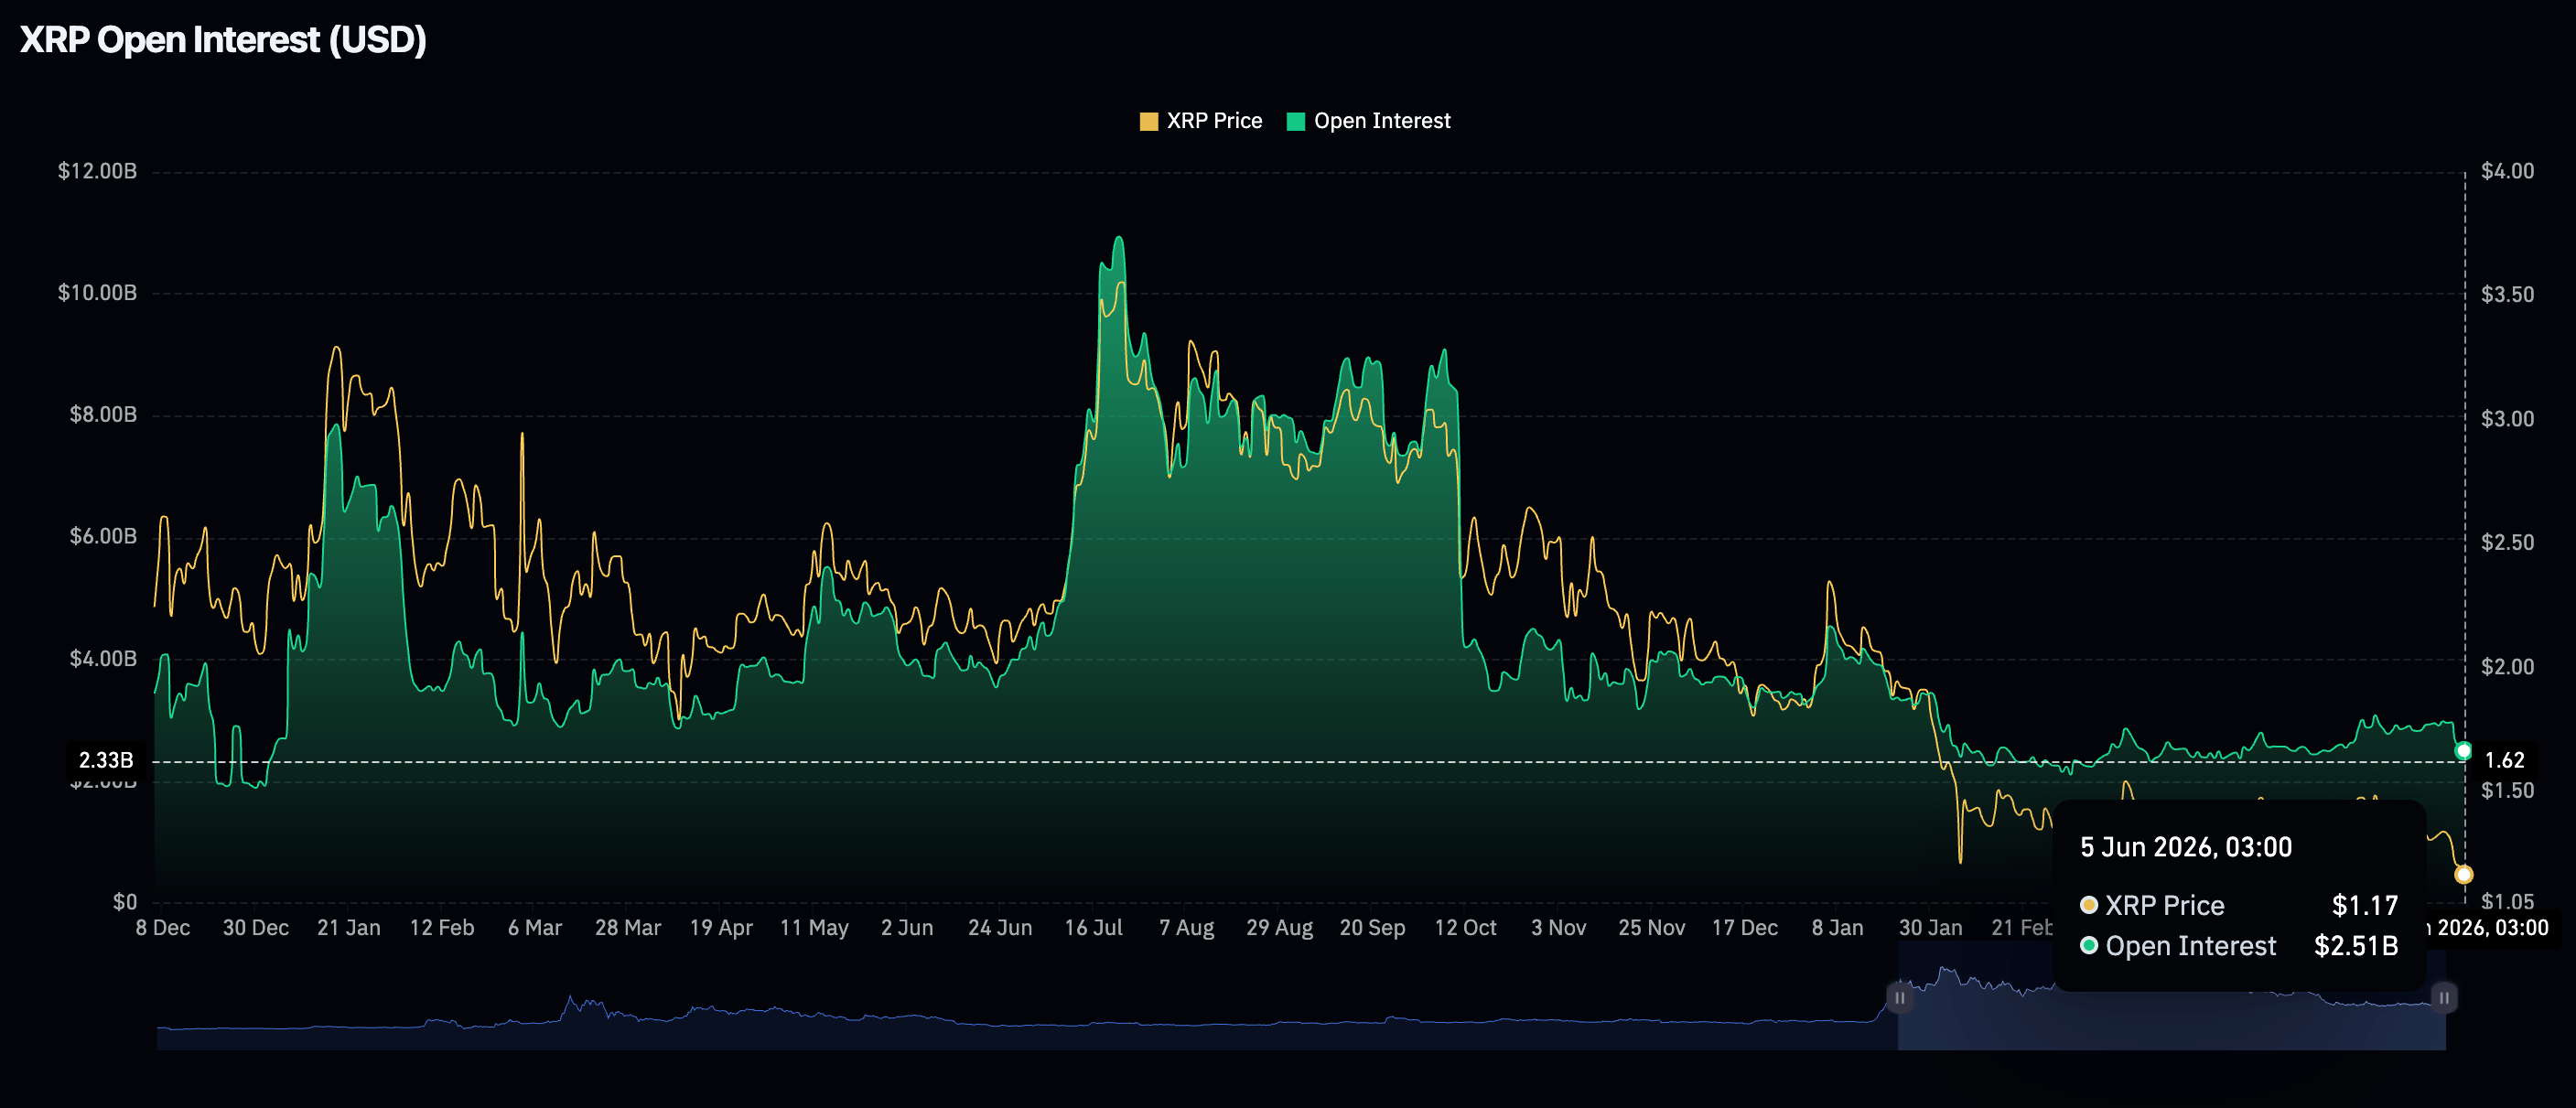
- XRP derivatives market extends drawdown, with futures Open Interest falling to $2.51 billion.
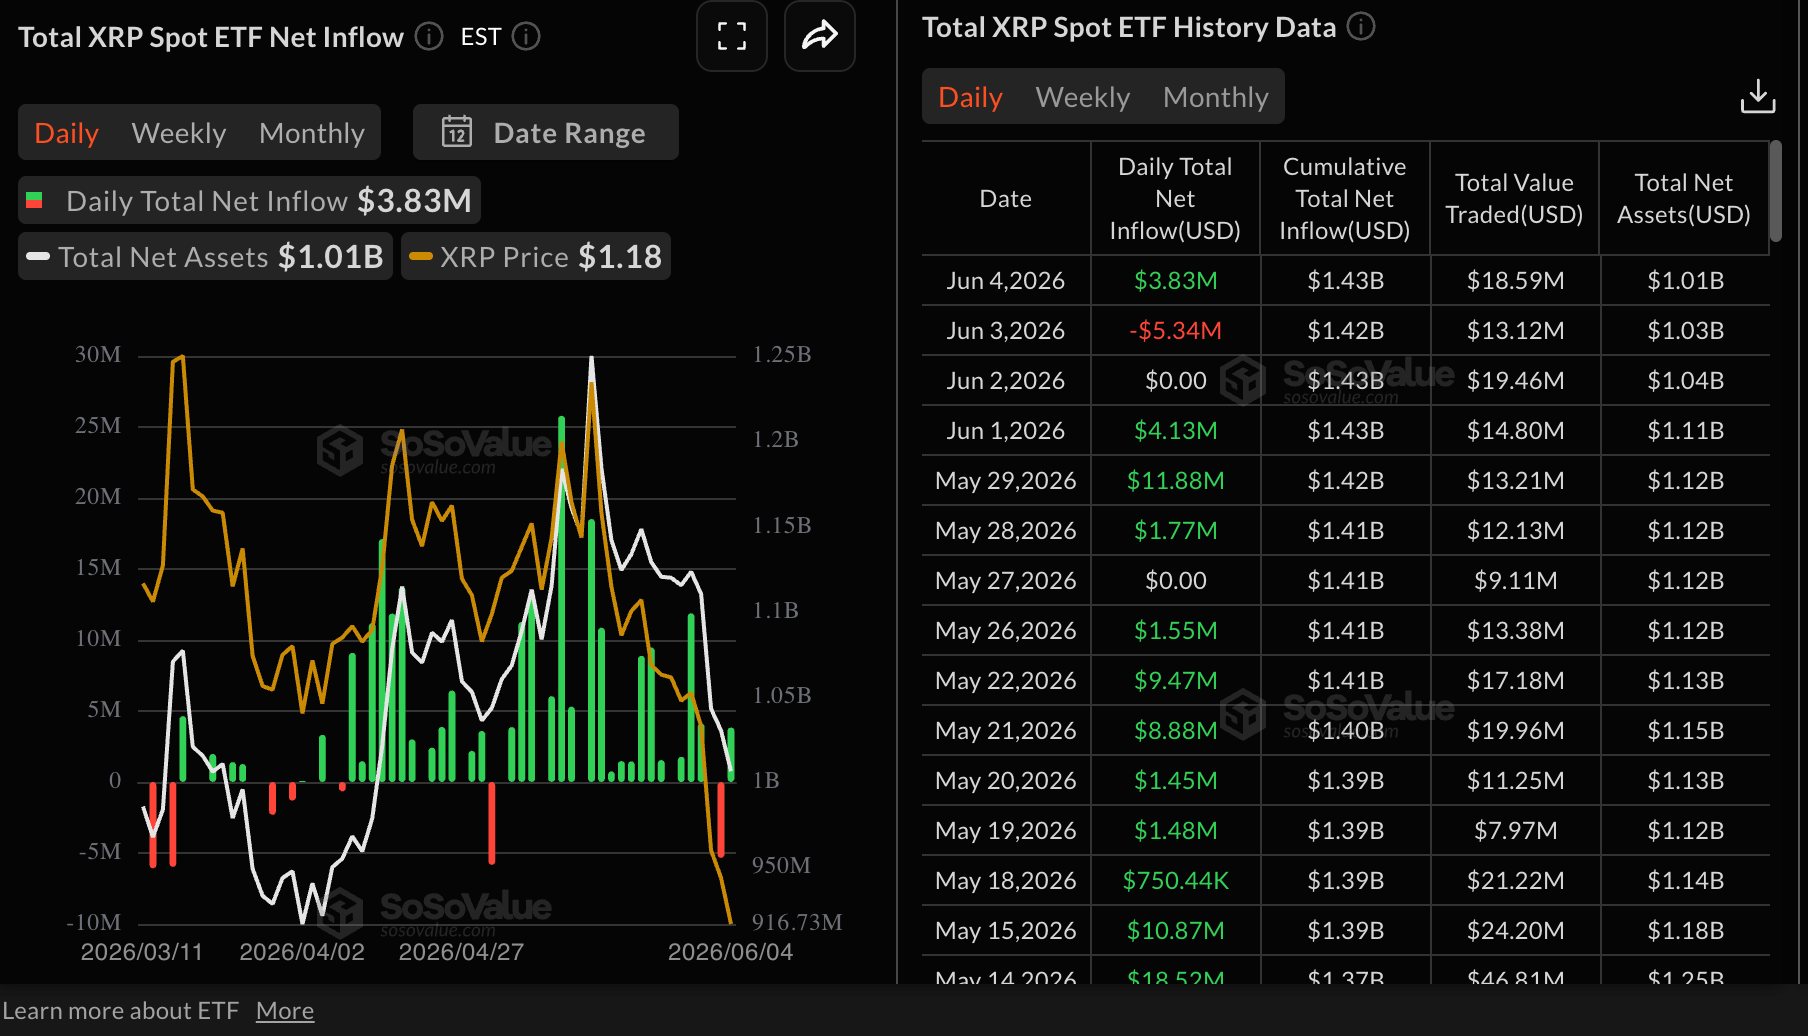
- XRP’s mild inflows into spot ETFs fail to lift sentiment as bears tighten their grip.
Ripple (XRP) extends its downtrend, trading around $1.09 at the time of writing on Friday, its lowest level since November 2024. The cross-border remittance token’s free fall since the week began aligns with a broader crypto market sell-off, with Bitcoin (BTC) closing in on the critical $60,000 level and Ethereum (ETH) approaching support at $1,600. Capital outflows continue to weigh on the overall outlook, increasing the odds of an extended sell-off.
XRP retail demand fades as declines deepen
XRP remains under duress as risk-averse sentiment persists in the derivatives market. According to CoinGlass data, Open Interest (OI) in perpetual futures narrowed to $2.51 billion on Friday, down from $2.59 billion the day before and $2.96 billion on Monday.
A sustained drop in OI suggests that traders lack conviction in XRP’s ability to sustain an uptrend and are therefore unwilling to open new positions.
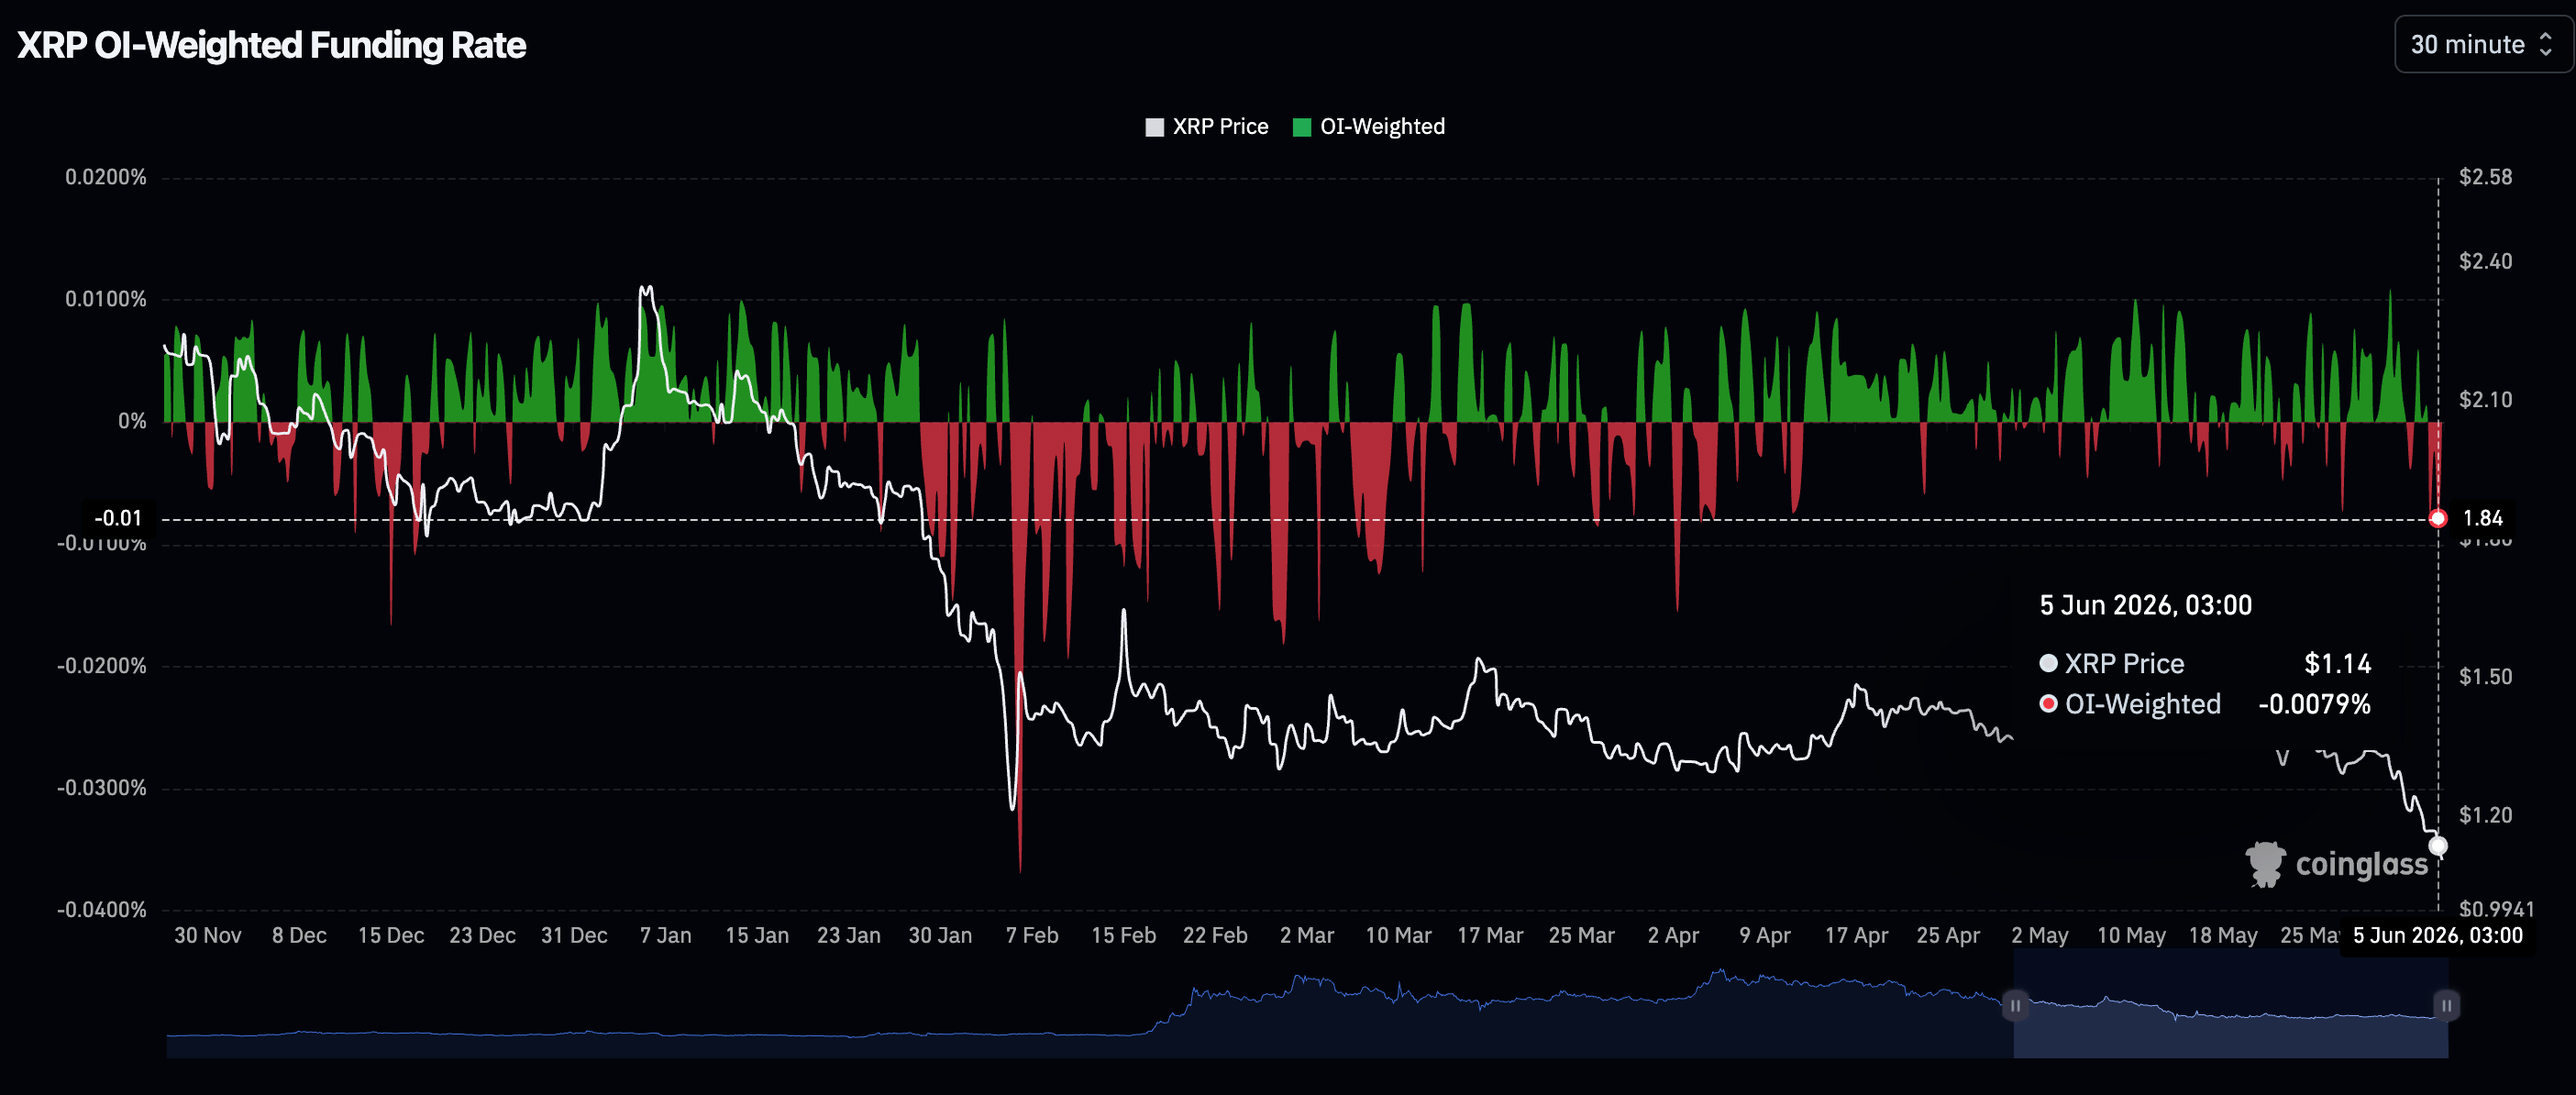
Retail participants remain primarily bearish, as evidenced by the OI-Weighted Funding Rate in negative territory at -0.0079% on Friday. This indicates that sellers are willing to pay a premium in fees to keep their short positions open, convinced that the decline will persist.
Despite a modest $3.83 million inflow into XRP spot ETFs from institutional investors on Thursday, XRP’s price continued its downward trajectory, edging closer to the pivotal $1.00 support. According to SoSoValue, cumulative inflows stand at $1.43 billion while net assets under management average $1.01 billion.
Price analysis: XRP bulls rely on $1.00 lifeline support
XRP trades at $1.12, extending a dominant bearish bias as price holds well beneath the 50-day, 100-day and 200-day Exponential Moving Averages (EMAs). The stacked bearish alignment of the short-, medium- and long-term EMAs above spot reinforces a downside-skewed structure, while the Relative Strength Index (RSI) near 20 highlights oversold conditions that could slow the decline.
The Moving Average Convergence Divergence (MACD) histogram remains in negative territory on the daily chart, suggesting persistent selling pressure despite the stretched momentum backdrop. Moreover, a heavily oversold Relative Strength Index (RSI) at 19 on the same chart suggests that the downtrend is overstretched and XRP may be due for a rebound.
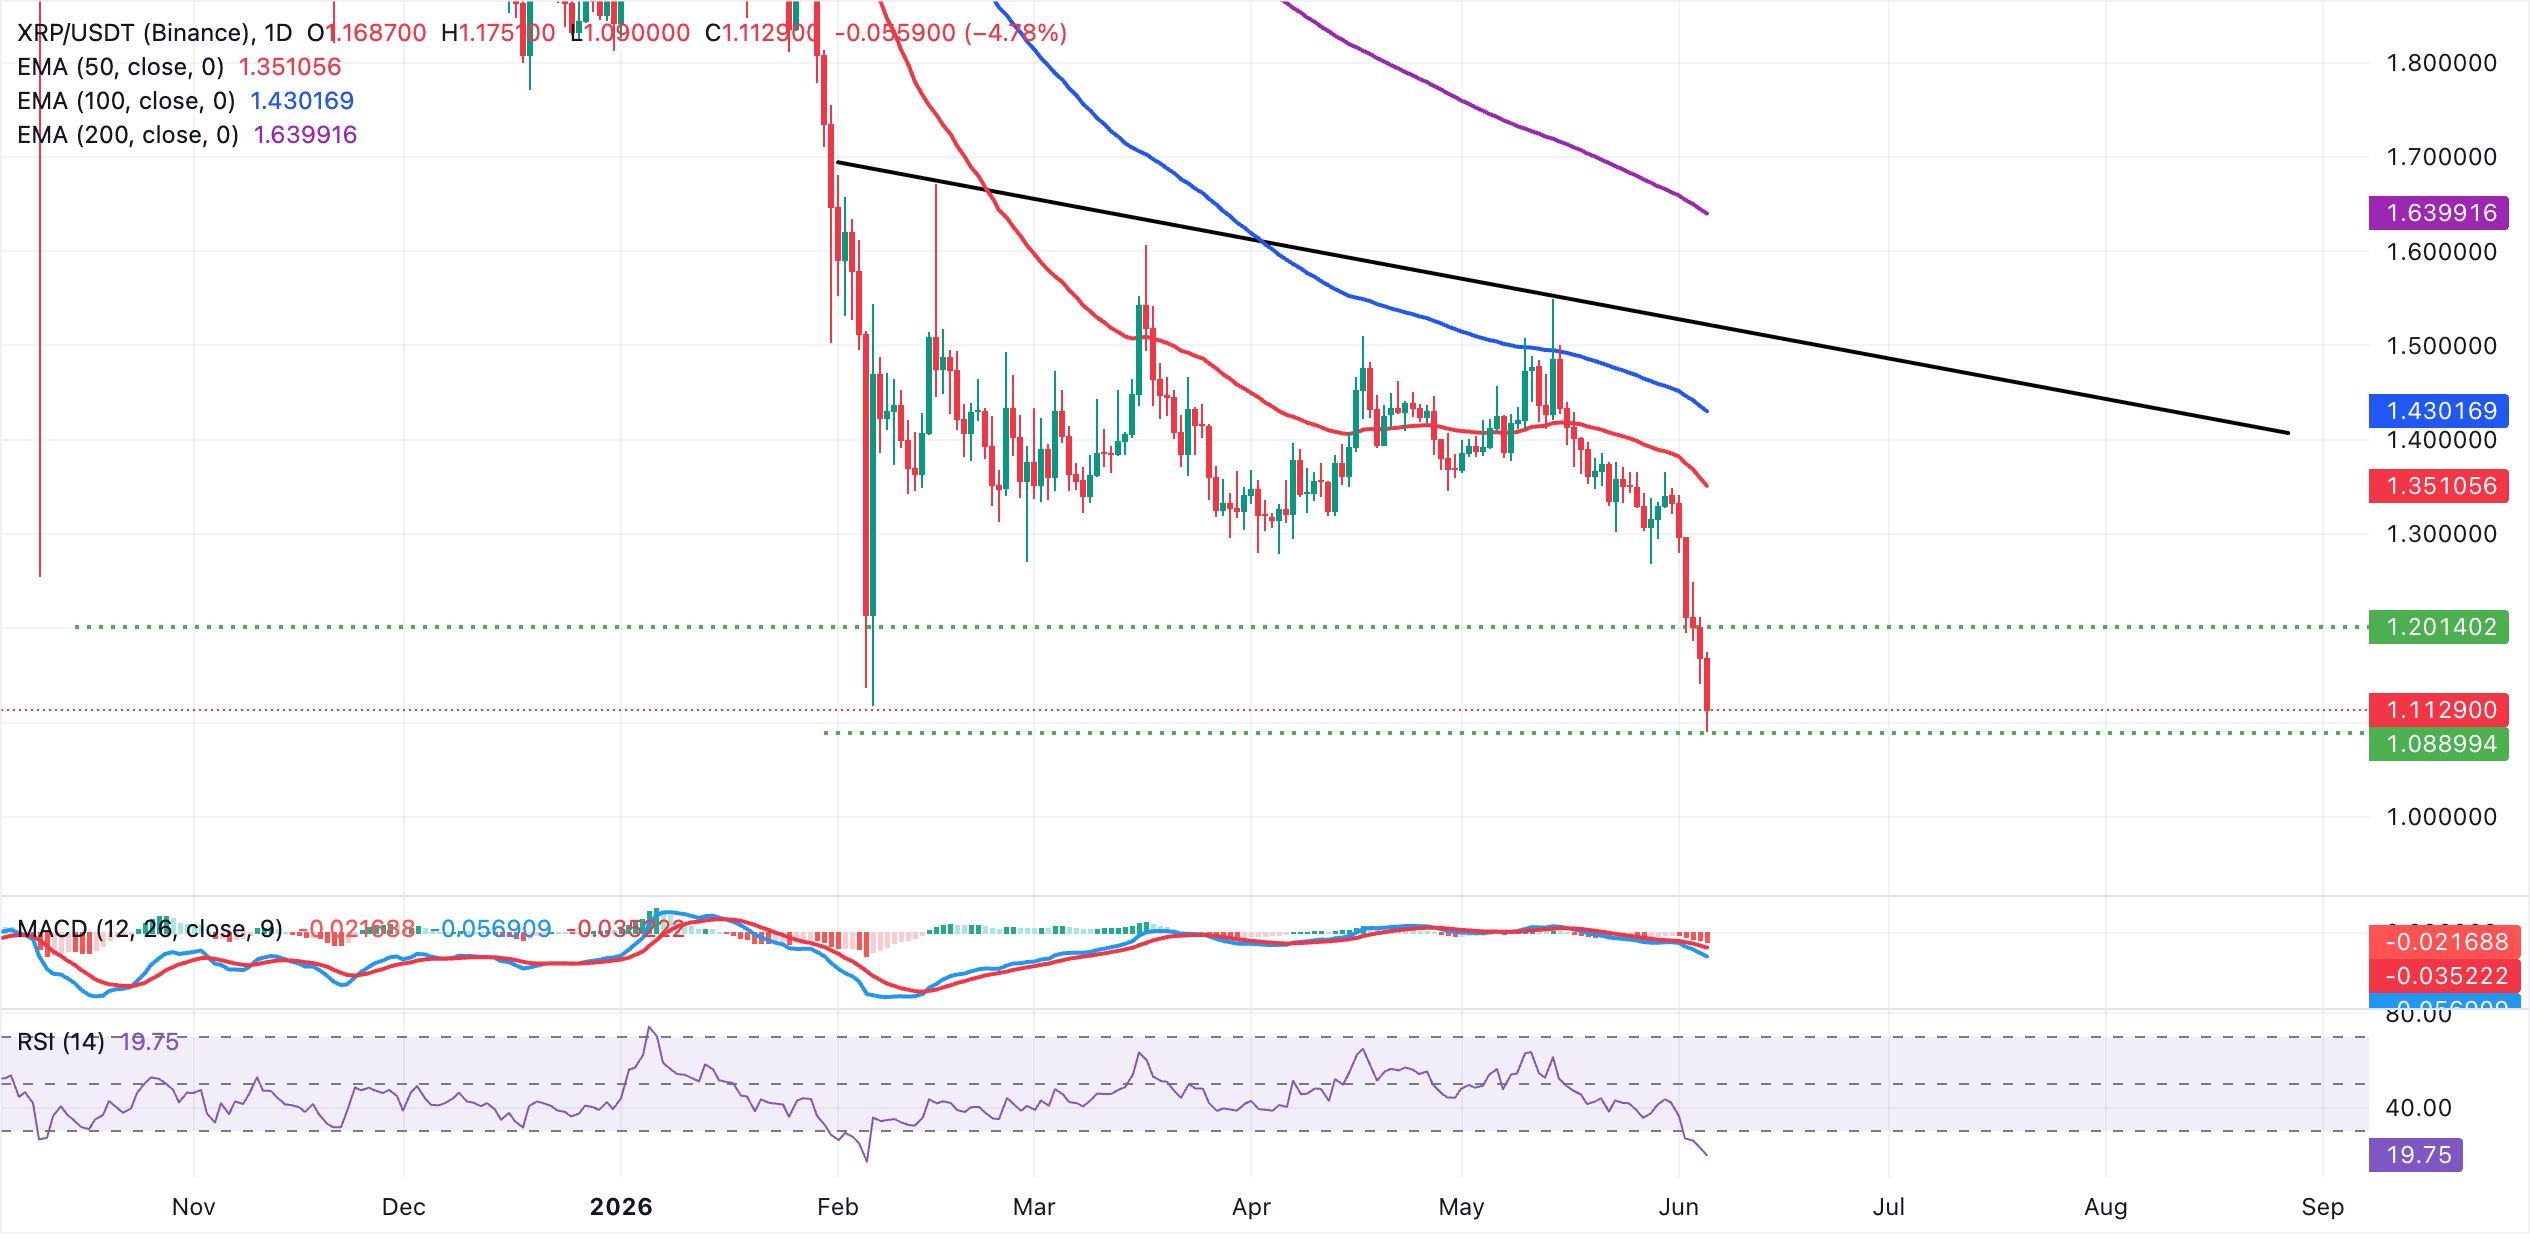
On the topside, initial resistance emerges at the 50-day EMA around $1.35, ahead of the 100-day EMA near 1$.43. Above these, the bearish downward resistance trendline, with a key break level around $1.52, is expected to cap recovery attempts before the more distant 200-day EMA near $1.64 comes into play.
A sustained sell-off could push XRP into the demand at $1.10, followed by a deeper correction to the critical $1.00 level, where interested buyers could seek re-engagement.
(The technical analysis of this story was written with the help of an AI tool.)
Open Interest, funding rate FAQs
Higher Open Interest is associated with higher liquidity and new capital inflow to the market. This is considered the equivalent of increase in efficiency and the ongoing trend continues. When Open Interest decreases, it is considered a sign of liquidation in the market, investors are leaving and the overall demand for an asset is on a decline, fueling a bearish sentiment among investors.
Funding fees bridge the difference between spot prices and prices of futures contracts of an asset by increasing liquidation risks faced by traders. A consistently high and positive funding rate implies there is a bullish sentiment among market participants and there is an expectation of a price hike. A consistently negative funding rate for an asset implies a bearish sentiment, indicating that traders expect the cryptocurrency’s price to fall and a bearish trend reversal is likely to occur.

Hơn một triệu người dùng dựa vào FXStreet để có dữ liệu thị trường thời gian thực, công cụ biểu đồ, góc nhìn chuyên gia và tin tức Forex. Lịch kinh tế toàn diện và các hội thảo web giáo dục giúp nhà giao dịch luôn cập nhật và đưa ra quyết định có tính toán. FXStreet có khoảng 60 nhân sự, chia giữa trụ sở Barcelona và nhiều khu vực toàn cầu.
Đọc thêm


