
Silver Price Forecast: Stalls near $79 as doji halts rally
Bởi Christian Borjon Valencia
Đã cập nhật: 15 Apr 2026


BÀI VIẾT PHỔ BIẾN

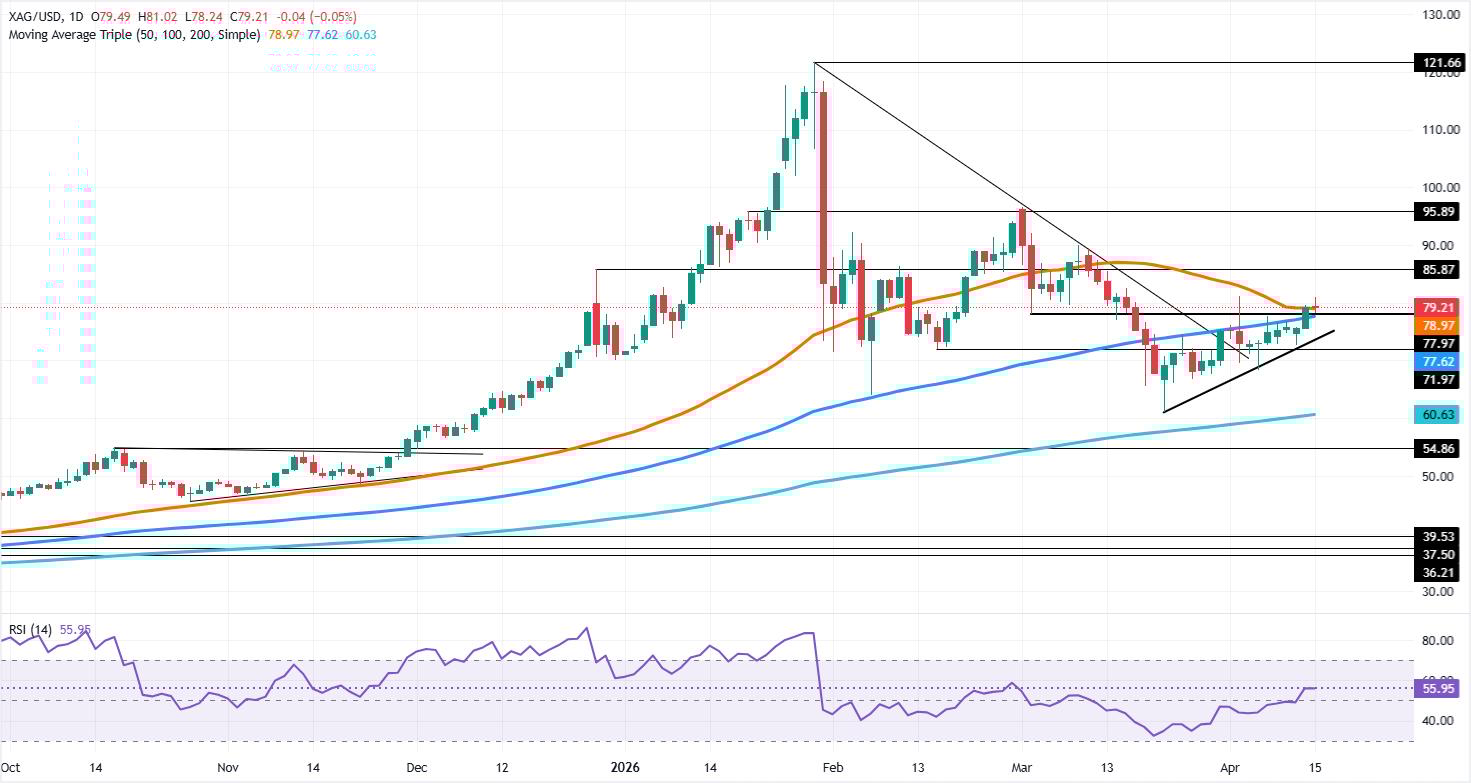
Silver price halted its advance as a ‘doji candle’ emerged near the 50-day Simple Moving Average (SMA) at $79.09, a sign of indecision amongst traders, whether to push prices towards the next cycle high at $90.01 —the March 10 high—, or challenge the 100-day SMA key support at $76.67.
- A doji near the 50-day SMA signals growing market indecision.
- Flat RSI suggests bullish momentum has stalled despite the broader uptrend.
- A break below $79.00 could expose trendline support near $75.00.
Silver price halted its advance as a ‘doji candle’ emerged near the 50-day Simple Moving Average (SMA) at $79.09, a sign of indecision amongst traders, whether to push prices towards the next cycle high at $90.01 —the March 10 high—, or challenge the 100-day SMA key support at $76.67. At the time of writing, XAG/USD trades at $79.38, down 0.12%.
XAG/USD Price Forecast: Technical outlook
The technical picture shows that XAG/USD is trending steadily upwards, but a doji is opening the door to a pullback. Bullish momentum stalled, as depicted by the Relative Strength Index (RSI), which remains above its neutral level, but it has turned flat.
For a bullish resumption, Silver must clear the day’s high at $81.00 a troy ounce. Once achieved, the next resistance level will be the March 17 daily high at $82.55, followed by the March 10 peak at $90.01.
Conversely, if XAG/USD ends the day’s session below $79.00, this clears the path to challenge a key support trendline at around the $75.00-$75.20 range, drawn from the year low of $61.02.
XAG/USD Price Chart – Daily
Silver FAQs
Silver is a precious metal highly traded among investors. It has been historically used as a store of value and a medium of exchange. Although less popular than Gold, traders may turn to Silver to diversify their investment portfolio, for its intrinsic value or as a potential hedge during high-inflation periods. Investors can buy physical Silver, in coins or in bars, or trade it through vehicles such as Exchange Traded Funds, which track its price on international markets.
Silver prices can move due to a wide range of factors. Geopolitical instability or fears of a deep recession can make Silver price escalate due to its safe-haven status, although to a lesser extent than Gold's. As a yieldless asset, Silver tends to rise with lower interest rates. Its moves also depend on how the US Dollar (USD) behaves as the asset is priced in dollars (XAG/USD). A strong Dollar tends to keep the price of Silver at bay, whereas a weaker Dollar is likely to propel prices up. Other factors such as investment demand, mining supply – Silver is much more abundant than Gold – and recycling rates can also affect prices.
Silver is widely used in industry, particularly in sectors such as electronics or solar energy, as it has one of the highest electric conductivity of all metals – more than Copper and Gold. A surge in demand can increase prices, while a decline tends to lower them. Dynamics in the US, Chinese and Indian economies can also contribute to price swings: for the US and particularly China, their big industrial sectors use Silver in various processes; in India, consumers’ demand for the precious metal for jewellery also plays a key role in setting prices.
Silver prices tend to follow Gold's moves. When Gold prices rise, Silver typically follows suit, as their status as safe-haven assets is similar. The Gold/Silver ratio, which shows the number of ounces of Silver needed to equal the value of one ounce of Gold, may help to determine the relative valuation between both metals. Some investors may consider a high ratio as an indicator that Silver is undervalued, or Gold is overvalued. On the contrary, a low ratio might suggest that Gold is undervalued relative to Silver.

Hơn một triệu người dùng dựa vào FXStreet để có dữ liệu thị trường thời gian thực, công cụ biểu đồ, góc nhìn chuyên gia và tin tức Forex. Lịch kinh tế toàn diện và các hội thảo web giáo dục giúp nhà giao dịch luôn cập nhật và đưa ra quyết định có tính toán. FXStreet có khoảng 60 nhân sự, chia giữa trụ sở Barcelona và nhiều khu vực toàn cầu.
Đọc thêm


