
Silver Price Forecast: XAG/USD plummets below $76 as oil price posts fresh weekly high
Bởi Sagar Dua
Đã cập nhật: 23 Apr 2026


BÀI VIẾT PHỔ BIẾN

Silver price (XAG/USD) is down almost 2.3% to near $76.00 during the European trading session on Thursday. The white metal faces selling pressure as oil prices extends its winning streak for the third trading day on Thursday.
- Silver price plunges below $76 as oil prices extend rally amid the closure of the Strait of Hormuz.
- Higher oil prices have boosted global inflation expectations.
- The Fed is expected to hold interest rates steady at their current levels by year-end.
Silver price (XAG/USD) is down almost 2.3% to near $76.00 during the European trading session on Thursday. The white metal faces selling pressure as oil prices extends its winning streak for the third trading day on Thursday.
WTI Oil price jumps to near $95.80 during the day, the highest level in a week, as the Strait of Hormuz, a vital passage to almost 20% of global energy supply, remains closed, despite a ceasefire extension between the United States (US) and Iran.
Tehran remains firm on its vow that the Hormuz will remain closed until the US lifts the blockade on Iranian sea ports, a move that has frozen Iranian business activity.
Higher oil prices result in a sharp increase in inflation expectations globally, a scenario that discourages central banks from reducing interest rates, which eventually diminishes the demand for non-yielding assets, such as Silver.
Meanwhile, a higher US Dollar (USD) due to hopes that the Federal Reserve (Fed) will not cut interest rates this year has also weighed on the Silver price. According to the CME FedWatch tool, the possibility of the Fed holding interest rates steady in the current range of 3.50%3.75% in the December meeting is 76.8%.
During the day, the US Dollar Index (DXY), which tracks the Greenback’s value against six major currencies, posts a fresh weekly high at around 98.70.
Silver technical analysis
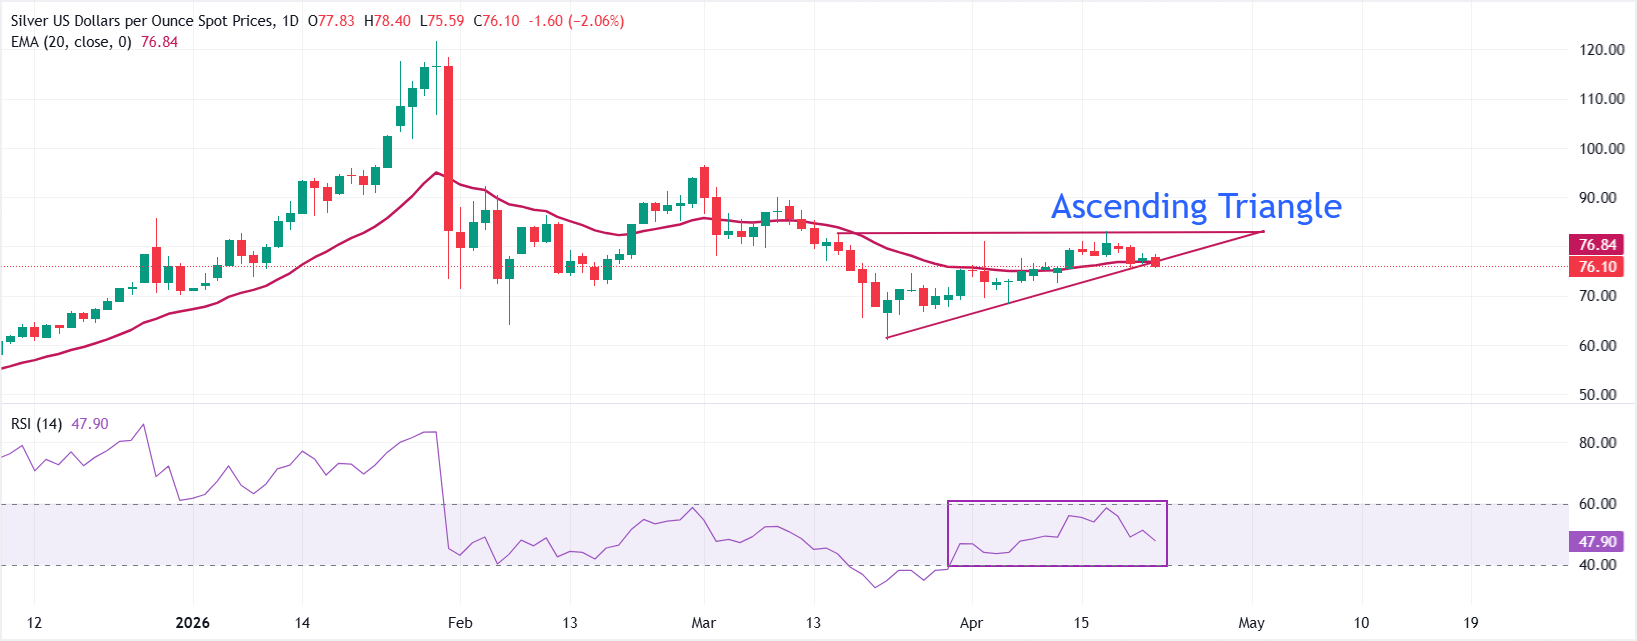
XAG/USD trades lower at around $76 as of writing. The overall trend of the white metal appears to be uncertain as it is on the verge of an Ascending Triangle breakdown. The 20-day Exponential Moving Average (EMA) at $76.84 caps the upside as immediate resistance.
The Relative Strength Index (RSI) at 47.85 sits just below the neutral 50 line, hinting at fading bullish momentum rather than outright oversold conditions.
On the topside, the horizontal barrier of the Ascending Triangle formation at around $83.00 is the key resistance for the price. A daily close above $83 would extend the rally towards the psychological level of $90.00. Until those levels are recovered, the metal remains vulnerable to further downside towards the April 13 low at around $72.60, followed by the April 7 low of $68.28.
(The technical analysis of this story was written with the help of an AI tool.)
Silver FAQs
Silver is a precious metal highly traded among investors. It has been historically used as a store of value and a medium of exchange. Although less popular than Gold, traders may turn to Silver to diversify their investment portfolio, for its intrinsic value or as a potential hedge during high-inflation periods. Investors can buy physical Silver, in coins or in bars, or trade it through vehicles such as Exchange Traded Funds, which track its price on international markets.
Silver prices can move due to a wide range of factors. Geopolitical instability or fears of a deep recession can make Silver price escalate due to its safe-haven status, although to a lesser extent than Gold's. As a yieldless asset, Silver tends to rise with lower interest rates. Its moves also depend on how the US Dollar (USD) behaves as the asset is priced in dollars (XAG/USD). A strong Dollar tends to keep the price of Silver at bay, whereas a weaker Dollar is likely to propel prices up. Other factors such as investment demand, mining supply – Silver is much more abundant than Gold – and recycling rates can also affect prices.
Silver is widely used in industry, particularly in sectors such as electronics or solar energy, as it has one of the highest electric conductivity of all metals – more than Copper and Gold. A surge in demand can increase prices, while a decline tends to lower them. Dynamics in the US, Chinese and Indian economies can also contribute to price swings: for the US and particularly China, their big industrial sectors use Silver in various processes; in India, consumers’ demand for the precious metal for jewellery also plays a key role in setting prices.
Silver prices tend to follow Gold's moves. When Gold prices rise, Silver typically follows suit, as their status as safe-haven assets is similar. The Gold/Silver ratio, which shows the number of ounces of Silver needed to equal the value of one ounce of Gold, may help to determine the relative valuation between both metals. Some investors may consider a high ratio as an indicator that Silver is undervalued, or Gold is overvalued. On the contrary, a low ratio might suggest that Gold is undervalued relative to Silver.

Hơn một triệu người dùng dựa vào FXStreet để có dữ liệu thị trường thời gian thực, công cụ biểu đồ, góc nhìn chuyên gia và tin tức Forex. Lịch kinh tế toàn diện và các hội thảo web giáo dục giúp nhà giao dịch luôn cập nhật và đưa ra quyết định có tính toán. FXStreet có khoảng 60 nhân sự, chia giữa trụ sở Barcelona và nhiều khu vực toàn cầu.
Đọc thêm


