
Silver rebounds from year-to-date lows but bearish outlook remains intact
Bởi Vishal Chaturvedi
Ngày xuất bản: 23 Mar 2026 | Ngày chỉnh sửa: 23 Mar 2026


BÀI VIẾT PHỔ BIẾN

Silver (XAG/USD) stages a rebound on Monday after briefly slipping to year-to-date lows earlier in the Asian trading session, as traders digest conflicting headlines surrounding geopolitical tensions linked to the US-Israel war with Iran.
- Silver rebounds after hitting year-to-date lows as the US Dollar and yields retreat.
- Geopolitical headlines drive volatility, with mixed signals from the US and Iran.
- Bearish momentum persists despite the intraday recovery.
Silver (XAG/USD) stages a rebound on Monday after briefly slipping to year-to-date lows earlier in the Asian trading session, as traders digest conflicting headlines surrounding geopolitical tensions linked to the US-Israel war with Iran. At the time of writing, XAG/USD trades near $68.00, recovering from an intraday low around $61.01, its weakest level since December 2025.
The white metal trimmed earlier losses as the US Dollar (USD) and Treasury yields pulled back following US President Donald Trump’s decision to delay planned strikes on Iran’s energy infrastructure. Trump said he had instructed the Department of War to postpone strikes on Iranian power plants for five days, subject to the outcome of ongoing discussions.
However, gains remain limited after Iranian officials downplayed the prospect of negotiations. Parliament Speaker Mohammad Bagher Ghalibaf said no talks have been held with the United States. Meanwhile, Iran’s Foreign Ministry reiterated that its stance on the Strait of Hormuz and conditions to end the war remain unchanged, adding that Tehran has not responded to messages relayed by other countries regarding US requests for talks, according to IRNA.
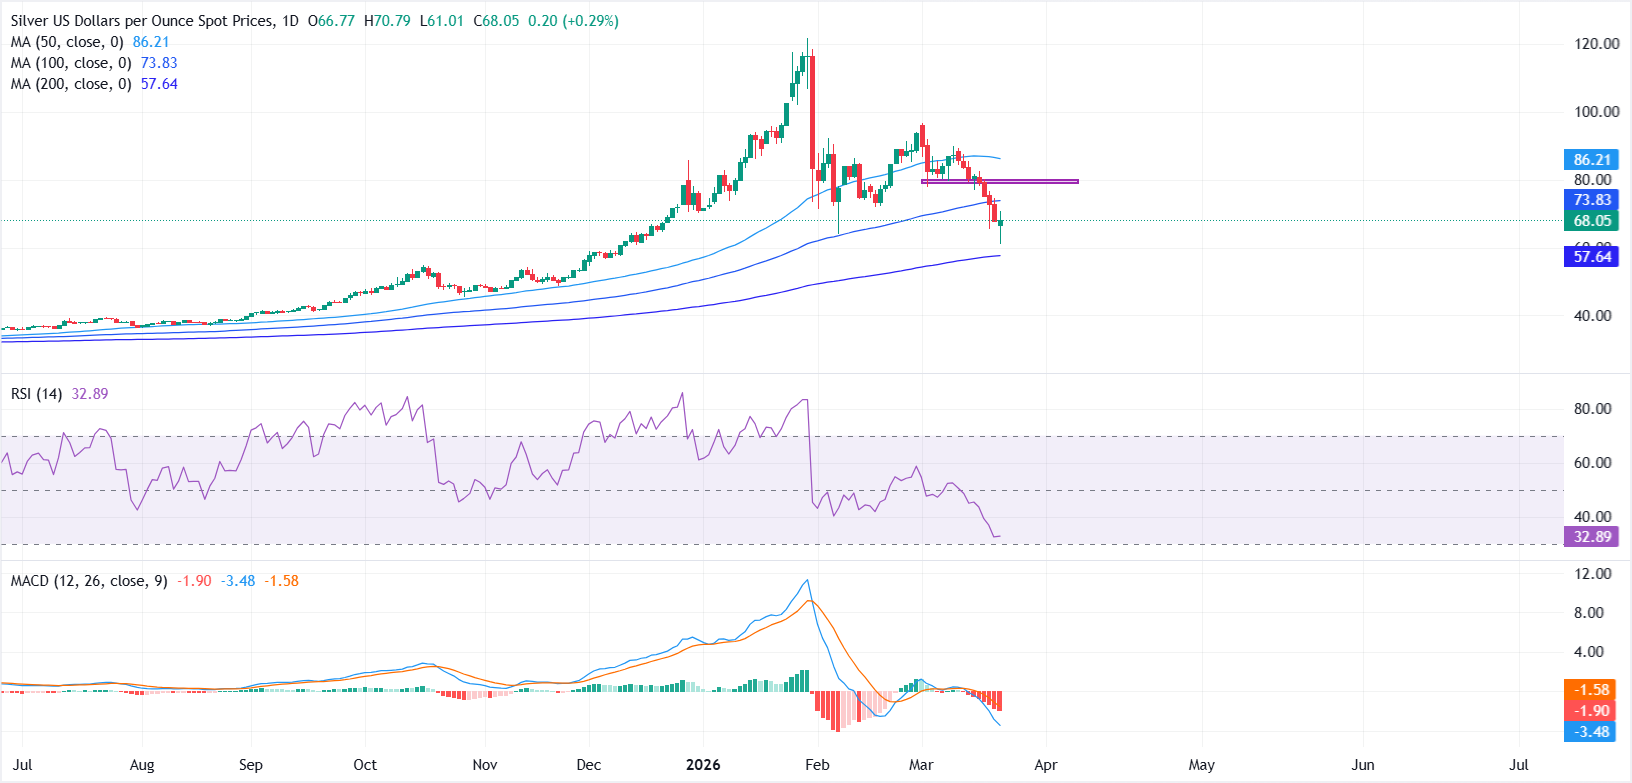
In the daily chart, the near-term bias remains bearish as price trades below the 50-day SMA at $86.20 and the 100-day SMA around $73.80. However, the 200-day SMA near $57.60 continues to slope higher, indicating that the broader uptrend remains intact for now.
Momentum indicators reinforce the downside outlook. The Relative Strength Index (RSI) hovers near 34, holding below the 50 mark and pointing to sustained bearish momentum. Meanwhile, the Moving Average Convergence Divergence (MACD) remains below the signal line and in negative territory, with a modestly negative histogram, suggesting sellers continue to dominate in the short term.
On the upside, immediate resistance is seen at the 100-day SMA near $73.80, followed by the $78.00–$80.00 zone, which previously acted as a key breakdown area. A sustained move above the 50-day SMA at $86.20 would be needed to shift the current bearish structure.
On the downside, immediate support lies at Monday’s low near $61.01, followed by the 200-day SMA around $57.60. A break below this level could expose deeper losses toward the $50.00 psychological mark.
Silver FAQs
Silver is a precious metal highly traded among investors. It has been historically used as a store of value and a medium of exchange. Although less popular than Gold, traders may turn to Silver to diversify their investment portfolio, for its intrinsic value or as a potential hedge during high-inflation periods. Investors can buy physical Silver, in coins or in bars, or trade it through vehicles such as Exchange Traded Funds, which track its price on international markets.
Silver prices can move due to a wide range of factors. Geopolitical instability or fears of a deep recession can make Silver price escalate due to its safe-haven status, although to a lesser extent than Gold's. As a yieldless asset, Silver tends to rise with lower interest rates. Its moves also depend on how the US Dollar (USD) behaves as the asset is priced in dollars (XAG/USD). A strong Dollar tends to keep the price of Silver at bay, whereas a weaker Dollar is likely to propel prices up. Other factors such as investment demand, mining supply – Silver is much more abundant than Gold – and recycling rates can also affect prices.
Silver is widely used in industry, particularly in sectors such as electronics or solar energy, as it has one of the highest electric conductivity of all metals – more than Copper and Gold. A surge in demand can increase prices, while a decline tends to lower them. Dynamics in the US, Chinese and Indian economies can also contribute to price swings: for the US and particularly China, their big industrial sectors use Silver in various processes; in India, consumers’ demand for the precious metal for jewellery also plays a key role in setting prices.
Silver prices tend to follow Gold's moves. When Gold prices rise, Silver typically follows suit, as their status as safe-haven assets is similar. The Gold/Silver ratio, which shows the number of ounces of Silver needed to equal the value of one ounce of Gold, may help to determine the relative valuation between both metals. Some investors may consider a high ratio as an indicator that Silver is undervalued, or Gold is overvalued. On the contrary, a low ratio might suggest that Gold is undervalued relative to Silver.

Hơn một triệu người dùng dựa vào FXStreet để có dữ liệu thị trường thời gian thực, công cụ biểu đồ, góc nhìn chuyên gia và tin tức Forex. Lịch kinh tế toàn diện và các hội thảo web giáo dục giúp nhà giao dịch luôn cập nhật và đưa ra quyết định có tính toán. FXStreet có khoảng 60 nhân sự, chia giữa trụ sở Barcelona và nhiều khu vực toàn cầu.
Đọc thêm


