
Solana Price Forecast: ETFs and derivatives data flash caution as SOL recovers
Bởi Vishal Dixit
Đã cập nhật: 30 Mar 2026


BÀI VIẾT PHỔ BIẾN

Solana (SOL) price is up over 2% at press time on Monday, staging a minor recovery after four consecutive days of losses, bringing the total to a 5% drop last week.
- Solana ticks higher by over 2% on Monday after four straight days of losses, holding above $80.
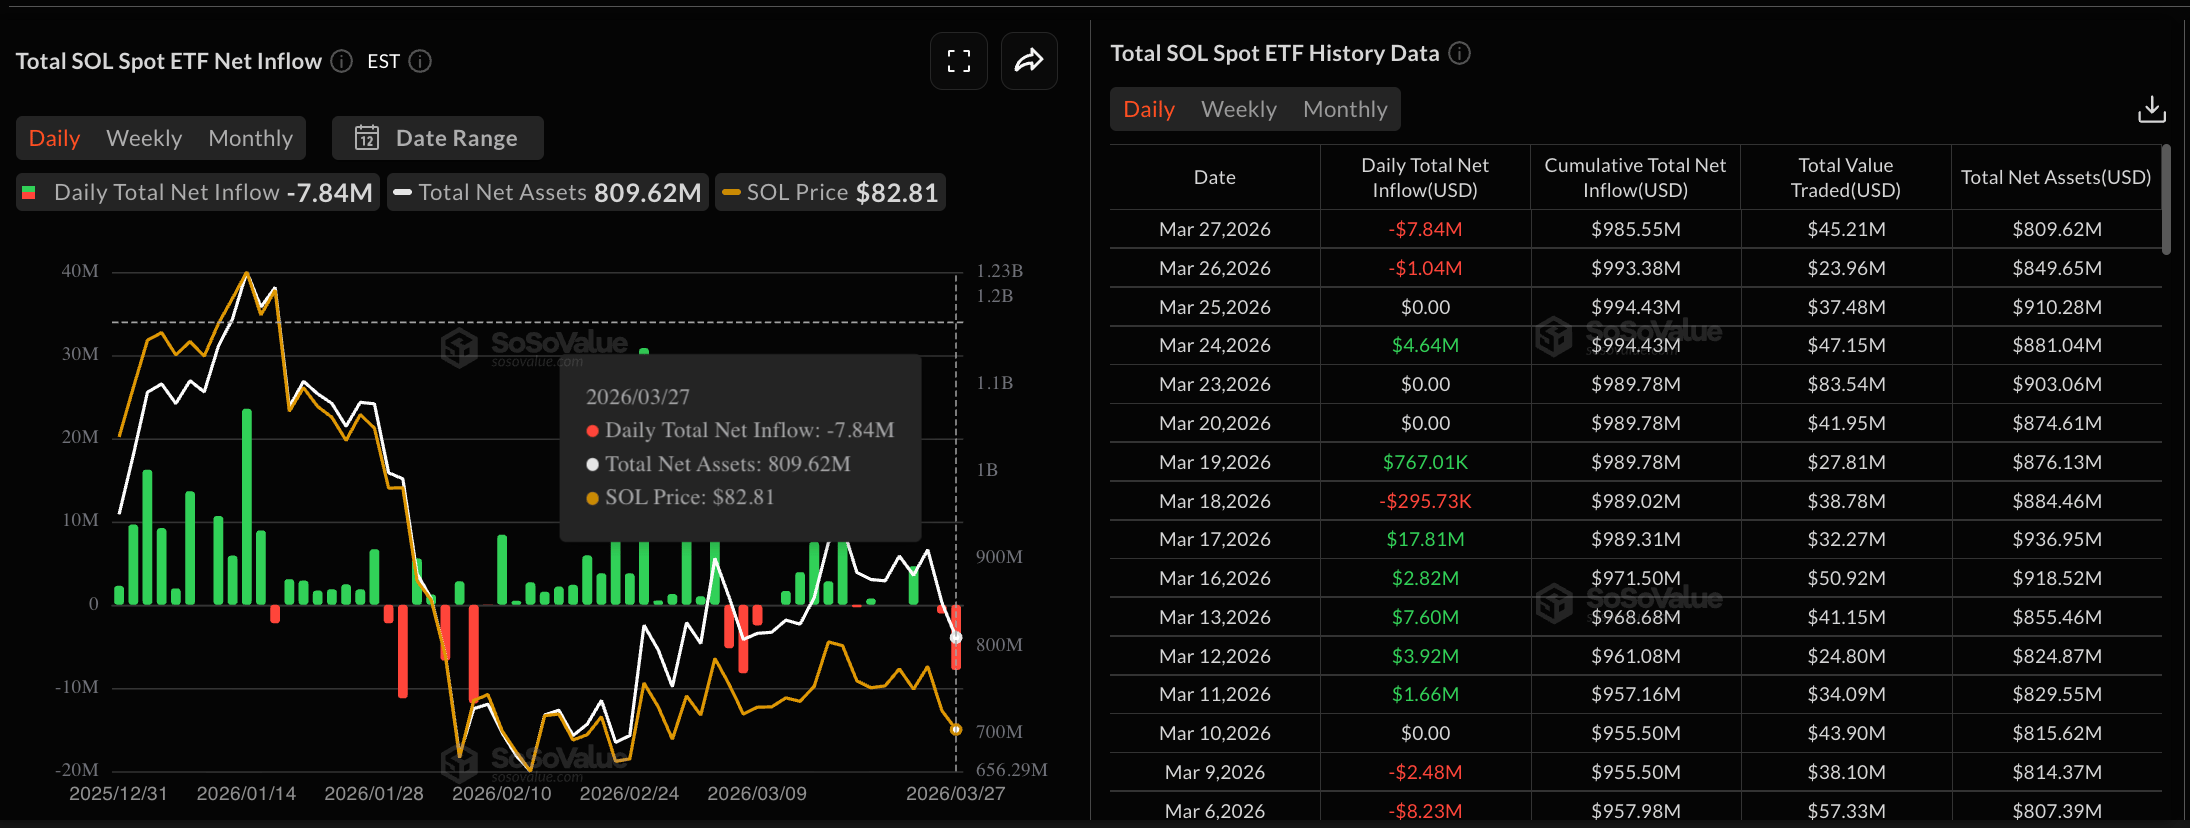
- SOL-focused ETFs recorded their fourth-largest daily outflow on Friday, reflecting a rebalancing as institutional confidence shocks.
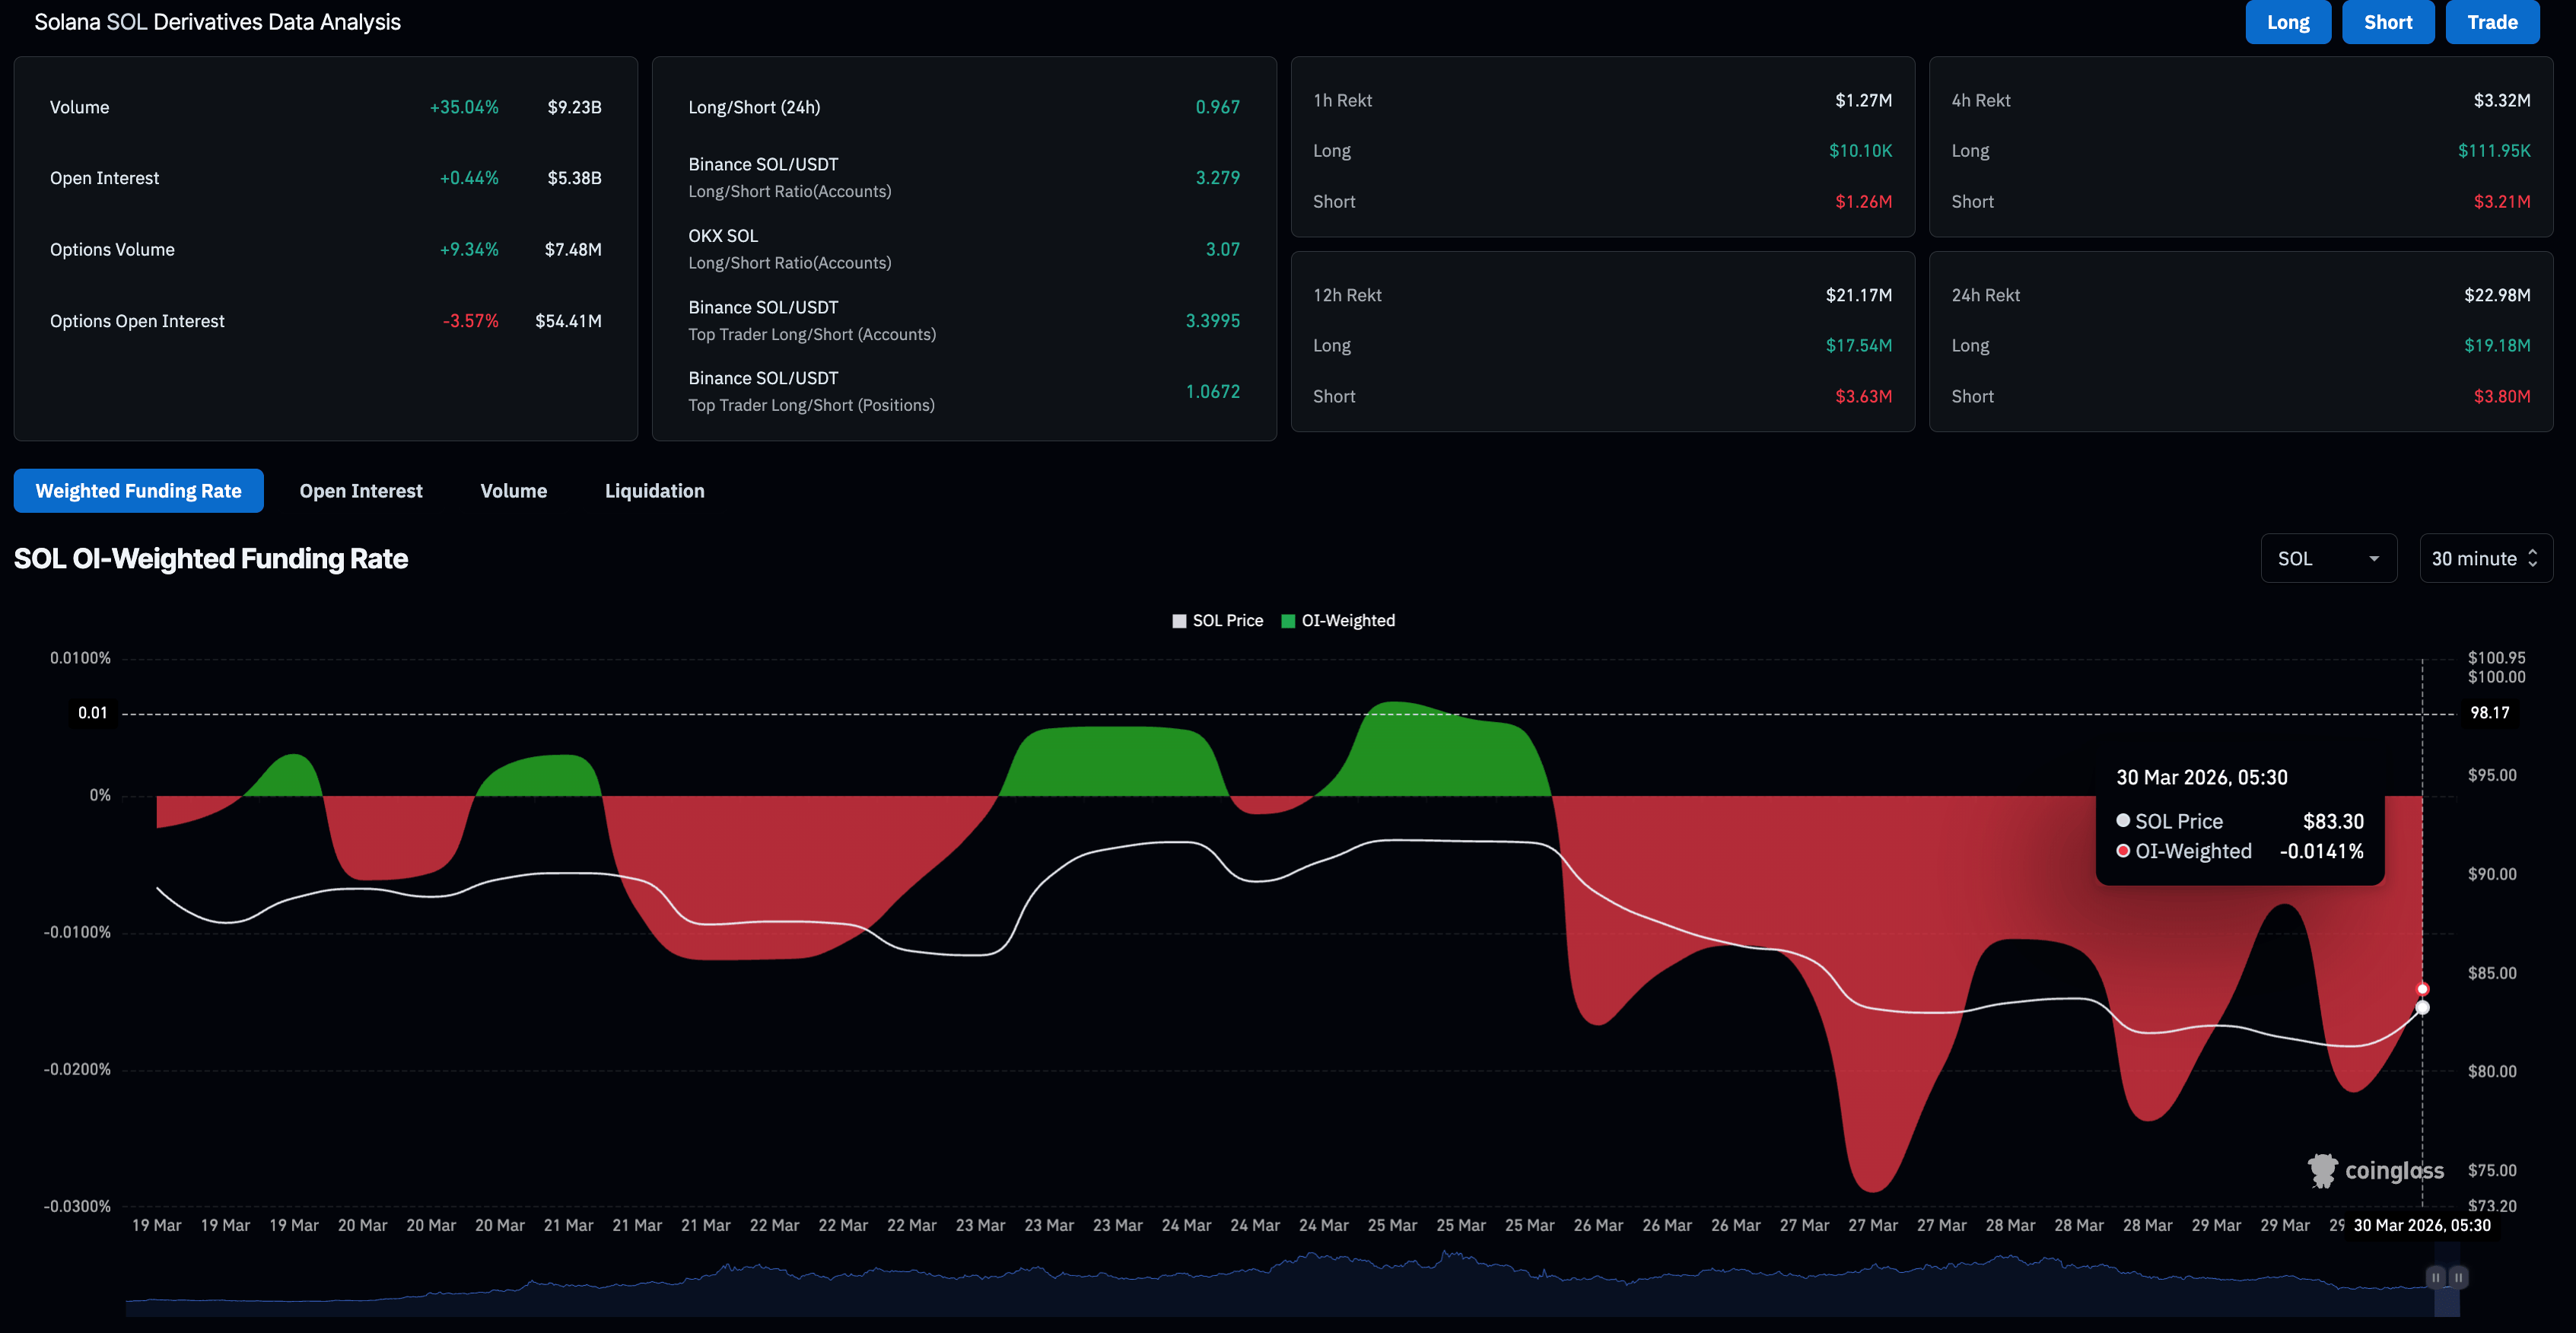
- Derivatives data shows a bearish incline among traders amid negative funding rates and a larger wipeout of long positions.
Solana (SOL) price is up over 2% at press time on Monday, staging a minor recovery after four consecutive days of losses, bringing the total to a 5% drop last week. However, institutional confidence in Solana took a hit on Friday with an outflow of roughly $8 million, while derivatives data reflects a bearish stance amid negative funding rates.
The technical outlook for Solana is mixed, as the short-term recovery requires a successful daily close to confirm renewed demand.
Confidence declines in Solana
CoinGlass data shows that the US spot Solana Exchange Traded Funds (ETFs) recorded $7.84 million in outflows on Friday, marking the fourth-largest daily outflow and third weekly net negative flow. If institutions consistently record outflows this week, it would mount further downside pressure on Solana.
Meanwhile, Solana derivatives witnessed $22.98 million in liquidations over the last 24 hours, led by $19.18 million of long liquidations, suggesting that broadly bullish positions were wiped out. The negative funding rate of -0.0141% reaffirms traders' bearish sentiment, with short positions trading at a premium.
Technical outlook: Will Solana continue to hold ground above $80?
Solana shows recovery on Monday after a four-day decline, which broke below the rising support trendline near $88.00, shifting its message from underpinning strength to a completed topping structure. The near-term bias leans bearish as price holds well below the clustered 50-, 100-, and 200-day Exponential Moving Averages (EMAs), which underline a broader downtrend.
This recovery in SOL could face immediate resistance near the trendline breakout area around $88.00, close to the 50-day EMA at $91.24.
Momentum has cooled, with the Moving Average Convergence Divergence (MACD) indicator slipping into negative territory and crossing below the signal line, suggesting renewed selling pressure. The Relative Strength Index (RSI) at 42 sits below the midline, reinforcing the view that bears retain control despite the absence of oversold conditions.
On the downside, immediate support is at Sunday's low at $81.44, where a break would open the way toward the prior reaction base at the February 24 low at $75.63, which started the former rising trend line. Below that, the broader bearish extension would expose deeper retracement levels toward earlier consolidation zones, while only a daily close back above $91.00 would begin to question the current bearish bias.
(The technical analysis of this story was written with the help of an AI tool.)

Hơn một triệu người dùng dựa vào FXStreet để có dữ liệu thị trường thời gian thực, công cụ biểu đồ, góc nhìn chuyên gia và tin tức Forex. Lịch kinh tế toàn diện và các hội thảo web giáo dục giúp nhà giao dịch luôn cập nhật và đưa ra quyết định có tính toán. FXStreet có khoảng 60 nhân sự, chia giữa trụ sở Barcelona và nhiều khu vực toàn cầu.
Đọc thêm


