
Solana Price Forecast: SOL flashes breakout potential on steady derivatives, ETF demand
Bởi Vishal Dixit
Ngày xuất bản: 8 Dec 2025 | Ngày chỉnh sửa: 8 Dec 2025


BÀI VIẾT PHỔ BIẾN

Solana (SOL) edges higher by almost 5% at press time on Monday after a Doji candle formation on Sunday. Derivatives data indicate a rise in funding rate, signaling reduced incentive for traders to hold short positions.
- Solana rises nearly 5% on Monday, with bulls aiming to exceed the overhead resistance trendline.
- Derivatives data indicate a rise in funding rate, signaling reduced bearish interest among traders.
- Solana ETFs recorded mild inflows last week, suggesting reduced institutional interest, but marked the sixth straight week of inflows.
Solana (SOL) edges higher by almost 5% at press time on Monday after a Doji candle formation on Sunday. Derivatives data indicate a rise in funding rate, signaling reduced incentive for traders to hold short positions. Meanwhile, the Solana-focused Exchange Traded Funds (ETFs) mark their sixth consecutive week of inflows, indicating a steady interest from institutional investors.
The technical outlook of Solana puts a local resistance trendline that has remained intact since October 6 in focus.
Steady demand for Solana signals improving sentiment
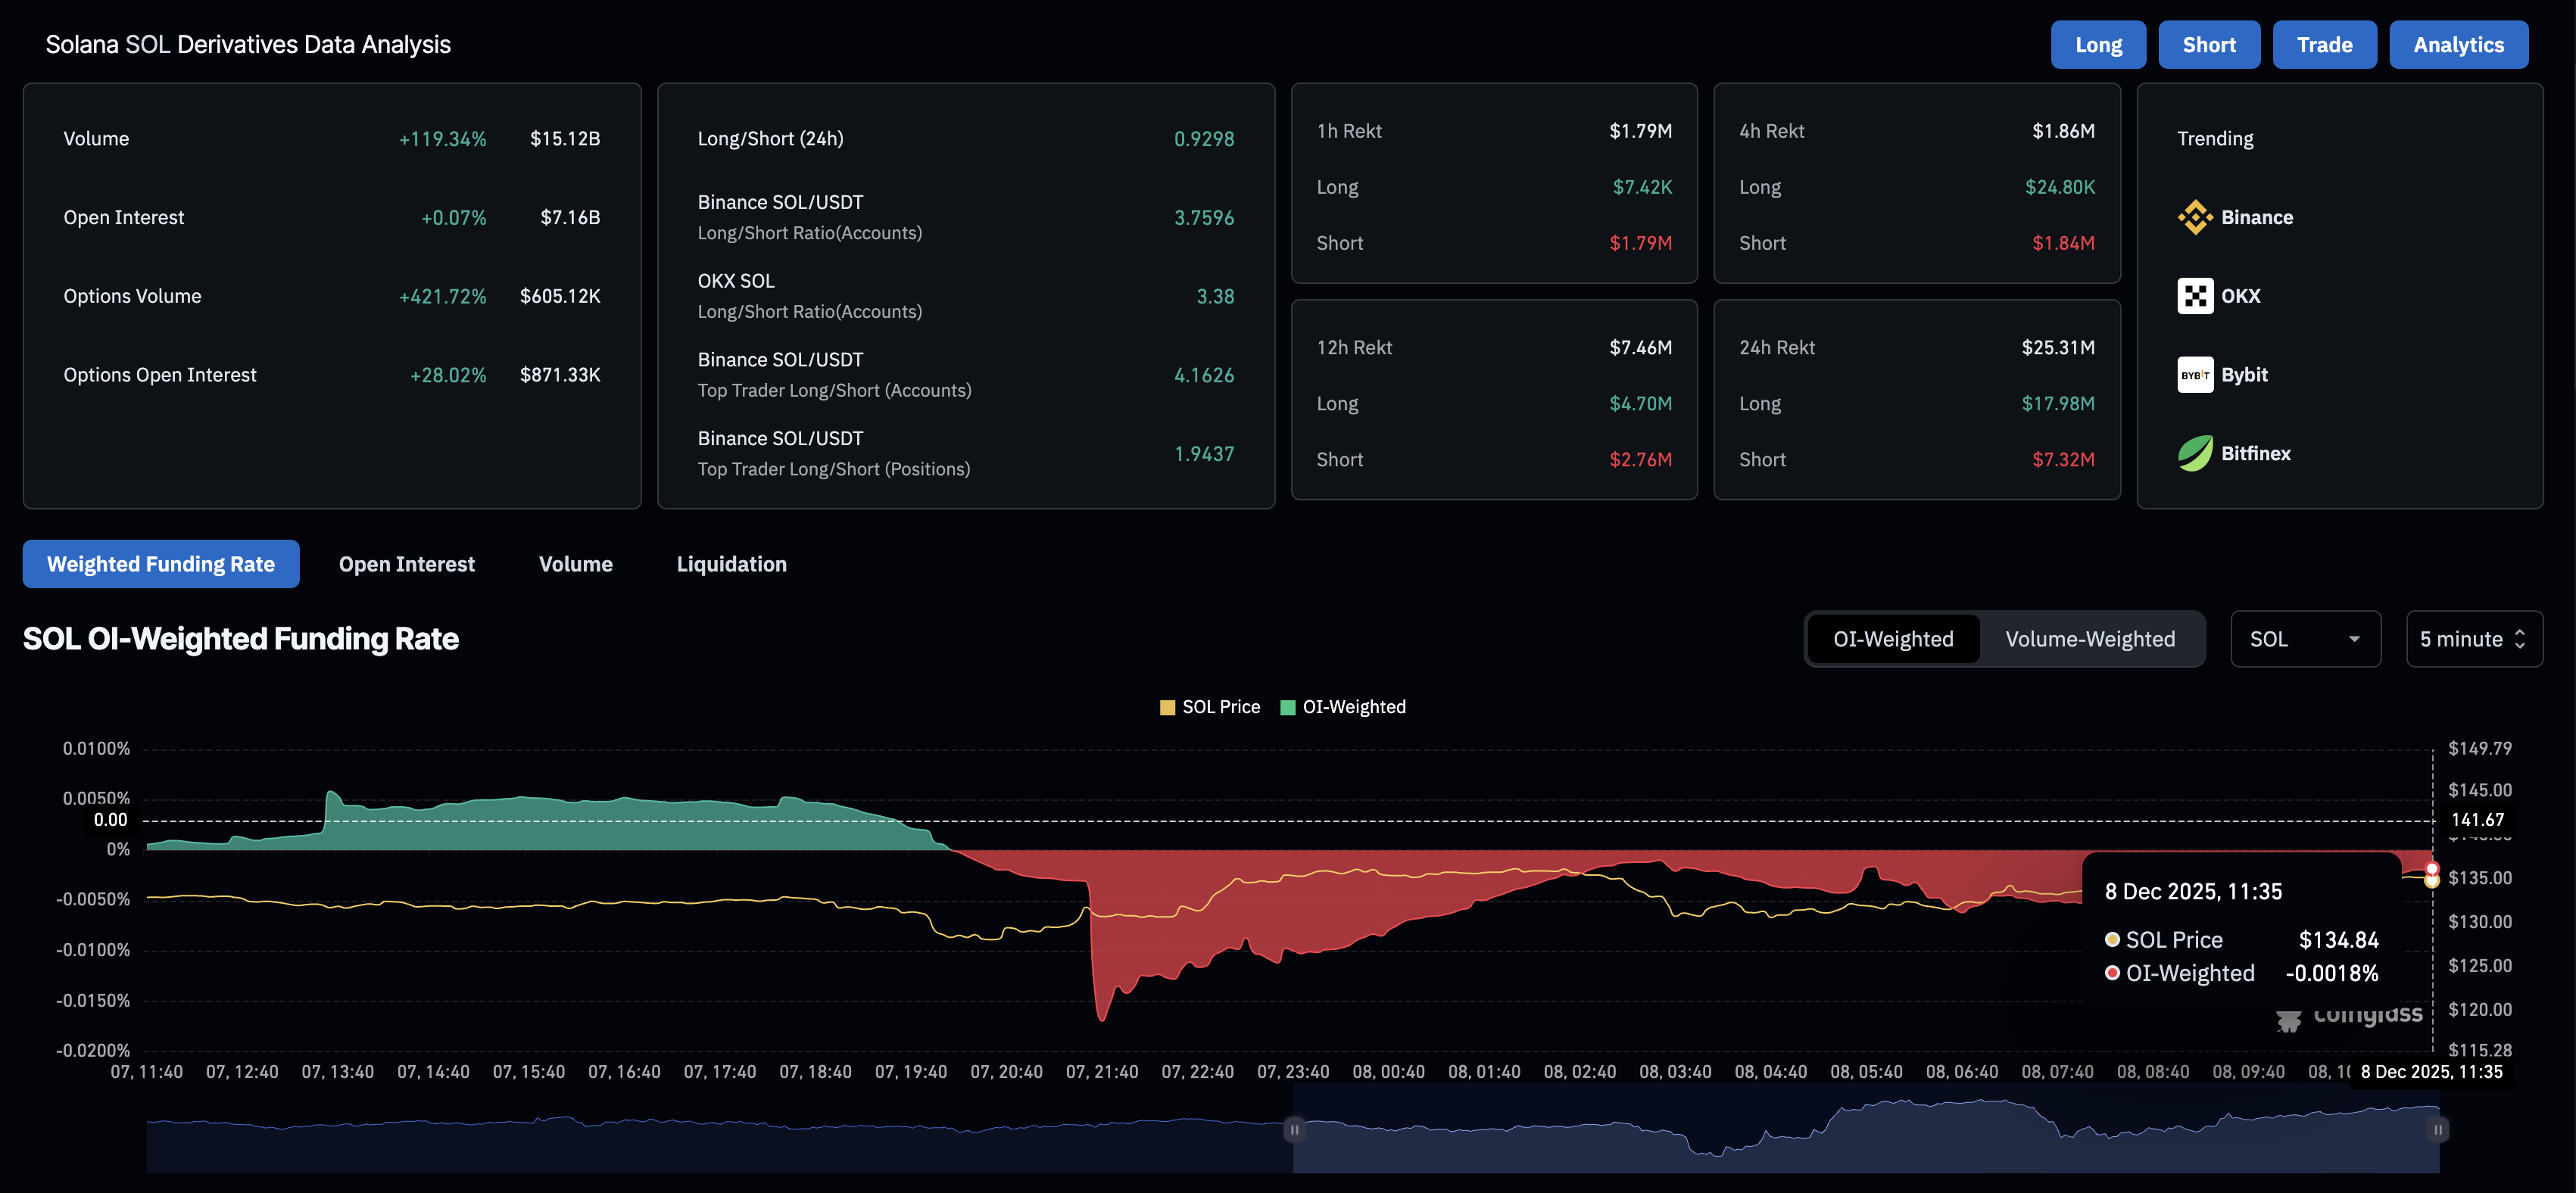
Solana’s futures Open Interest (OI) remains steady above $7 billion, suggesting a near flat capital flow in SOL derivatives. CoinGlass data shows SOL futures OI at $7.16 billion on Monday, broadly stable over the last 24 hours.
However, the rise in OI-weighted funding rate indicates that the interest in holding short positions has significantly decreased. The funding rate stands at -0.0018%, up from -0.170% on Sunday. If funding rates flip positive, it would signal a rise in bullish confidence as bulls will pay a premium to hold long positions.
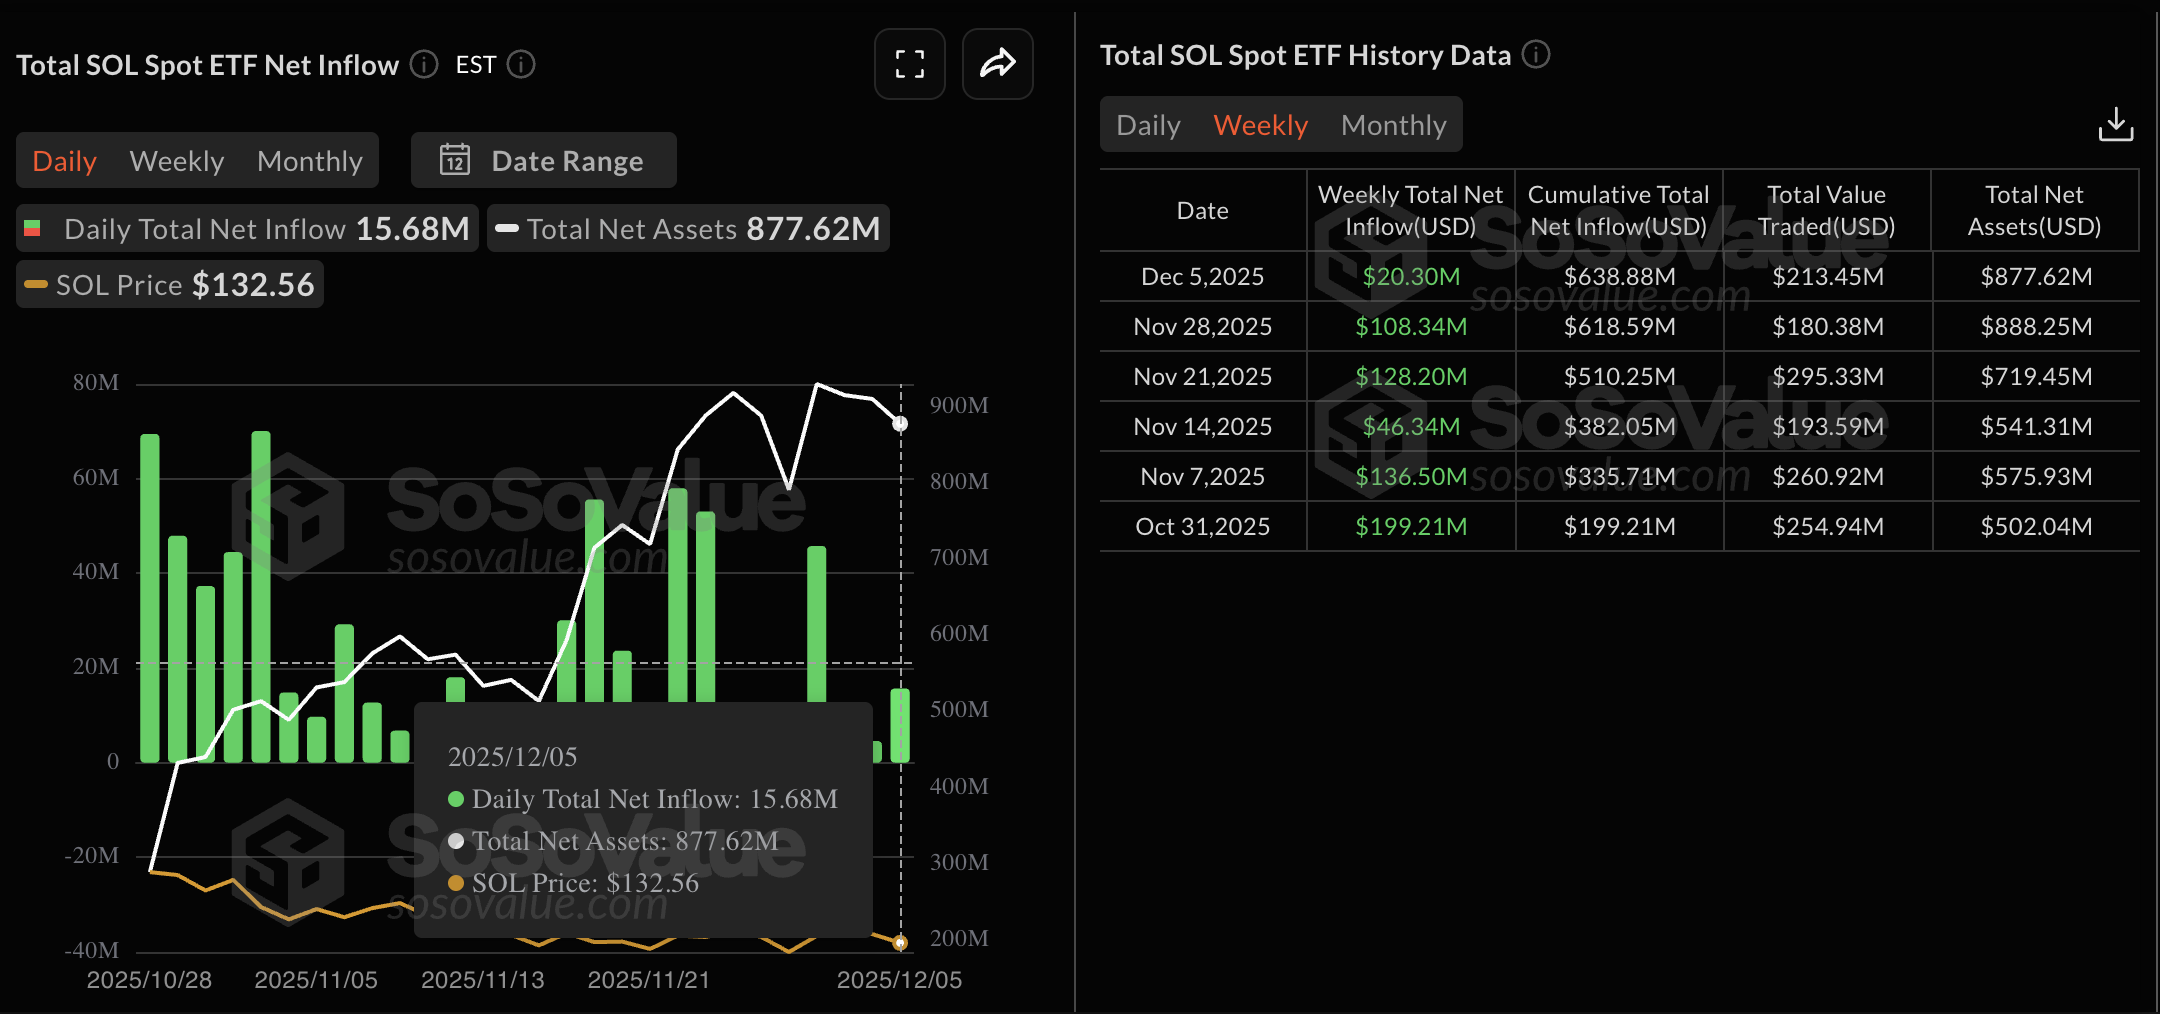
Meanwhile, the institutional interest in Solana has decreased, with $20.30 million in net weekly inflows into SOL ETFs, down from $108.34 million the previous week. Still, the $15.68 million in inflows on Friday extended the streak of weekly inflows to six consecutive weeks.
Solana gains traction, aiming to challenge a crucial resistance trendline
Solana floats above the $121- $127 demand zone on Monday, aiming for the resistance trendline connecting the October 6 and 27 highs, near $140. The short-term recovery in the high-speed blockchain token could confirm the bullish breakout with a decisive daily close above $140.
Solana’s potential breakout rally could face opposition from the declining 50-day and 200-day Exponential Moving Averages (EMAs) at $153 and $173, respectively.
The technical indicators on the daily chart suggest a positive shift in trend momentum. The Relative Strength Index (RSI) at 45 points, upside toward midline, signals a neutral shift from a bearish bias.
Meanwhile, the Moving Average Convergence Divergence (MACD) extends a steady upward trend above its signal line, signaling bullish momentum on edge as a potential crossover could flash renewed bearish pressure.
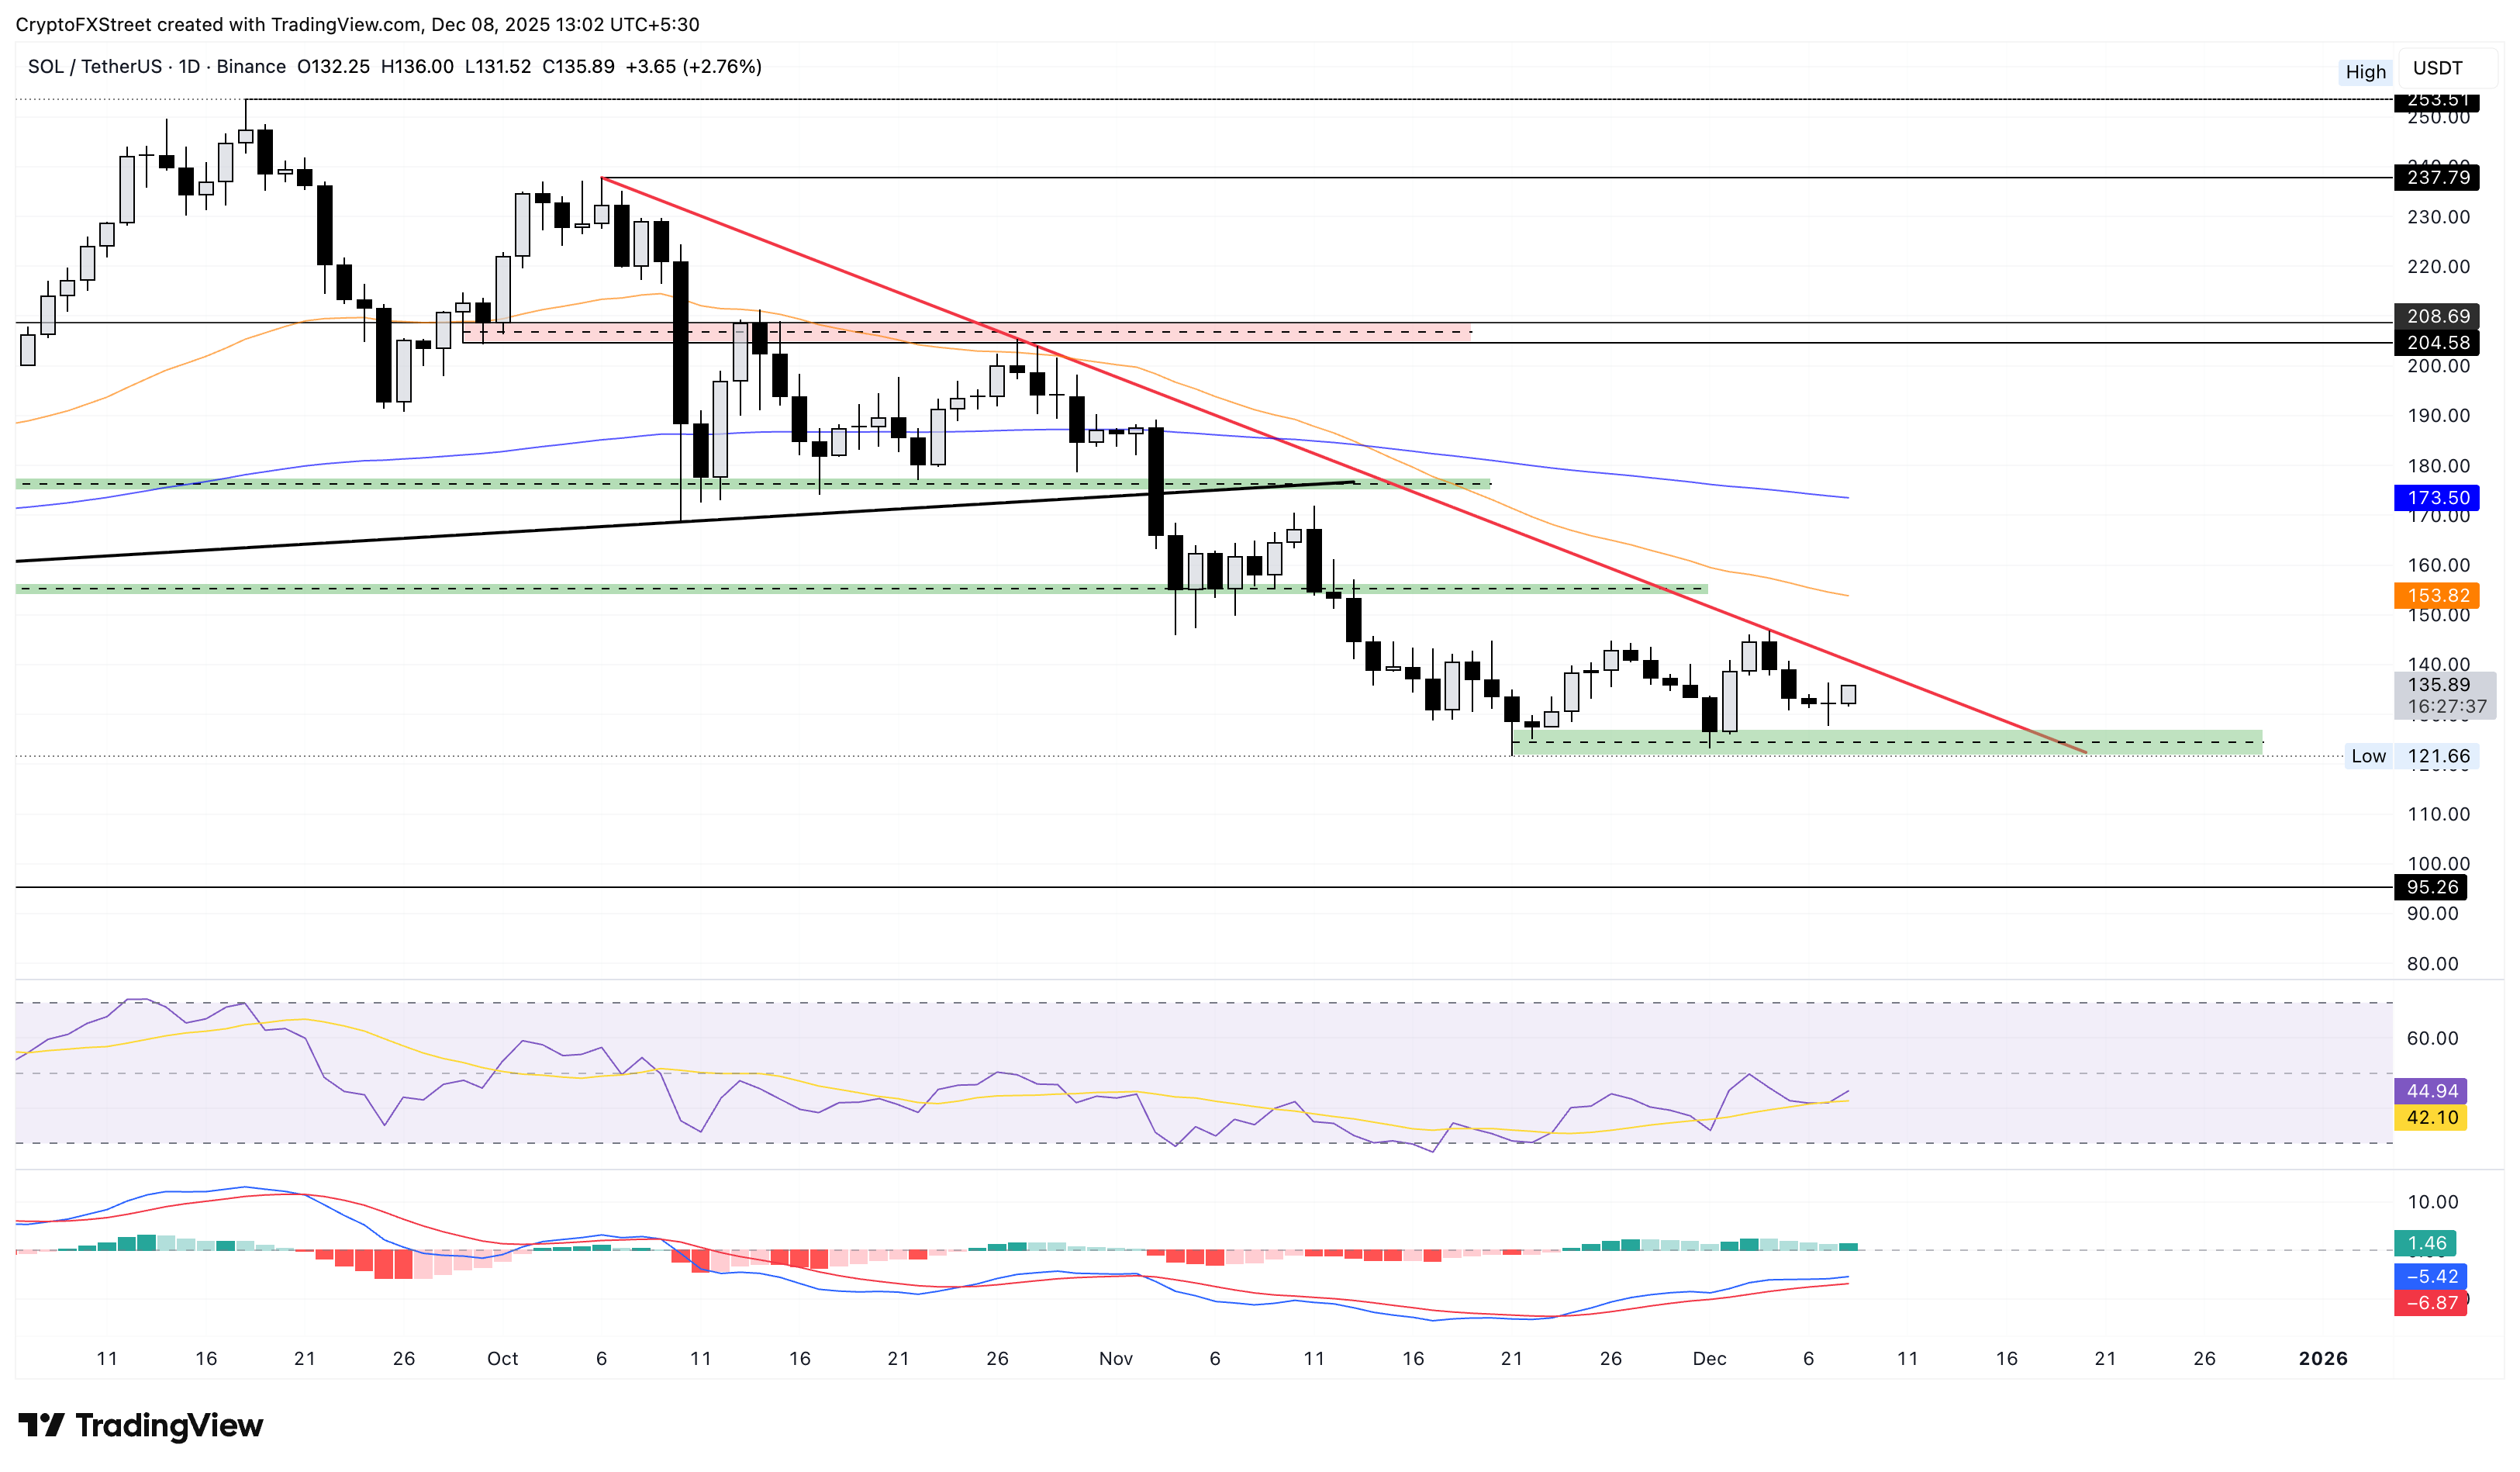
Looking down, if SOL closes below $121, the bears could target April’s low at $95.

Hơn một triệu người dùng dựa vào FXStreet để có dữ liệu thị trường thời gian thực, công cụ biểu đồ, góc nhìn chuyên gia và tin tức Forex. Lịch kinh tế toàn diện và các hội thảo web giáo dục giúp nhà giao dịch luôn cập nhật và đưa ra quyết định có tính toán. FXStreet có khoảng 60 nhân sự, chia giữa trụ sở Barcelona và nhiều khu vực toàn cầu.
Đọc thêm


