
Solana Price Forecast: SOL recovery at risk as institutions weigh long-term exposure
Bởi Vishal Dixit
Ngày xuất bản: 6 Mar 2026 | Ngày chỉnh sửa: 6 Mar 2026


BÀI VIẾT PHỔ BIẾN

Solana (SOL) price edges lower below $90 at press time on Friday, following a 2% decline the previous day, and risks a bearish flip within a broader consolidation range. Data shows cumulative flow in Solana Exchange Traded Funds (ETFs) holds strong, reflecting committed institutional demand.
- Solana edges lower on Friday after a 2% fall the previous day, suggesting strong resistance above $90.
- Cumulative Solana ETF flows haven't fallen despite the token's price decline since their launch, highlighting committed institutional demand.
- Derivatives market holds a bearish outlook as both Solana futures Open Interest and funding rate fall amid intense long liquidations.
Solana (SOL) price edges lower below $90 at press time on Friday, following a 2% decline the previous day, and risks a bearish flip within a broader consolidation range. Data shows cumulative flow in Solana Exchange Traded Funds (ETFs) holds strong, reflecting committed institutional demand. Retail interest in Solana remains volatile, as a spike in long liquidations leads to positional unwinding in SOL derivatives and a negative funding rate. Technically, headwinds above $90 keep the recovery in check, risking a correction to $77.
Institutions shows long term commitment to Solana
Institutional demand for Solana remains strong since the launch of SOL-focused ETFs in the US market. Bloomberg analyst Eric Balchunas recently shared on his X account that the steady rise in cumulative inflows in Solana ETFs peaked at $1.45 billion on Tuesday, up from $0.41 billion on October 23.
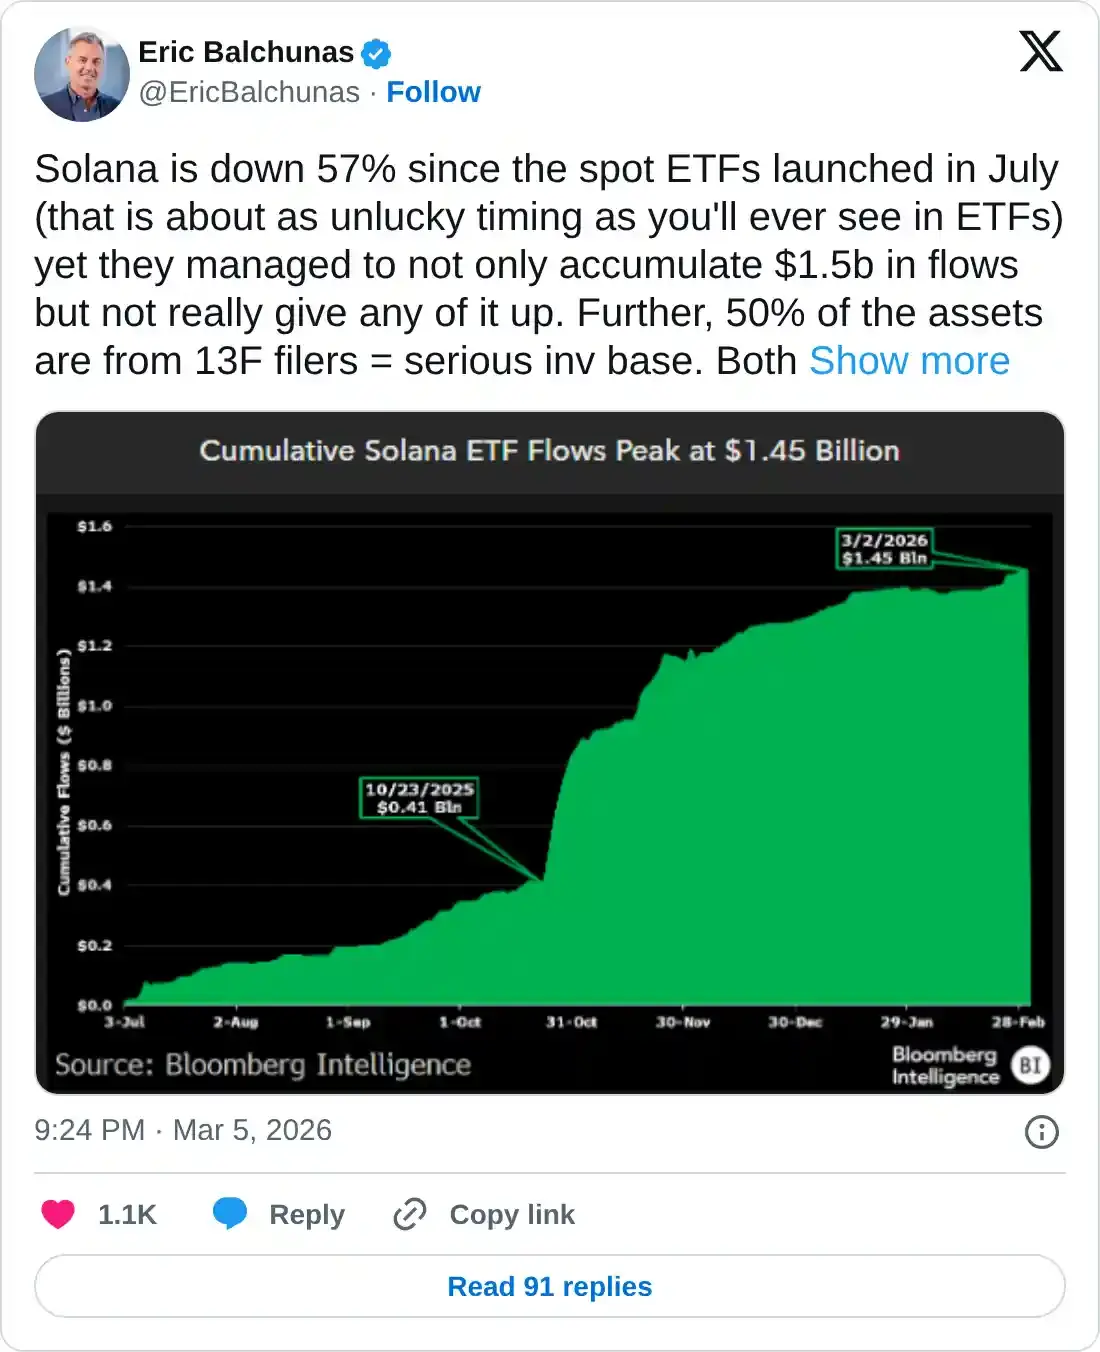
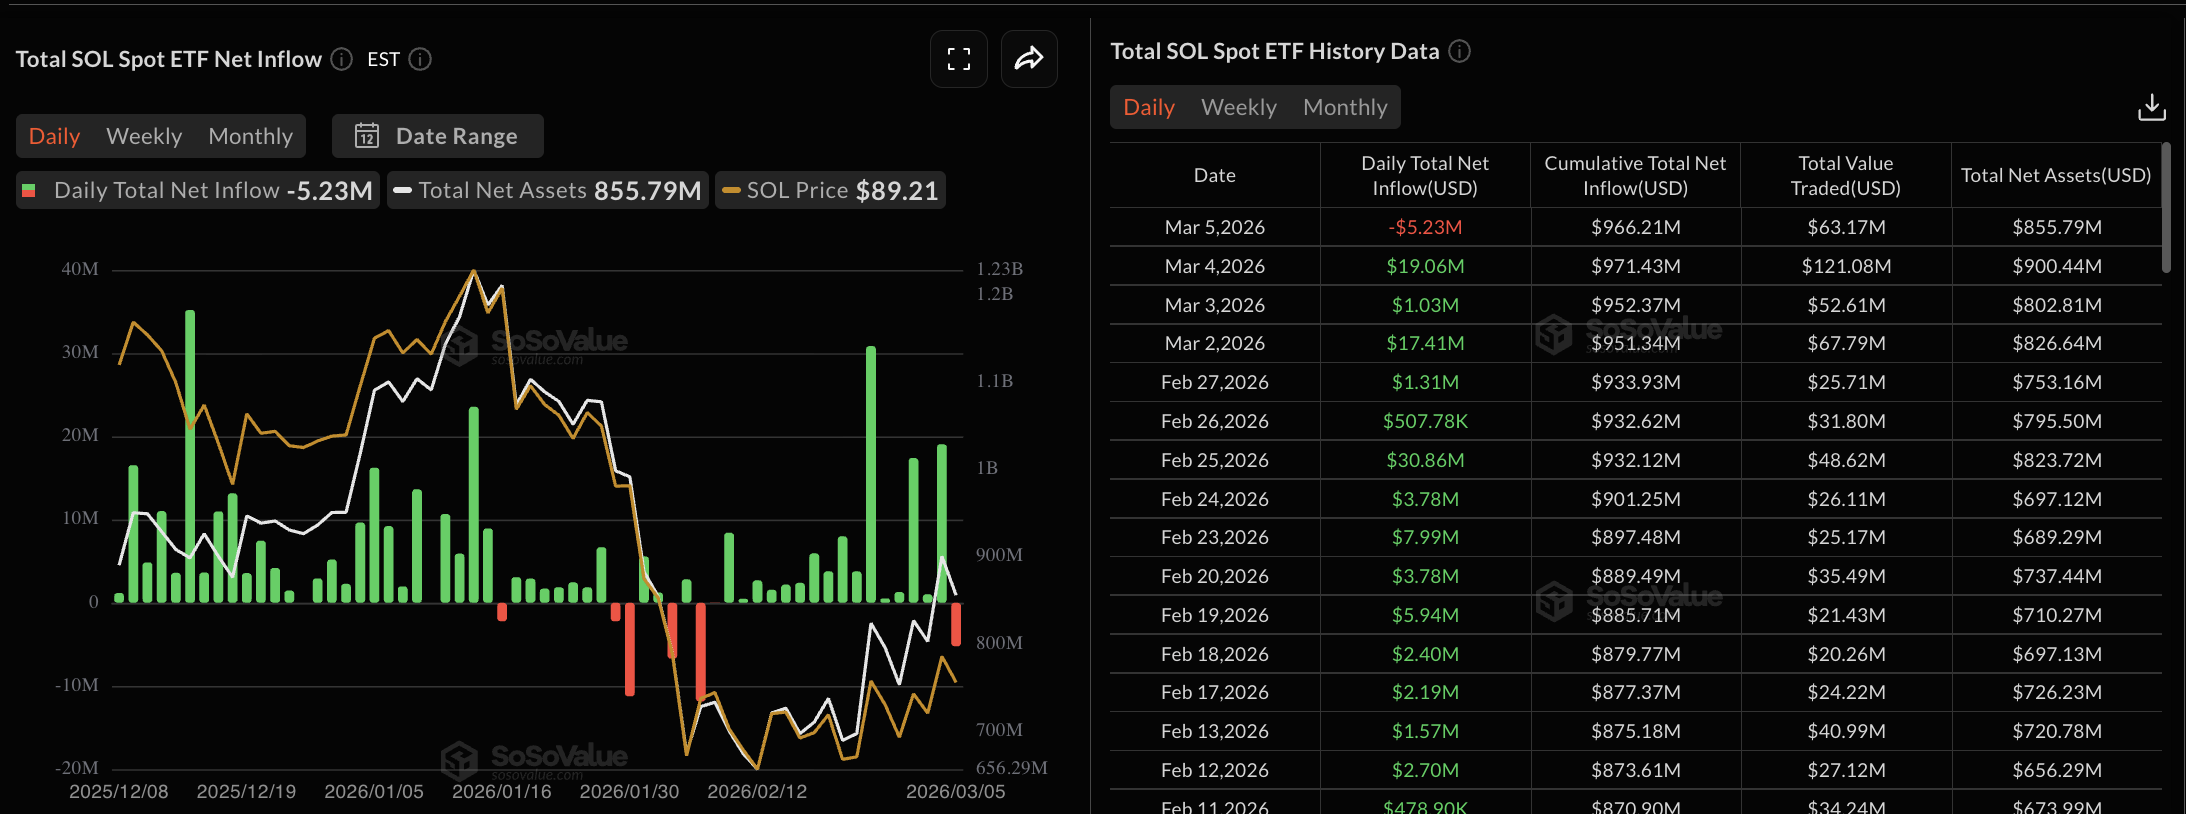
Meanwhile, minimal and occasional outflows, such as $5.23 million on Thursday, suggest that ETFs largely retain their holdings despite the SOL price falling below $100.
Balchunas further highlighted that the majority of these holdings stem from 13F filings, backed by institutional investors focused on the long term.
Derivatives data point to a weak retail audience
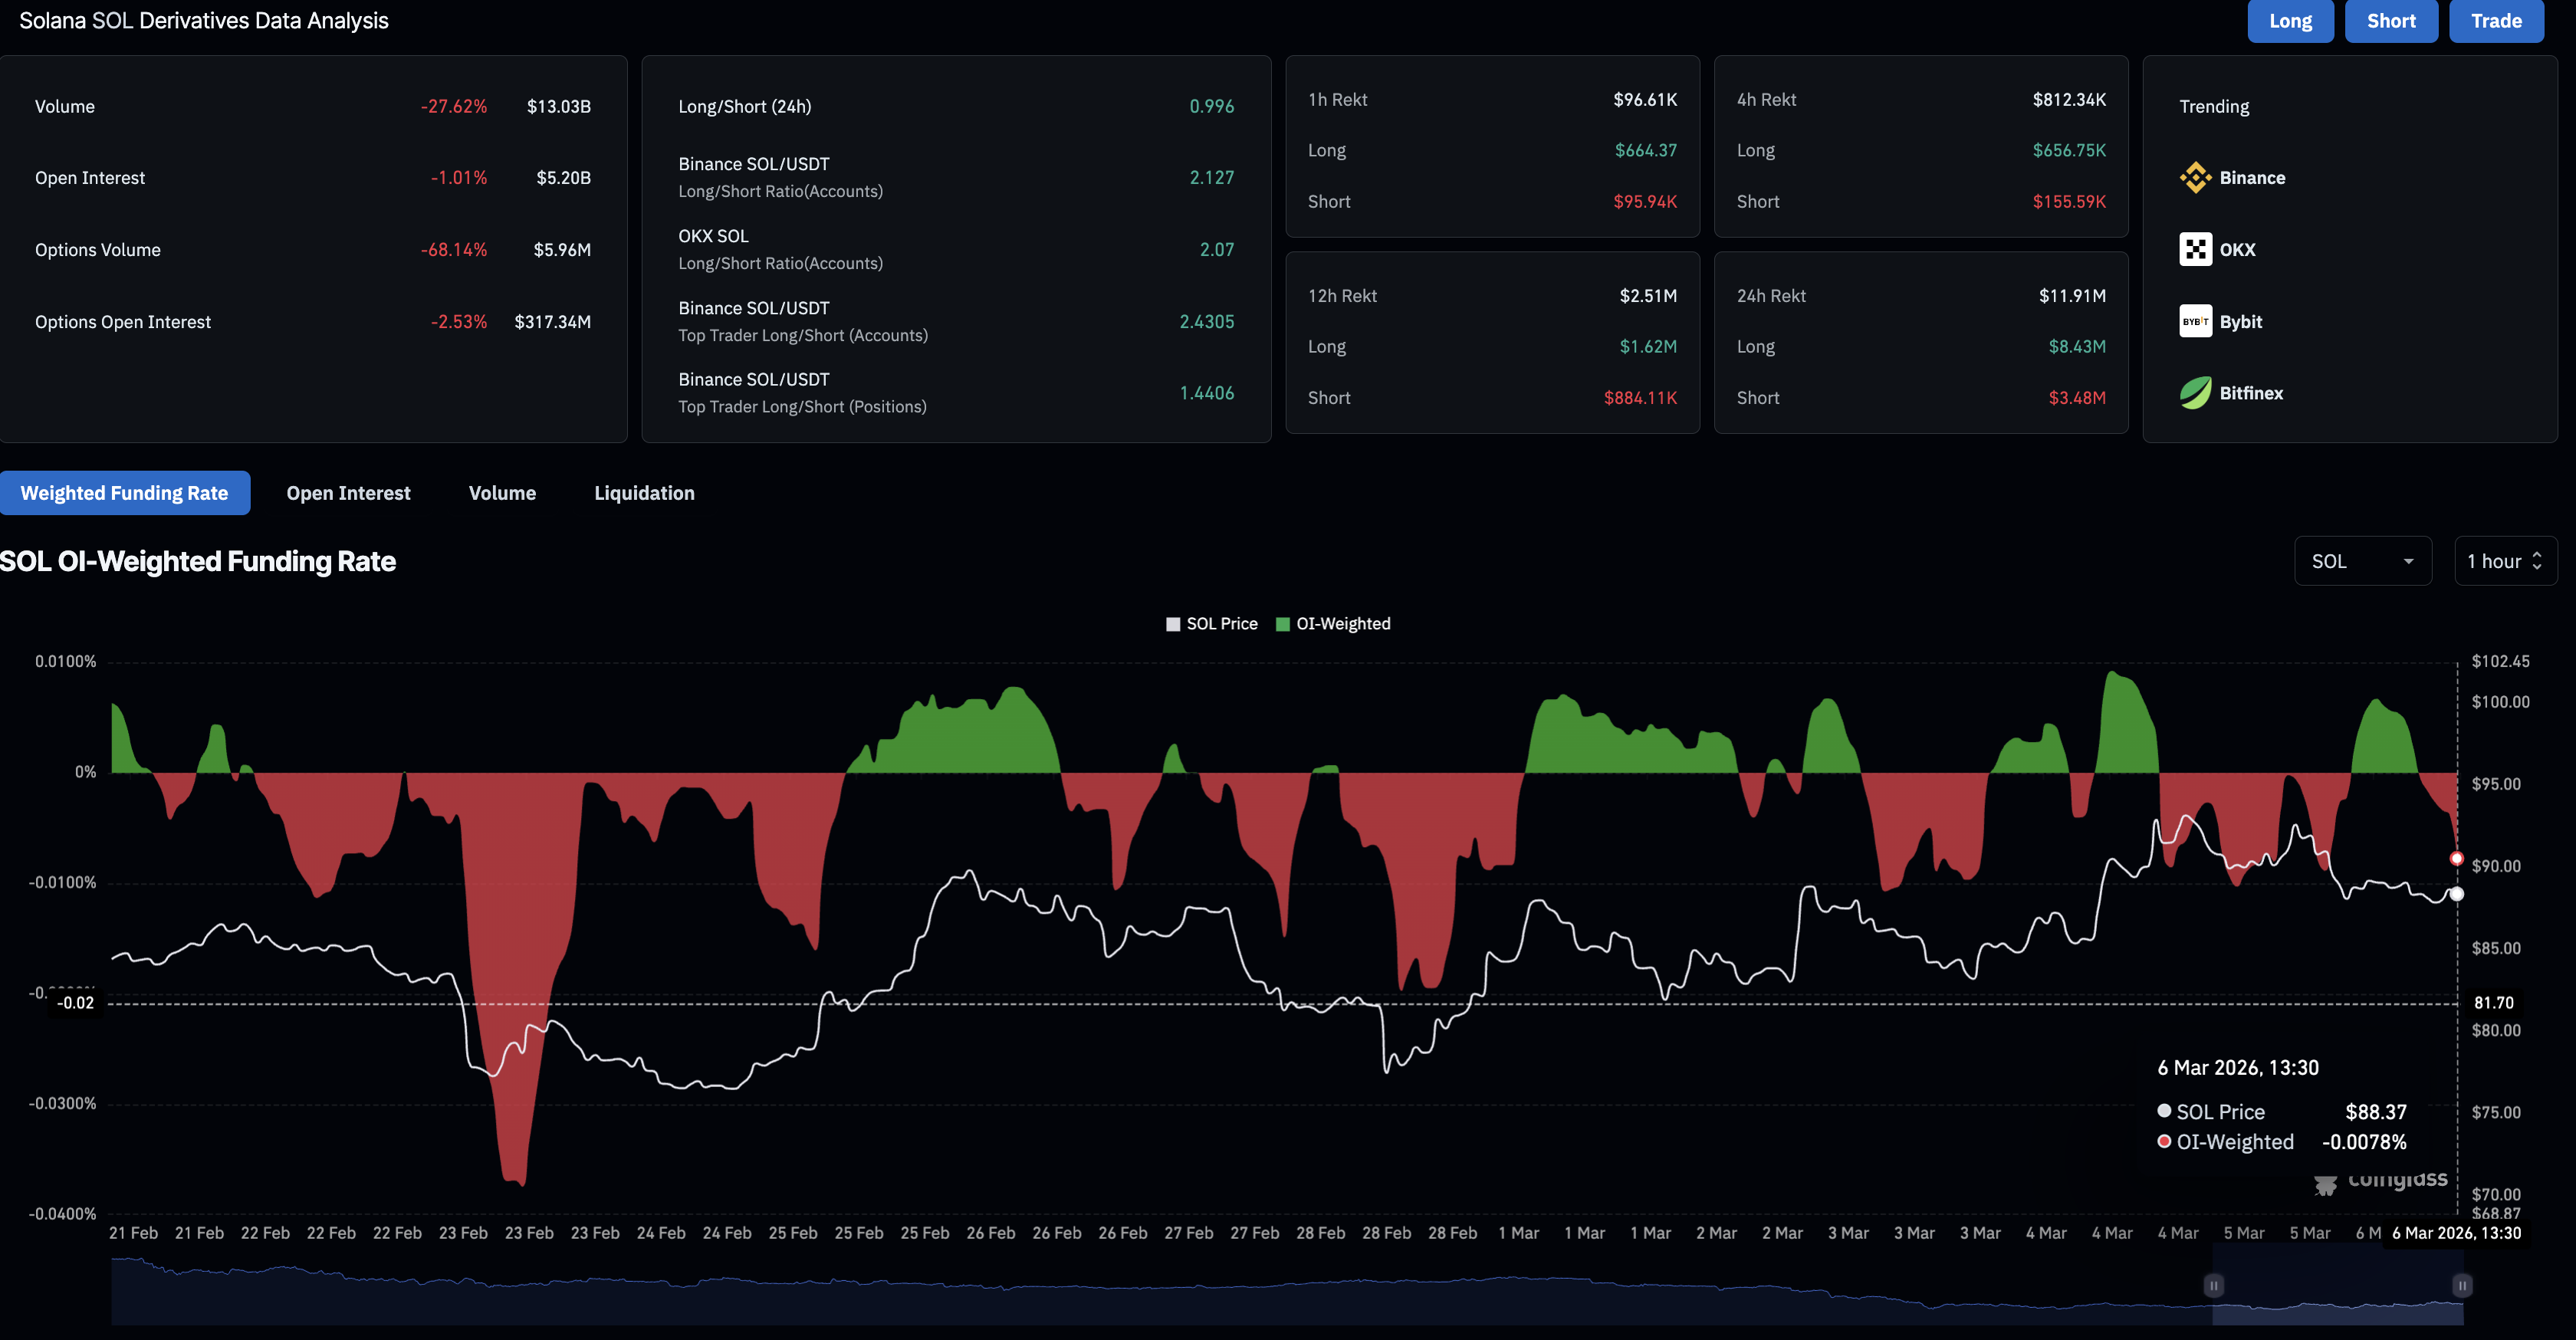
Retail confidence in Solana remains weak as Thursday’s pullback led to sharp liquidations. CoinGlass data shows $11.91 million of total liquidations over the last 24 hours, led by $8.43 million of long positions, suggesting a largely bullish positional wipeout. This dropped the long-to-short ratio to 0.996, which suggests a greater number of active bearish positions when below 1.
Consistent with the wipeout, the SOL futures Open Interest (OI) is down 1% in the same time period, to $5.20 billion, indicating a decline in positional building or leverage exposure as risk-on sentiment fades. Additionally, the funding rate has dropped to -0.0078%, from 0.0067% earlier on Friday, reflecting a sharp increase in bearish interest among traders.
Technical outlook: Will Solana break its consolidation range?
Solana edges below $88.00 at press time on Friday, extending Thursday’s 2% loss. The medium-term outlook for Solana is mildly bearish as it trades below the downward-sloping 50-day, 100-day, and 200-day Exponential Moving Averages (EMAs), which continue to cap the upside.
The pullback in SOL extends consolidation within the February 5 candle, ranging from $92.11 to $78.35. Based on previous pullbacks within this range, Solana is likely to test the $78.35 level. However, a daily close below this level could further extend the downside to the February 6 low at $67.50.
The technical indicators on the daily chart suggest moderate downside momentum as Solana reverses below $90. The Moving Average Convergence Divergence (MACD) remains above the signal line in the negative territory, while the MACD histograms contract, hinting at a fading bullish impulse. At the same time, the Relative Strength Index (RSI) has slipped back to 47, below the midline, reinforcing a neutral-to-bearish tone.
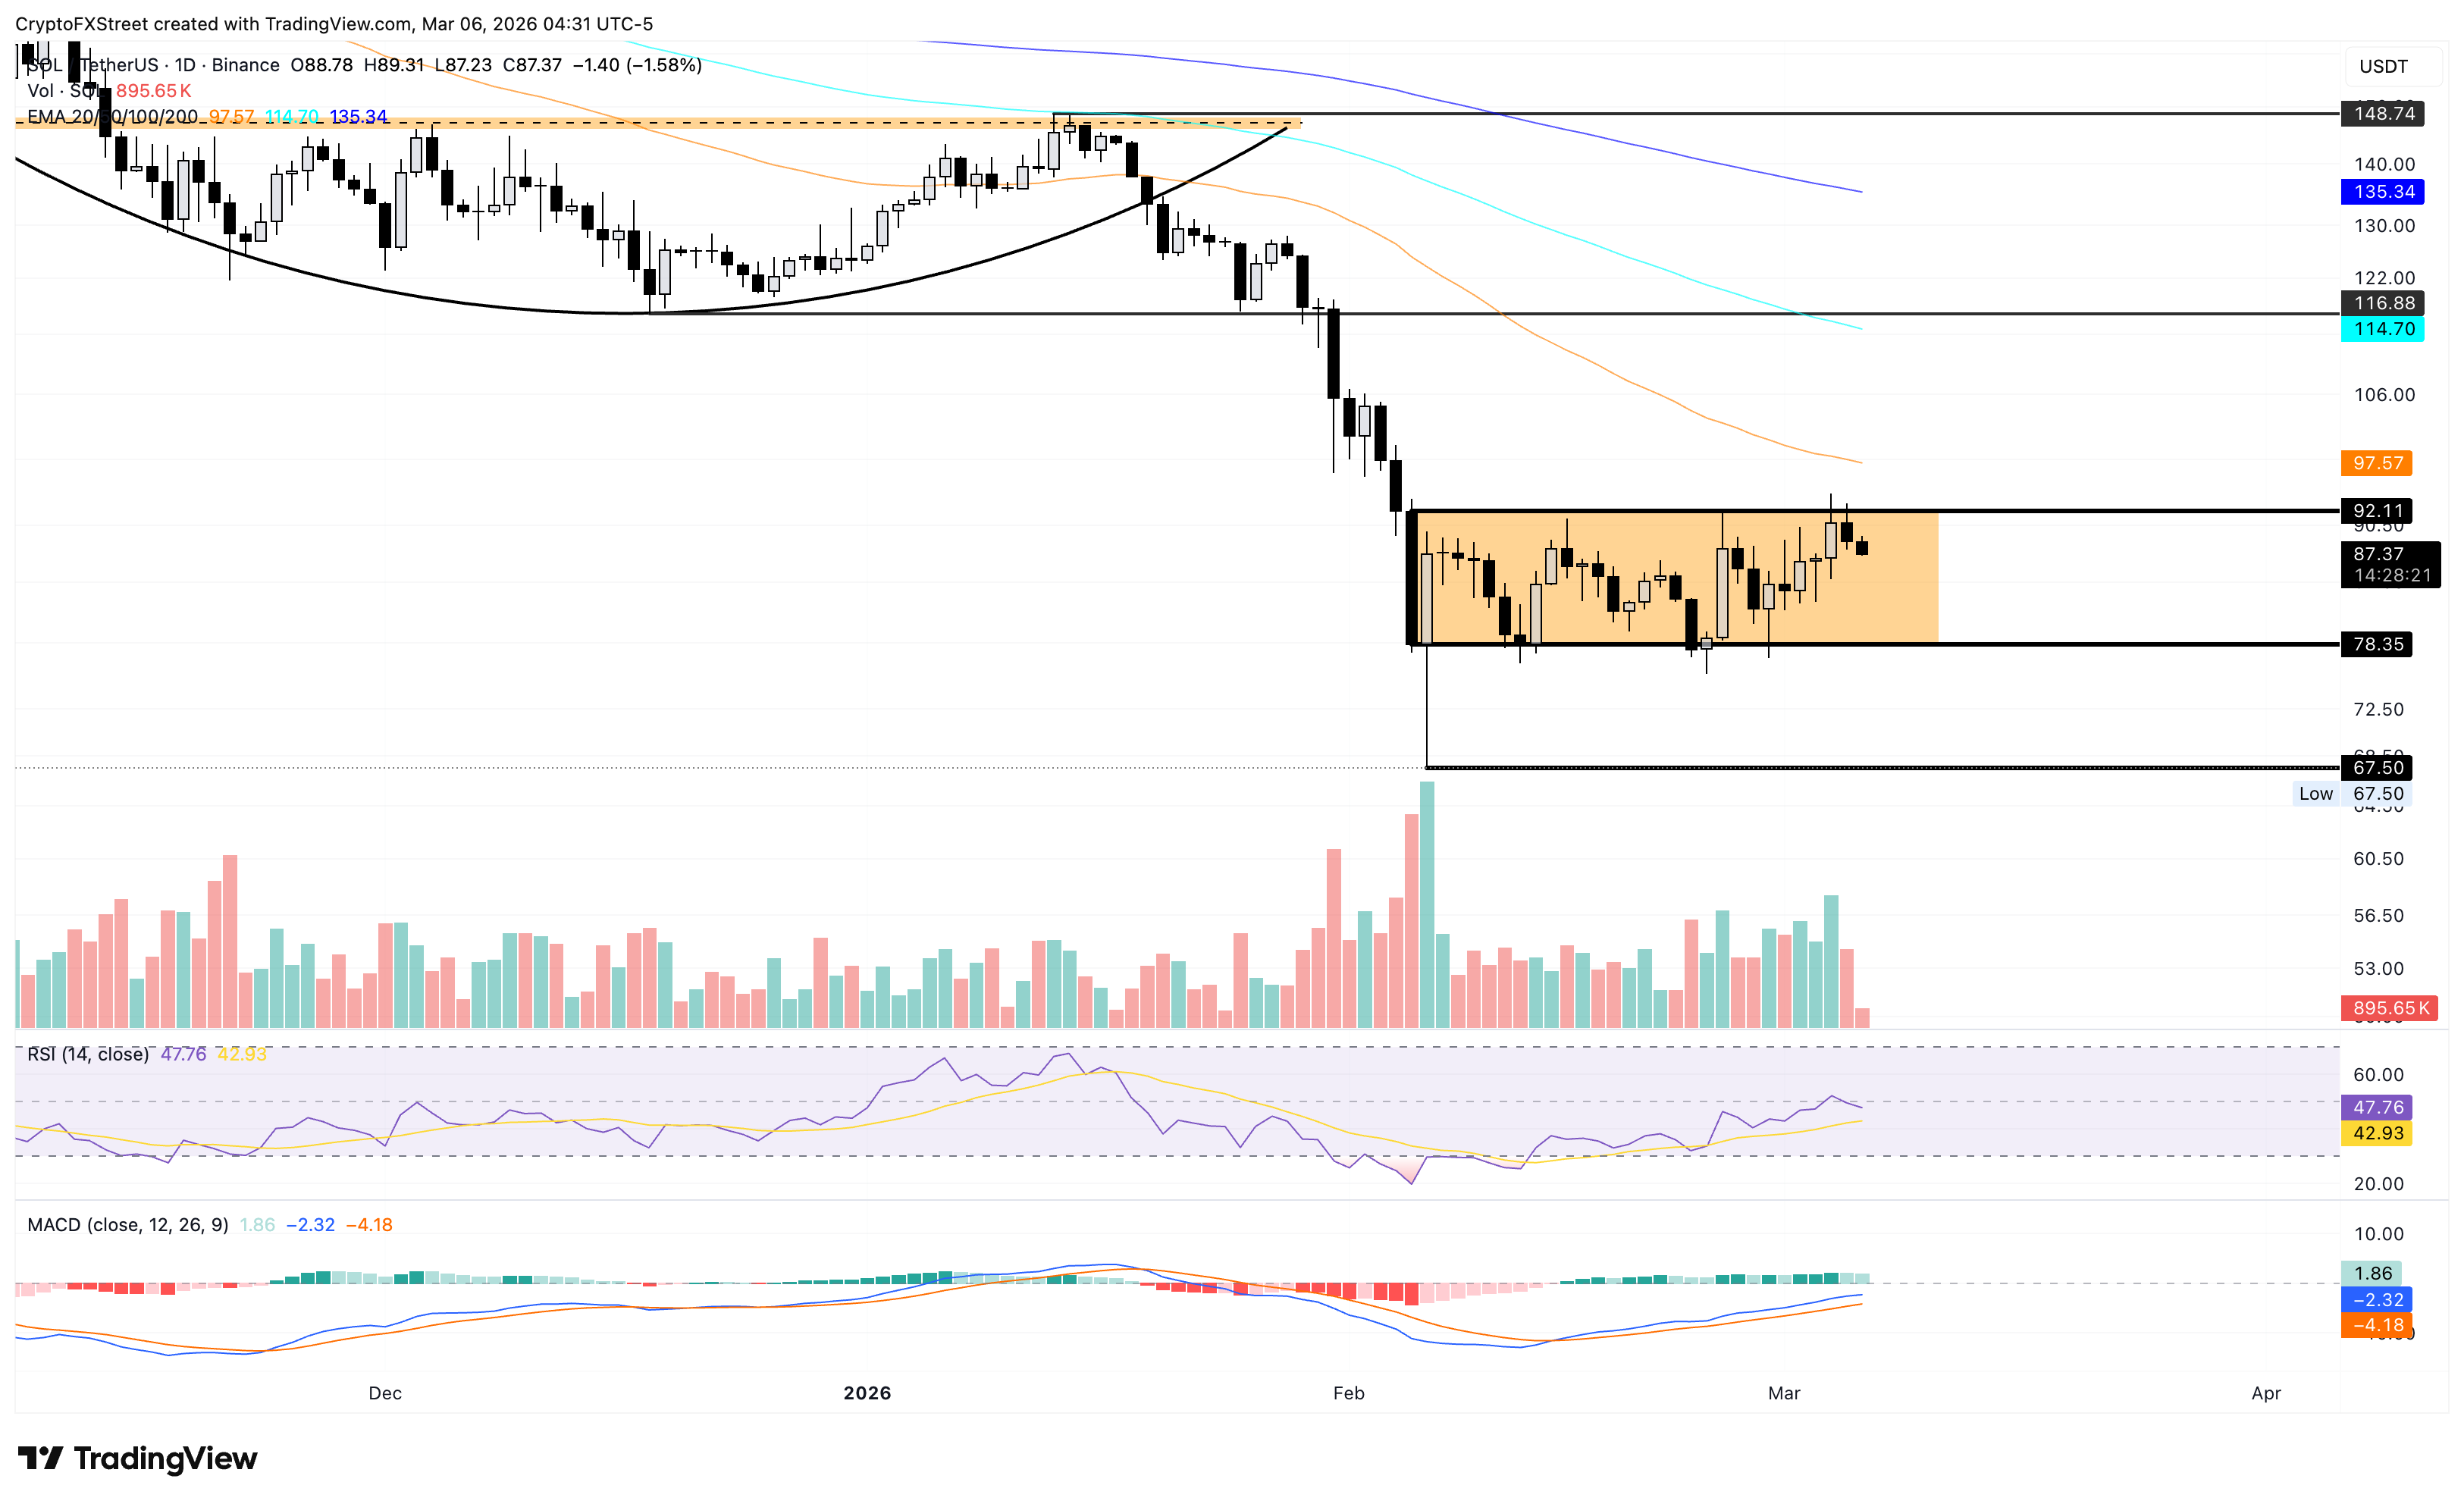
For sustained recovery, Solana should secure a daily close above $92.11, which could face resistance at the 50-day EMA at $97.57 and the $100 psychological level. Beyond this, the 100-day EMA at $114.70 remains a higher target level.
(The technical analysis of this story was written with the help of an AI tool.)

Hơn một triệu người dùng dựa vào FXStreet để có dữ liệu thị trường thời gian thực, công cụ biểu đồ, góc nhìn chuyên gia và tin tức Forex. Lịch kinh tế toàn diện và các hội thảo web giáo dục giúp nhà giao dịch luôn cập nhật và đưa ra quyết định có tính toán. FXStreet có khoảng 60 nhân sự, chia giữa trụ sở Barcelona và nhiều khu vực toàn cầu.
Đọc thêm


