
Solana Price Forecast: SOL stalls below key trendline as ETF outflows deepen
Bởi Vishal Dixit
Đã cập nhật: 10 Apr 2026


BÀI VIẾT PHỔ BIẾN

Solana (SOL) holds above $80 at press time on Friday, facing pressure from the descending trendline and reduced institutional interest so far this week. Amid the possibility of its largest weekly institutional outflow, the SOL leverage market remains mixed due to broader market volatility.
- Solana hovers above $80 on Friday, struggling to surpass an overhead descending trendline.
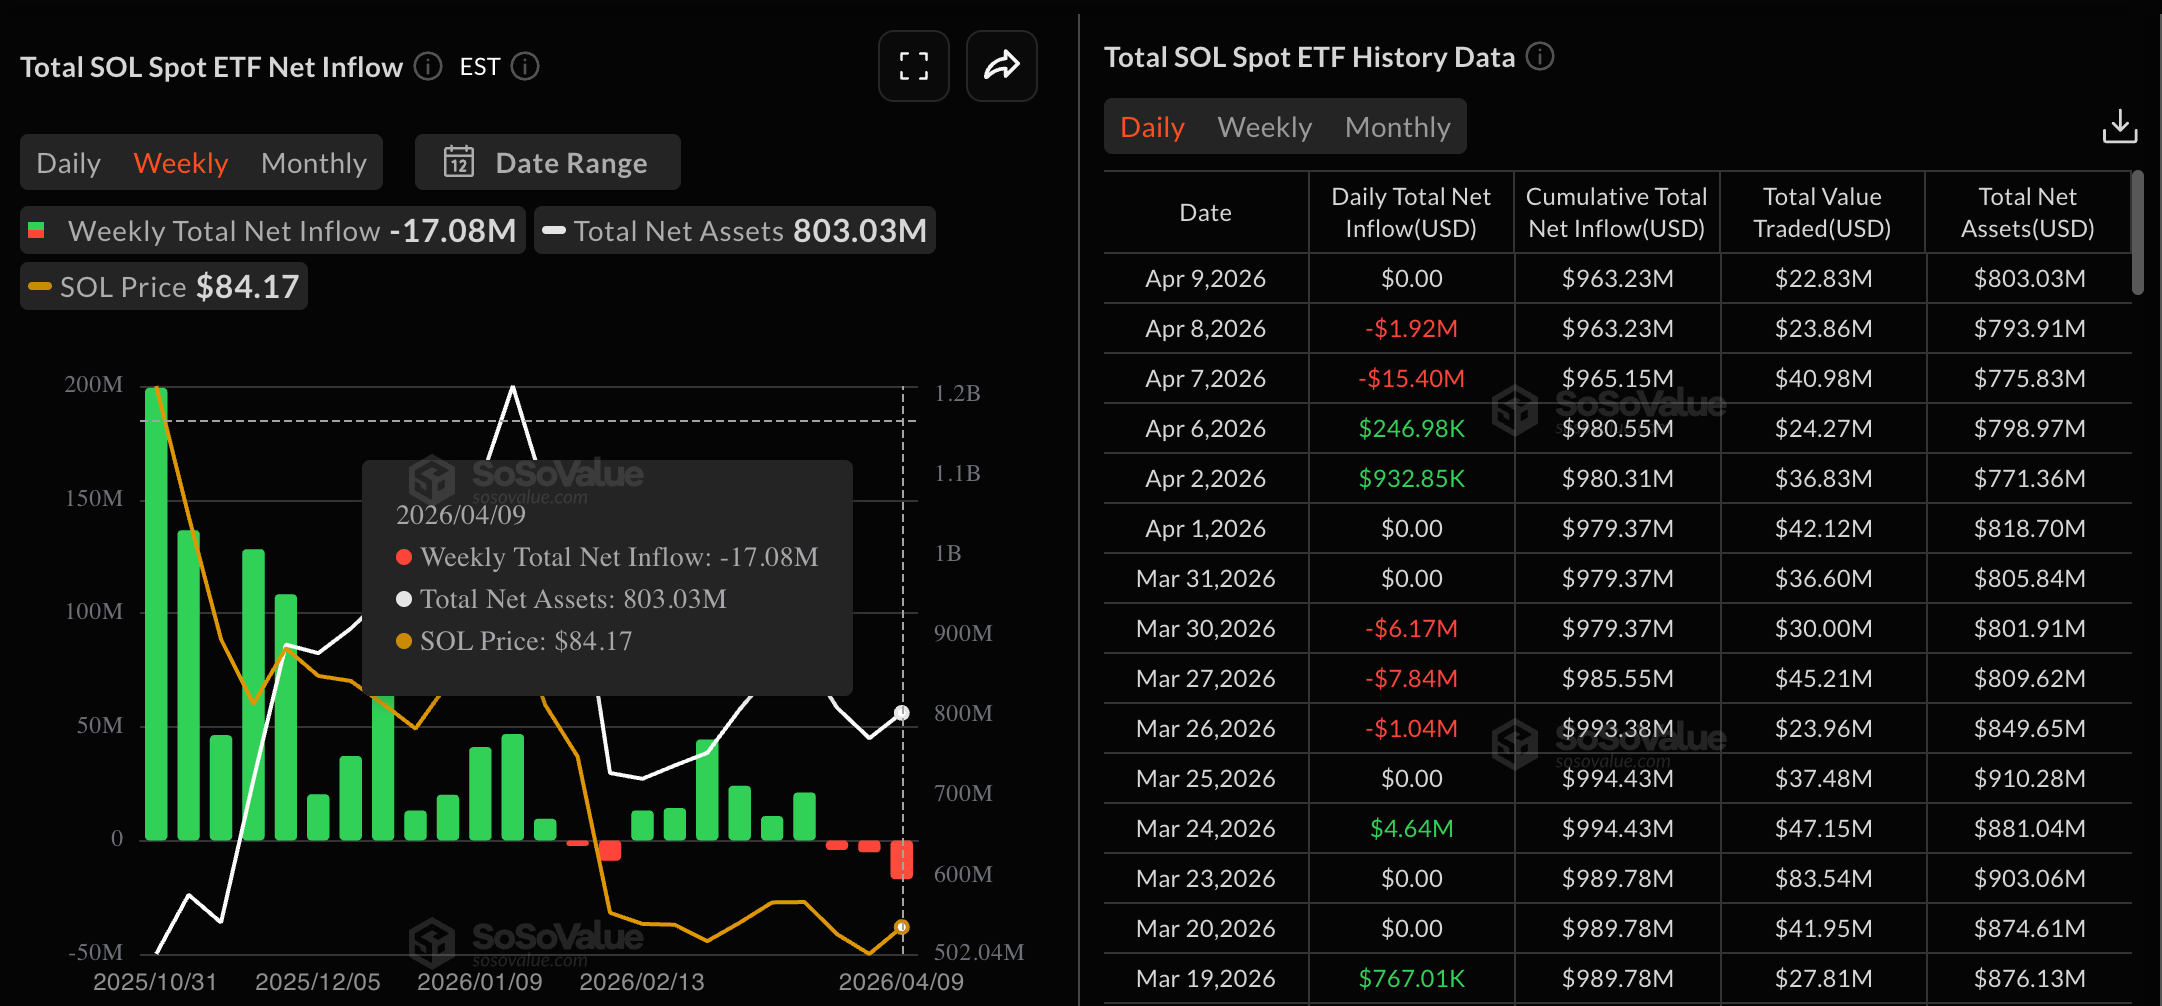
- Solana-focused ETFs recorded over $17 million in outflows so far this week, pointing to their largest weekly outflow.
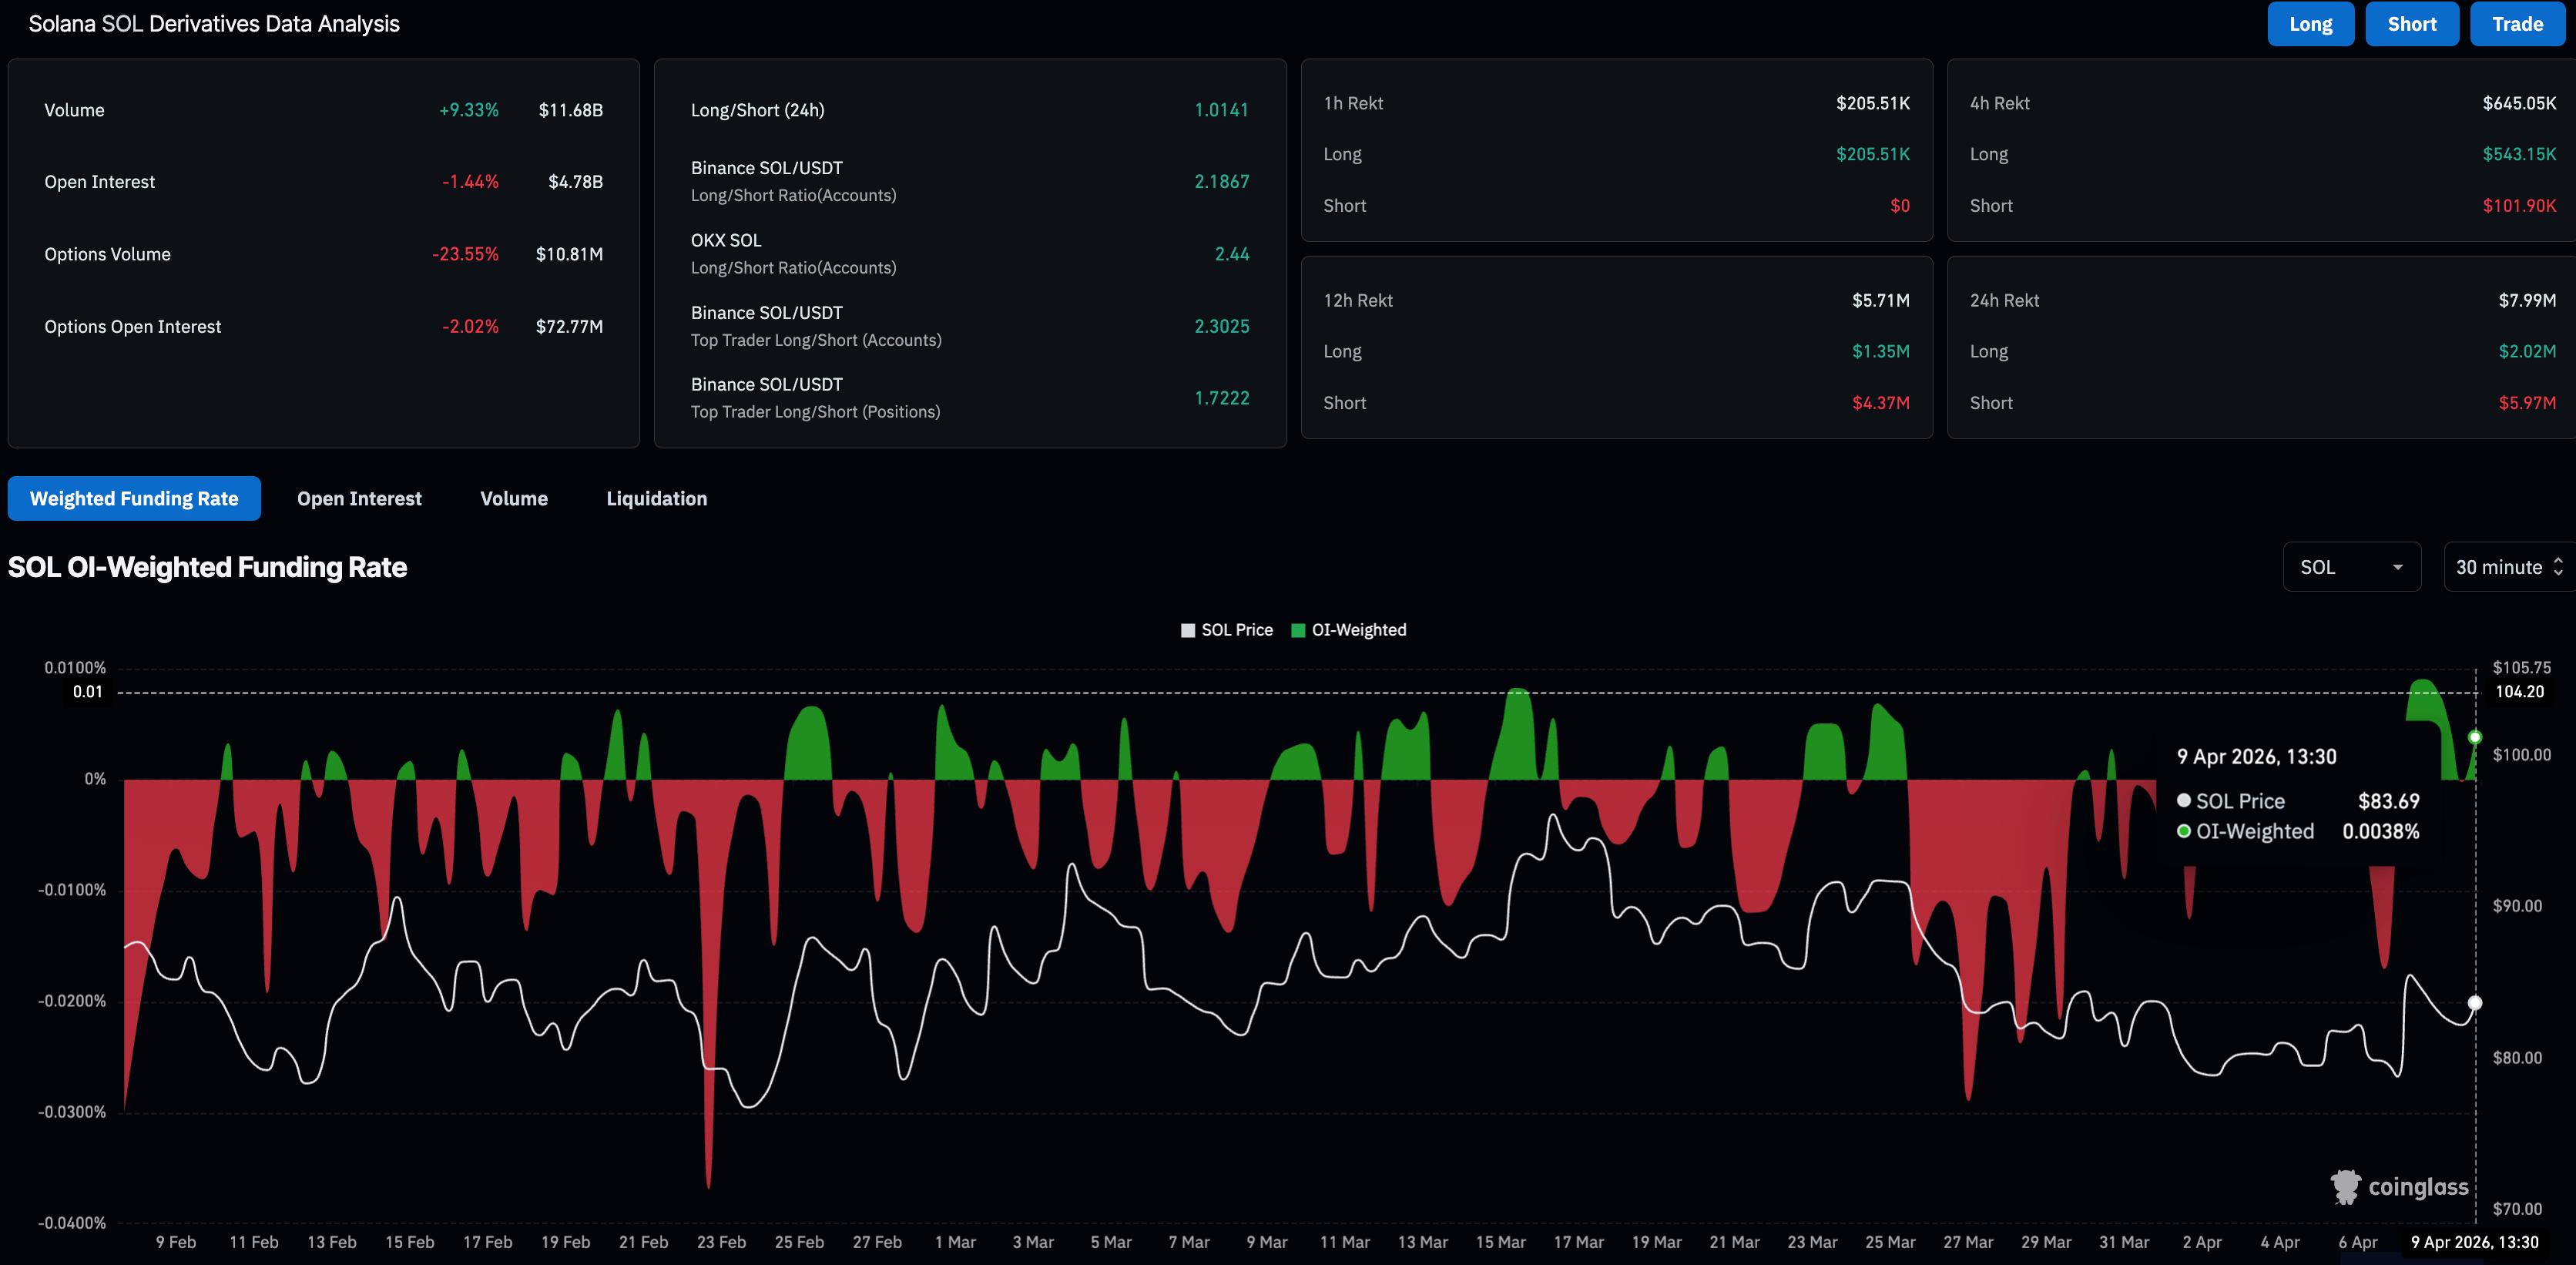
- Derivatives data shows mixed reactions as investors reassess Solana’s near-term outlook.
Solana (SOL) holds above $80 at press time on Friday, facing pressure from the descending trendline and reduced institutional interest so far this week. Amid the possibility of its largest weekly institutional outflow, the SOL leverage market remains mixed due to broader market volatility. Technically, a breakout above its 50-day Exponential Moving Average (EMA) around $87 could expand its upside potential.
Mixed outlook for Solana
Solana is at a crucial inflection point as the institutional demand weakens and the leverage market reassesses its stance. The US spot SOL Exchange Traded Funds (ETFs) have recorded $17.08 million in outflows so far this week, largely driven by their largest-ever outflow of $15.40 million on Tuesday. A steady outflow typically signals restructuring from institutional participants, posing downside pressure on Solana spot.
On the retail side, CoinGlass data shows $7.99 million in total liquidations over the last 24 hours, driven by $5.97 million in short liquidations, suggesting that largely bearish players were wiped out. However, the 1.48% decline in SOL Open Interest (OI) over the same period, to $4.78 billion, reflects reduced market activity.
Still, the positive OI-weighted funding rate of 0.0038% and a long-to-short ratio of 1.0141 imply a bullish outlook, with traders willing to hold active long positions that outpace short positions at the time of writing.
Technical outlook: Will Solana rally above $100?
Solana trades around $83 at press time on Friday, maintaining a near-term mixed bias as SOL sits decisively beneath the 50-, 100-, and 200-day Exponential Moving Averages (EMAs). SOL has slipped back under a downward trendline, connecting the January 14 and April 7 highs, close to the 50-day EMA at $87.94.
Meanwhile, the Relative Strength Index (RSI) at 47 points to subdued momentum, despite a mildly positive Moving Average Convergence Divergence (MACD) reading that only hints at tentative recovery attempts rather than a sustained reversal.
On the topside, initial resistance is clustered around the trendline and the 50-day EMA at $87.94. A daily close above this zone would open the way toward the 100-day EMA near $99.86 and then the 200-day EMA around $120.78.
With no clear technical support from moving averages below the market, the February 5 and 6 lows at $78.94 and $67.50, respectively, act as fragile support levels. A decisive break lower would expose progressively weaker demand pockets until a new structural base is established.
(The technical analysis of this story was written with the help of an AI tool.)

Hơn một triệu người dùng dựa vào FXStreet để có dữ liệu thị trường thời gian thực, công cụ biểu đồ, góc nhìn chuyên gia và tin tức Forex. Lịch kinh tế toàn diện và các hội thảo web giáo dục giúp nhà giao dịch luôn cập nhật và đưa ra quyết định có tính toán. FXStreet có khoảng 60 nhân sự, chia giữa trụ sở Barcelona và nhiều khu vực toàn cầu.
Đọc thêm


