
Solana Price Forecast: SOL tests resistance breakout amid ETFs inflows, retail demand
Bởi Vishal Dixit
Đã cập nhật: 17 Apr 2026


BÀI VIẾT PHỔ BIẾN

Solana (SOL) trades below $90 at press time on Friday, testing grounds above the 50-day Exponential Moving Average (EMA) at $87.42.
- Solana holds above its 50-day EMA on Friday after roughly 5% gains the previous day.
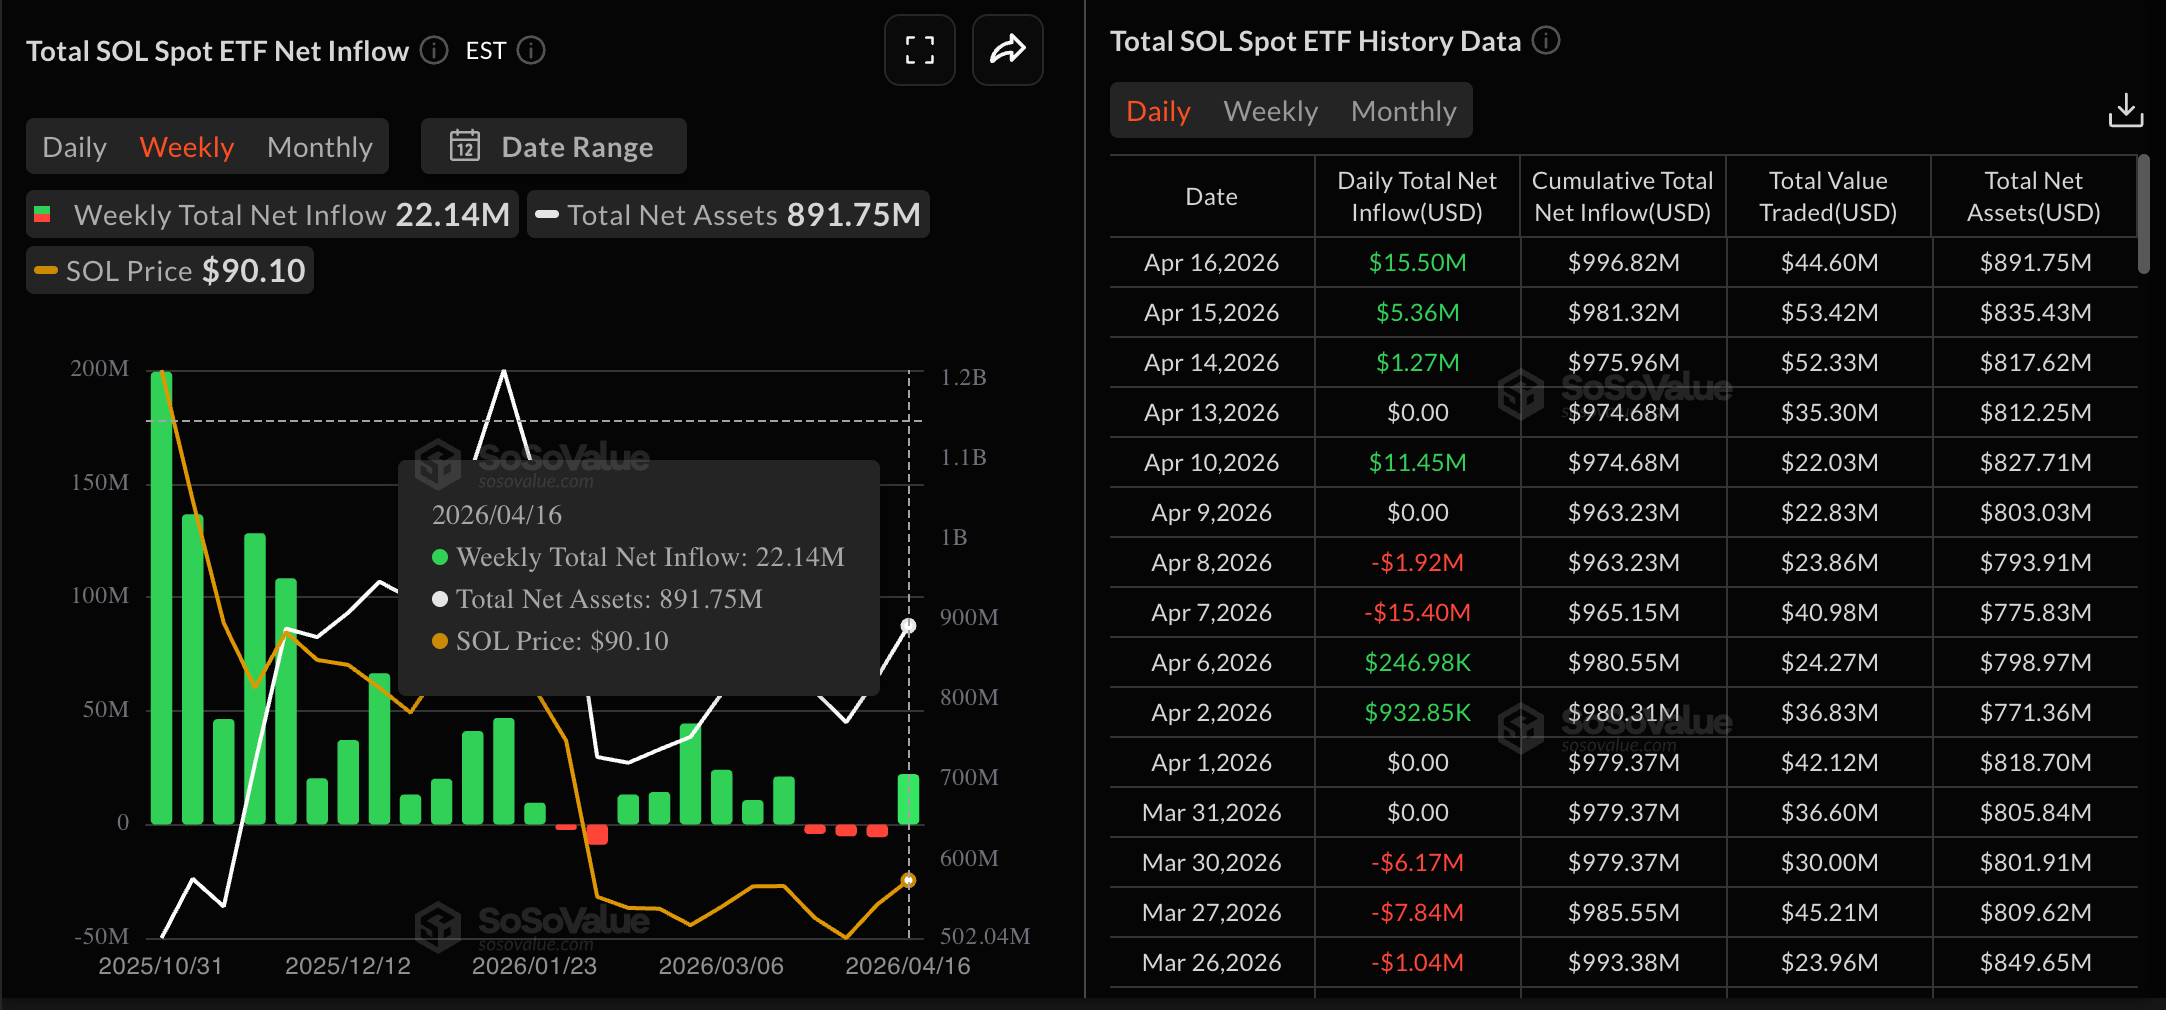
- Institutional investors' return continues this week as SOL-focused ETFs recorded $15.50 million in inflows on Thursday.
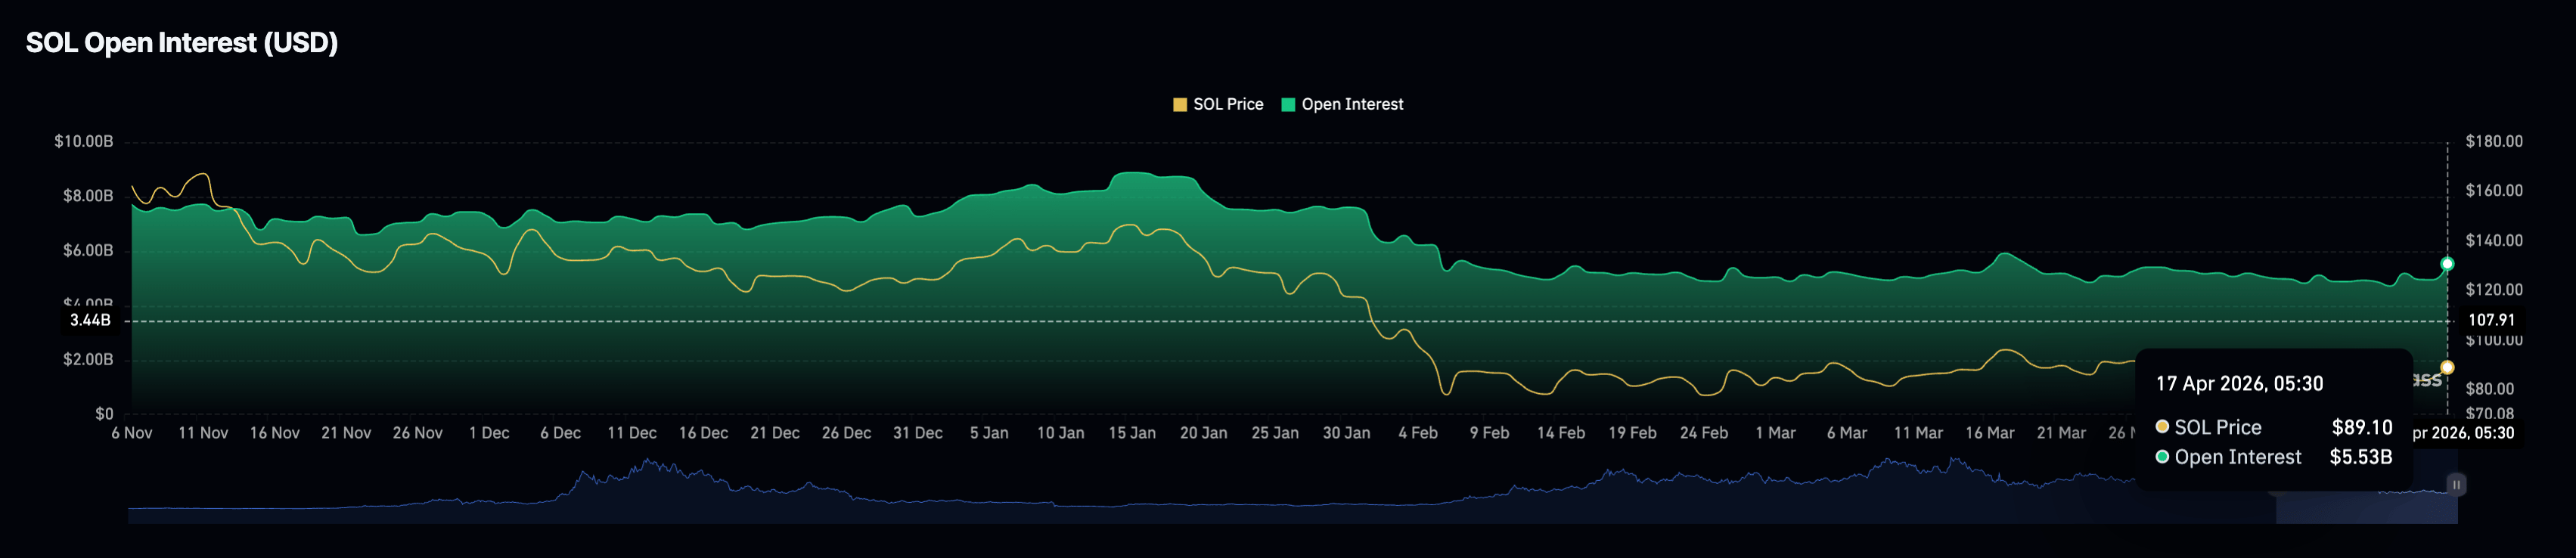
- Retail demand follows suit, with SOL futures Open Interest rising by double digits in 24 hours to $5.53 billion.
Solana (SOL) trades below $90 at press time on Friday, testing grounds above the 50-day Exponential Moving Average (EMA) at $87.42. Institutional demand is resurfacing, with over $20 million in inflows so far this week, while retail investors are returning, as SOL derivatives data shows a positional buildup. Technically, Solana should exceed the 100-day EMA at $98.00 for an extended rally.
Demand heats up for Solana in leverage and institutional markets
Solana is regaining momentum in the leverage market, aligning with the renewed institutional interest. The Sosovalue data shows $15.50 million in inflows into SOL-focused Exchange Traded Funds (ETFs) on Thursday, marking the third consecutive daily inflow this week and bringing the total to $22.14 million.
On the other hand, the CoinGlass data shows SOL futures Open Interest (OI) is at $5.53 billion on Friday, reflecting an uptick after a steady decline in positional value. A surge in OI reflects renewed anticipation among retail traders, which could provide leveraged support to spot prices.
Technical outlook: Will Solana resurface above $100?
Solana holds just above the 50-day EMA at $87.43, while remaining well below the 100-day EMA at $98.01 and the 200-day EMA near $117.38, leaving the broader trend capped despite a short-term floor.
The Moving Average Convergence Divergence (MACD) line is in positive territory on the daily chart above its signal line, with constructive histogram bars. Meanwhile, the Relative Strength Index (RSI) at 55 suggests improving but not yet impulsive bullish momentum within this mid-range context.
On the topside, initial resistance is at the 100-day EMA at $98.01, with the 200-day EMA at $117.38 as the next technical barrier, which marks a major structural cap.
On the downside, immediate support is provided by the 50-day EMA at $87.43, broken by Thursday's close at $89.05. A daily close below this level would weaken the current stabilization phase and expose a deeper pullback toward the February 5 low at $77.60.
(The technical analysis of this story was written with the help of an AI tool.)

Hơn một triệu người dùng dựa vào FXStreet để có dữ liệu thị trường thời gian thực, công cụ biểu đồ, góc nhìn chuyên gia và tin tức Forex. Lịch kinh tế toàn diện và các hội thảo web giáo dục giúp nhà giao dịch luôn cập nhật và đưa ra quyết định có tính toán. FXStreet có khoảng 60 nhân sự, chia giữa trụ sở Barcelona và nhiều khu vực toàn cầu.
Đọc thêm


