
Solana Price Forecast: SOL weakens below 50-day EMA despite renewed ETF inflows
Bởi Vishal Dixit
Đã cập nhật: 3 Apr 2026


BÀI VIẾT PHỔ BIẾN

Solana (SOL) is trading below $80 at press time on Friday, following two consecutive days of losses linked to broader market conditions and the Solana-based Drift protocol hack.
- Solana drifts below $80 on Friday after a 2% drop the previous day, extending its decline below the 50-day EMA.
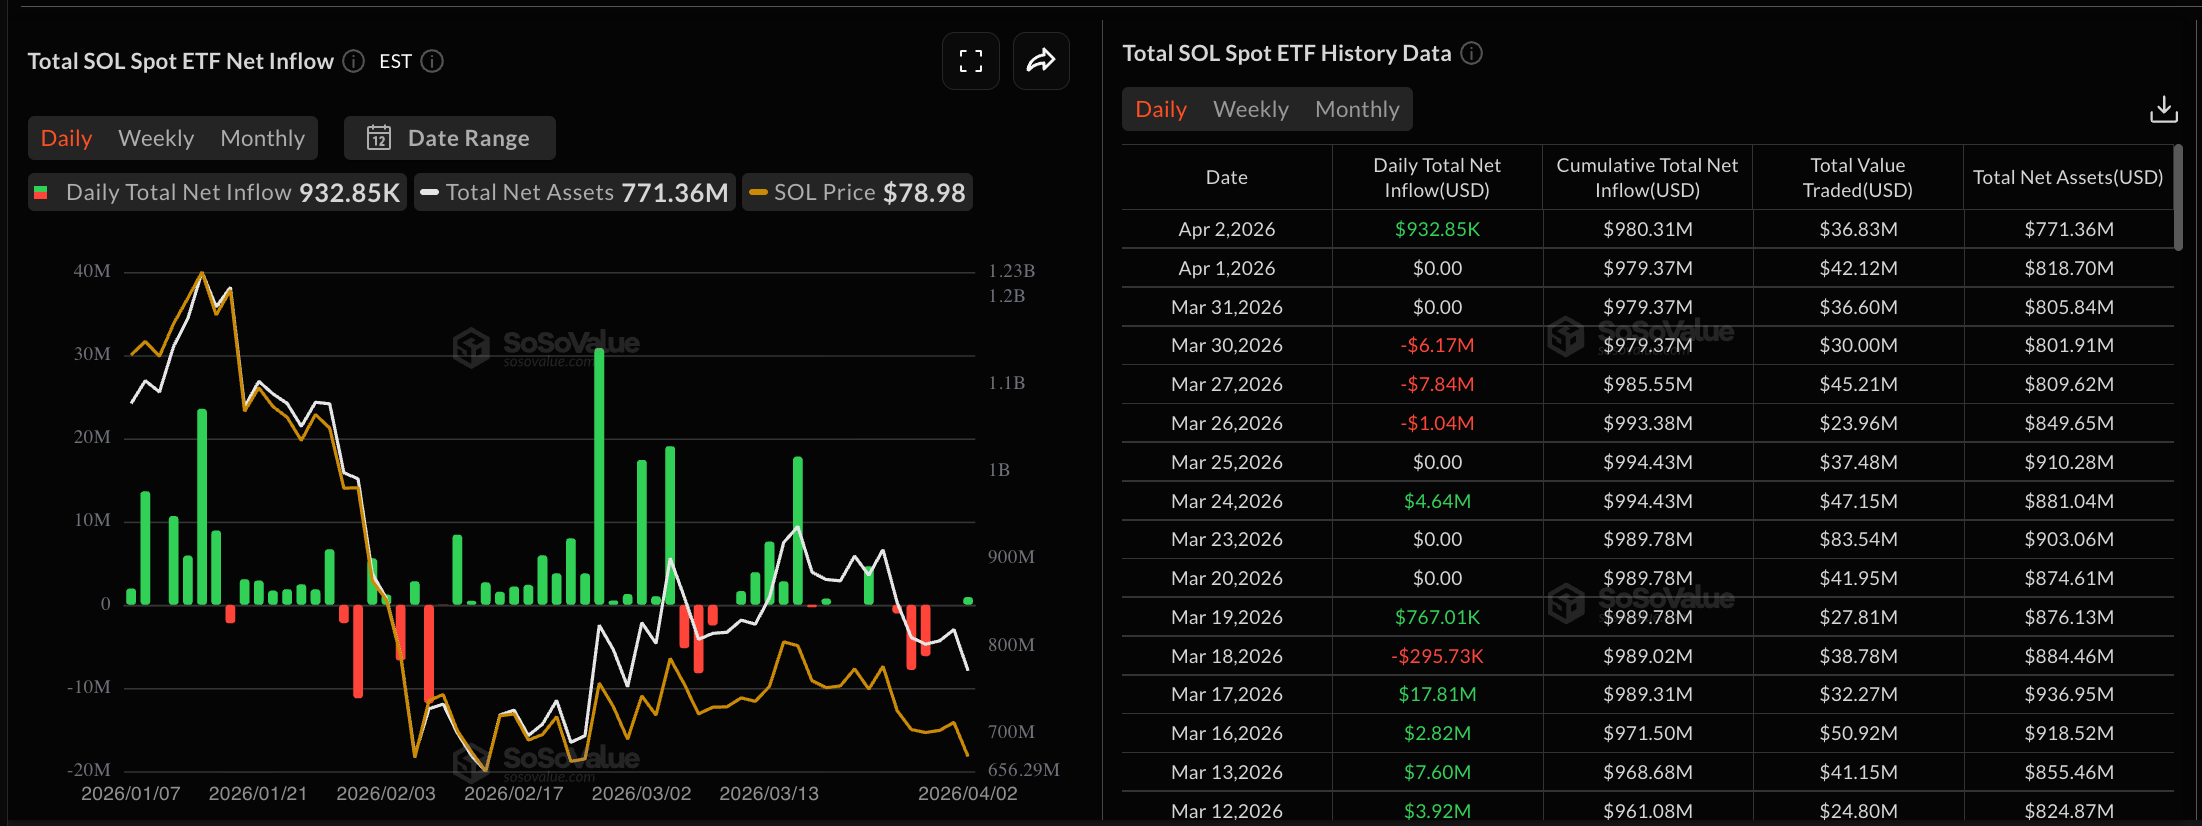
- The SOL-focused spot ETFs recorded roughly $1 million in inflows on Thursday, an early signal of stability in investor interest.
- Solana must breach the $75.63 support level to threaten a correction deeper toward the February 6 low at $67.50.
Solana (SOL) is trading below $80 at press time on Friday, following two consecutive days of losses linked to broader market conditions and the Solana-based Drift protocol hack. Institutional confidence in Solana shows early signs of stabilization, with nearly $1 million in inflows on Thursday, while derivatives data shows a persistent bearish tilt. The technical outlook for Solana highlights the last lines of defense near $75 and $67.
Are institutions returning to SOL?
Institutional demand for Solana showed signs of recovery on Thursday, following an outflow of $6.17 million on Monday. The US spot Solana Exchange Traded Funds (ETFs) recorded $932,850 in inflows on Thursday, after two days of muted activity. This marks the first inflow since March 24, suggesting a potential new phase of institutional accumulation.
Sellers tighten grip on Solana derivatives
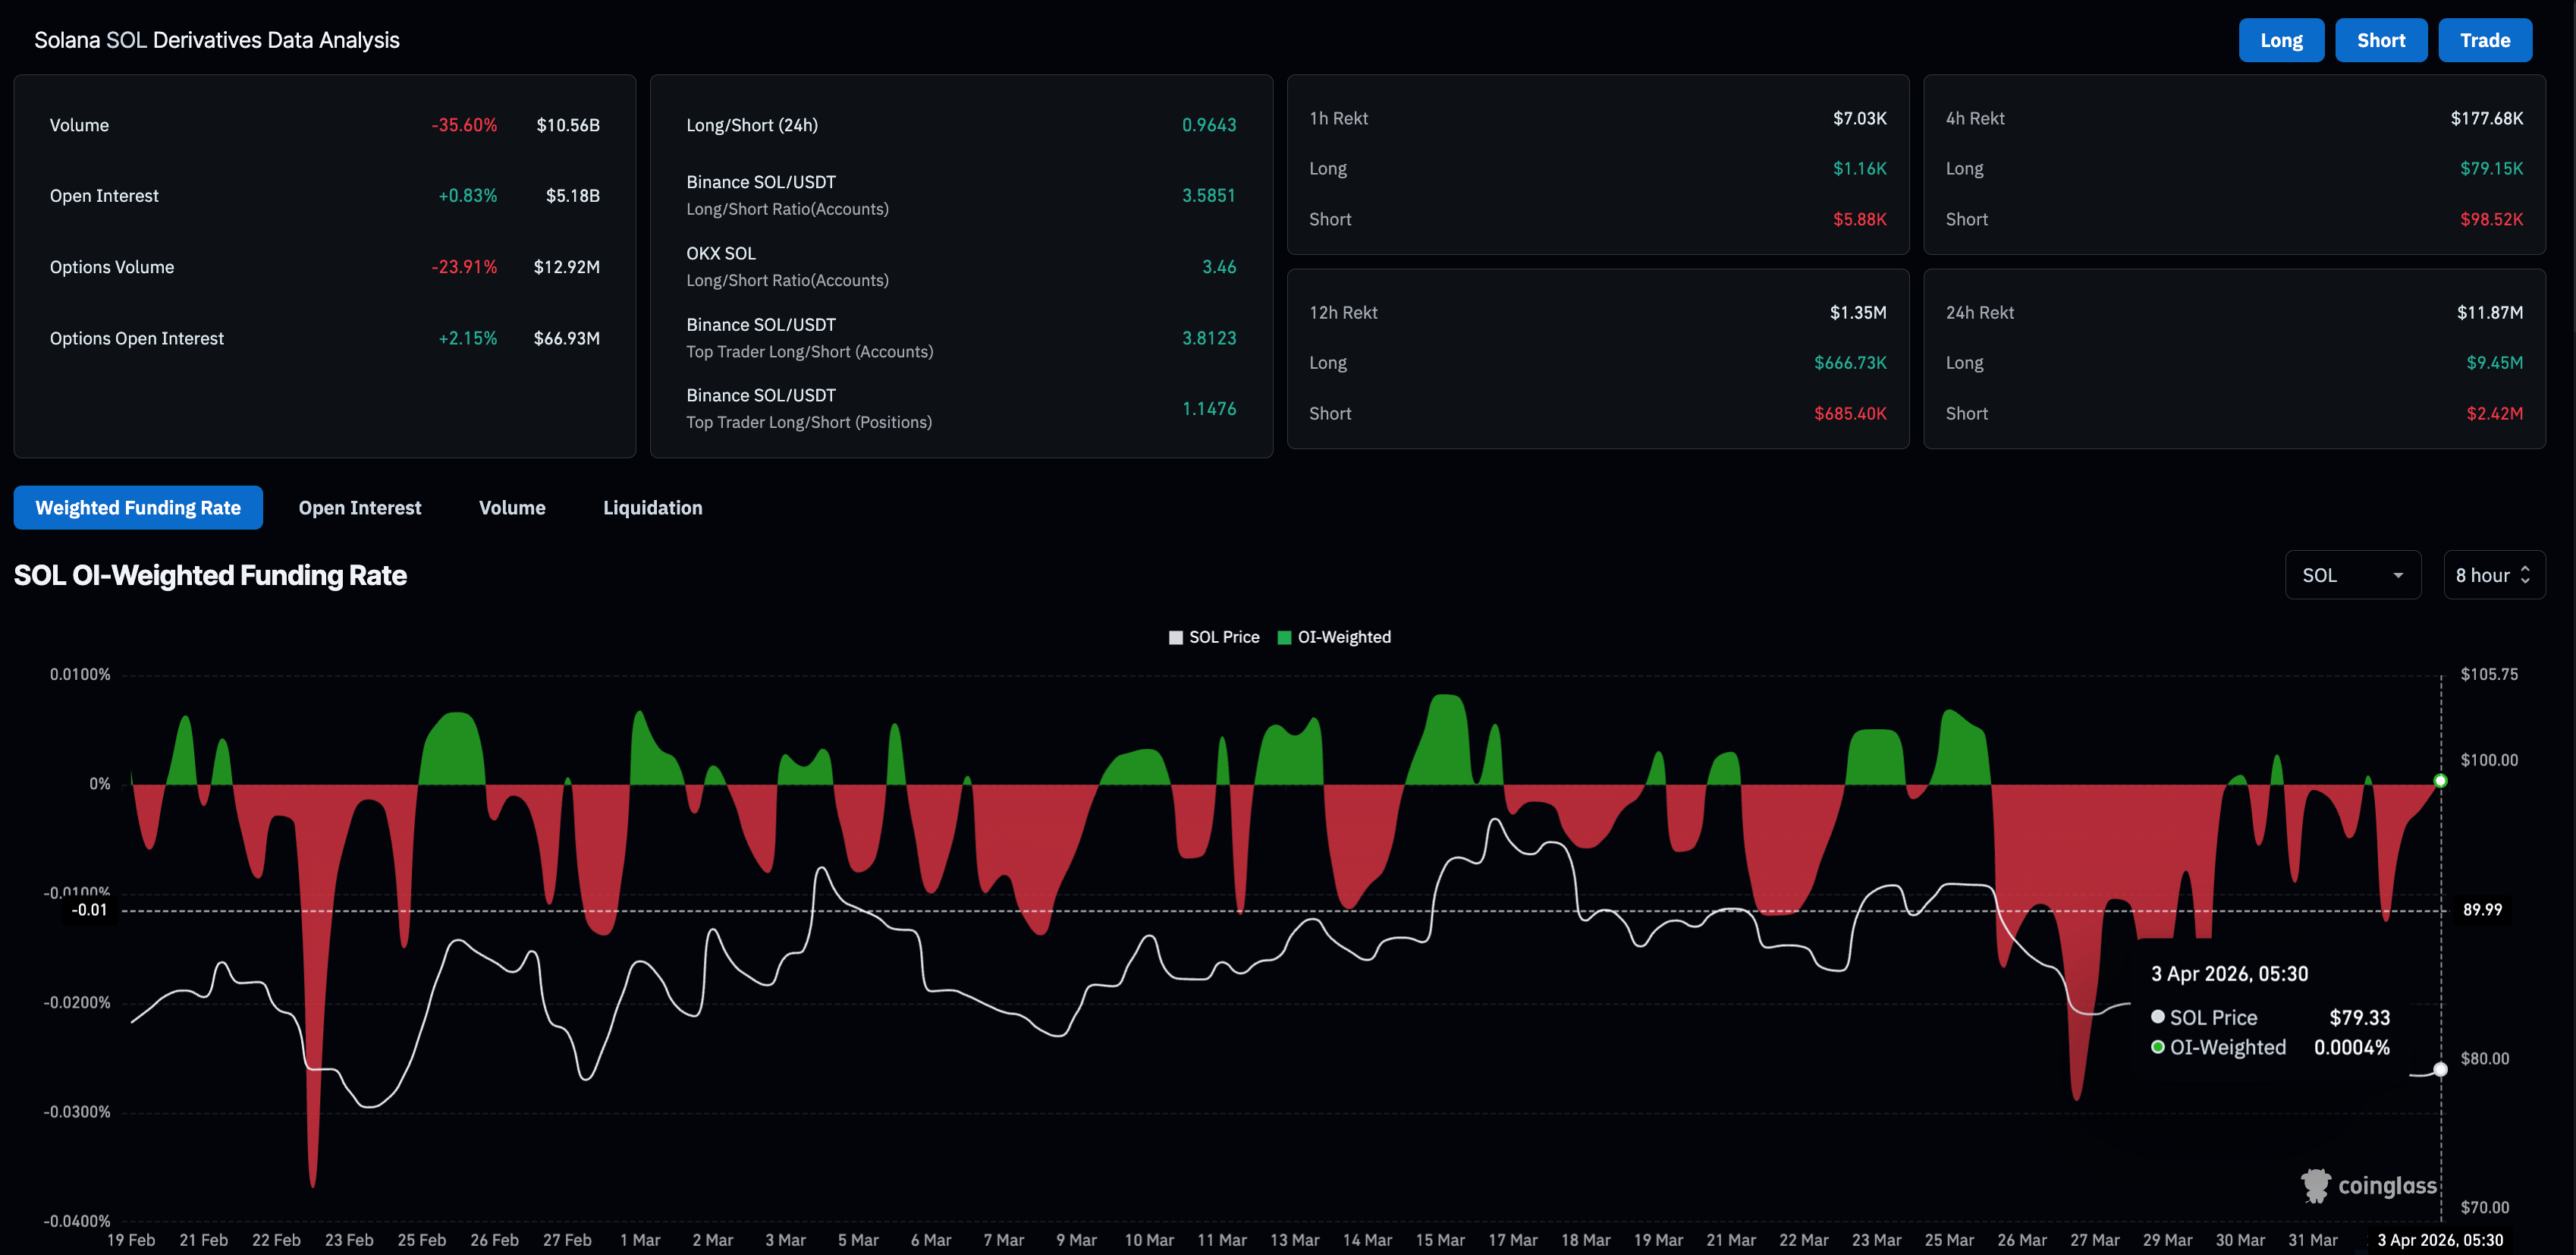
Bullish activity in Solana derivatives is on the back foot, as liquidations over the past 24 hours total $11.87 million, led by $9.45 million in long liquidations, indicating that bullish bets are being forced out amid a sharp spot price drop. Heightened long liquidations often lead to a positional imbalance due to a larger number of active short positions, as evidenced by the long-to-short ratio of 0.9643.
Meanwhile, Solana’s Open Interest (OI)-Weighted Funding Rate is at 0.0004% on Friday, reflecting indecisiveness among traders with OI rising nearly 1% over the last 24 hours, reaching $5.18 billion.
Will Solana extend its losses below $80?
SOL/USDT trades at $79.61 at the time of writing on Friday. The pair holds well below the clustered 50-, 100-, and 200-day exponential moving averages, which all track higher above $89 and confirm a dominant bearish context.
The Moving Average Convergence Divergence (MACD) line sits below its signal line on the daily chart while negative histogram bars expand, signaling strengthening downside momentum. At the same time, the Relative Strength Index (RSI) at 38 shows bearish pressure building but not yet oversold, supporting a near-term bearish bias within a longer-term rising structure.
Immediate support for Solana emerges at the February 24 low at $75.63, with a clear break exposing the February 6 low at $67.50 as the next downside target.
On the upside, initial resistance emerges at the 50-day EMA at $89.65, where a daily close above it would be needed to ease selling pressure.
(The technical analysis of this story was written with the help of an AI tool.)

Hơn một triệu người dùng dựa vào FXStreet để có dữ liệu thị trường thời gian thực, công cụ biểu đồ, góc nhìn chuyên gia và tin tức Forex. Lịch kinh tế toàn diện và các hội thảo web giáo dục giúp nhà giao dịch luôn cập nhật và đưa ra quyết định có tính toán. FXStreet có khoảng 60 nhân sự, chia giữa trụ sở Barcelona và nhiều khu vực toàn cầu.
Đọc thêm


