
Stellar Price Forecast: XLM breaks key resistance as traders increase bullish exposure
Bởi Manish Chhetri
Đã cập nhật: 25 Mar 2026


BÀI VIẾT PHỔ BIẾN

Stellar (XLM) price is trading above $0.17 as of writing on Wednesday, after closing above the key resistance zone the previous day. Improving sentiment from the derivatives market, alongside a constructive technical outlook, suggests an upside continuation for XLM in the near term.
- Stellar price closes above the descending trendline and 50-day EMA at $0.17, signaling an upside move ahead.
- Derivatives data supports a bullish sentiment with open interest rising alongside positive funding rates.
- The technical outlook suggests a rally continuation, as momentum indicators show bullish strength gaining traction.
Stellar (XLM) price is trading above $0.17 as of writing on Wednesday, after closing above the key resistance zone the previous day. Improving sentiment from the derivatives market, alongside a constructive technical outlook, suggests an upside continuation for XLM in the near term.
XLM’s derivatives data shows bullish bias
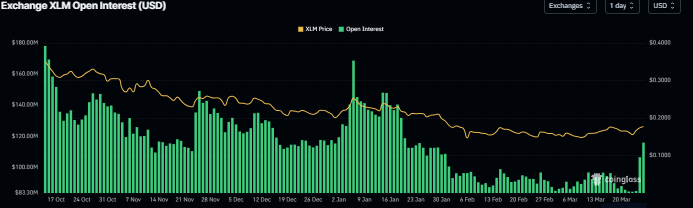
CoinGlass’s data shows that the futures’ Open Interest (OI) in Stellar at exchanges reaches $115.77 million on Wednesday, up from $84.64 million on Monday, reaching levels not seen since January 20. An increasing OI represents new or additional money entering the market and new buying, which could fuel the current XLM price rally.
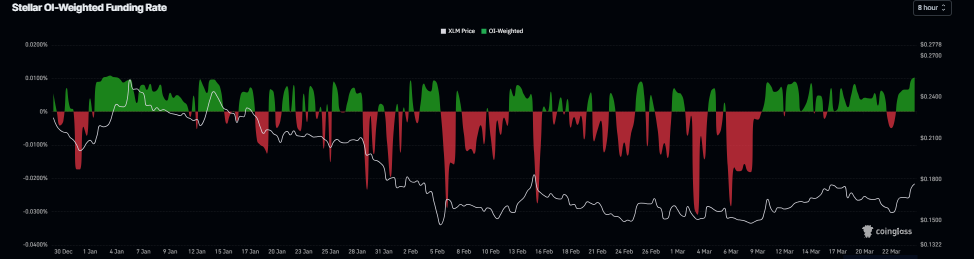
In addition, Stellar’s funding rates flipped positive on Monday and surges to 0.0103% on Wednesday, indicating that longs are paying shorts. Historically, as shown in the chart below, when the funding rates have flipped from negative to positive and risen, the Stellar price has rallied sharply.
XLM’s stablecoin market cap reaches record highs
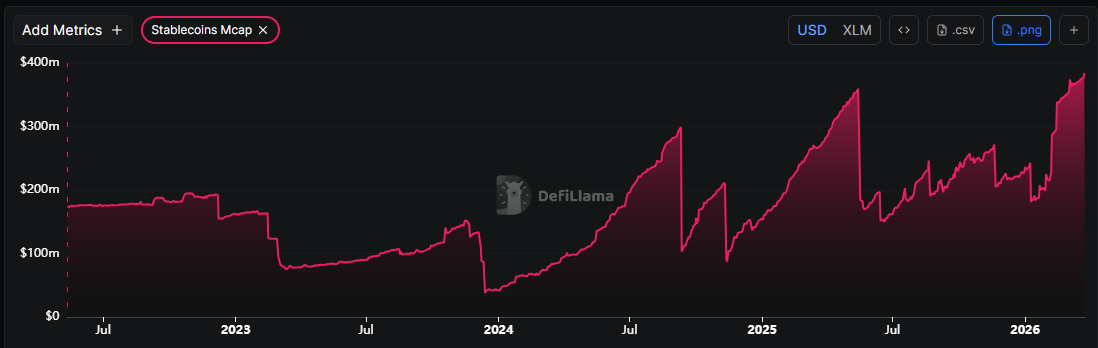
Apart from bullish derivatives data, Crypto intelligence tracker DefiLlama shows that Stellar’s stablecoin market capitalisation increased from $181.12 million in early January to $361.02 million on Wednesday, setting a new all-time high. Rising stablecoin market capitalization and increasing network activity suggest growing confidence and interest within the Stellar ecosystem, adding credence to the bullish outlook.
Stellar Price Forecast: XLM bulls in control of momentum
Stellar price is trading above $0.17 on Wednesday. The near-term bias turns cautiously bullish after the price pushed through the descending trendline, with XLM now holding above the stated break area near $0.17. Daily closes have reclaimed the 50-day Exponential Moving Average (EMA) around $0.17, reducing the downside grip of the still-declining 100-day EMA near $0.19.
Momentum readings back the improving tone, as the Relative Strength Index (RSI) on the daily chart holds above 60 and the Moving Average Convergence Divergence (MACD) line remains over its signal and the zero line, suggesting strengthening upside pressure rather than a mere oversold bounce.
Immediate support is located at the broken trendline region and the 50-day EMA cluster near $0.17, followed by secondary support at the $0.16 area, where the latest consolidation began. Below that, the next bearish target would emerge closer to $0.15.
Initial resistance appears at the 100-day EMA near $0.19, followed by the $0.20 Fibonacci barrier drawn from the $0.14 low to the $0.41 high and then the 38.2% retracement at $0.24, where a confluence of historical supply would test the durability of the new bullish phase.
-1774414729546-1774414729547.png)
(The technical analysis of this story was written with the help of an AI tool.)

Hơn một triệu người dùng dựa vào FXStreet để có dữ liệu thị trường thời gian thực, công cụ biểu đồ, góc nhìn chuyên gia và tin tức Forex. Lịch kinh tế toàn diện và các hội thảo web giáo dục giúp nhà giao dịch luôn cập nhật và đưa ra quyết định có tính toán. FXStreet có khoảng 60 nhân sự, chia giữa trụ sở Barcelona và nhiều khu vực toàn cầu.
Đọc thêm


