
Top 3 Price Prediction: Bitcoin, Ethereum, Ripple – Bitcoin eyes $60,000, Ethereum risks $1,750, XRP could test $1
Bởi Vishal Dixit
Đã cập nhật: 5 Jun 2026


BÀI VIẾT PHỔ BIẾN

Bitcoin (BTC), Ethereum (ETH), and Ripple (XRP) prices edge lower on Friday, extending a steady decline of roughly 15% so far this week. Institutional outflows weigh on Bitcoin and Ethereum while XRP largely follows the broader market trend.
- Bitcoin remains below $65,000, with a likelihood of extending the downtrend toward $60,000.
- Ethereum hovers near $1,750, risking a steeper correction to form a lower leg.
- XRP edges lower on Friday, extending its sixth consecutive day in the red.
Bitcoin (BTC), Ethereum (ETH), and Ripple (XRP) prices edge lower on Friday, extending a steady decline of roughly 15% so far this week. Institutional outflows weigh on Bitcoin and Ethereum while XRP largely follows the broader market trend.
Bitcoin and Ethereum ETFs extend the outflows streak
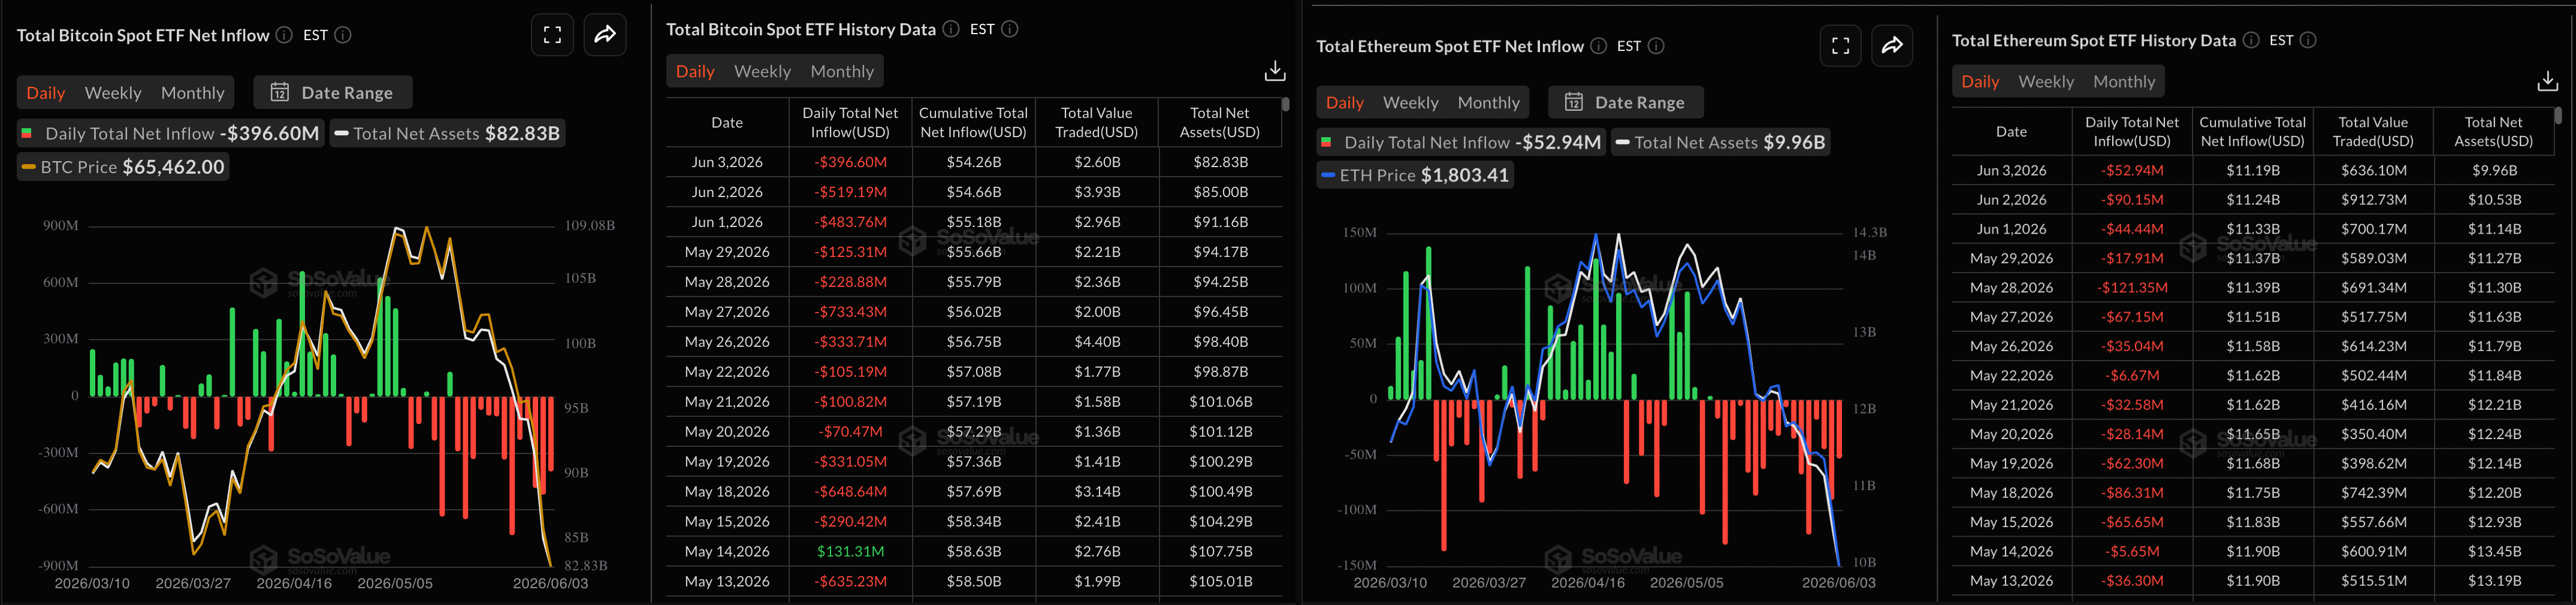
Bitcoin- and Ethereum-focused Exchange Traded Funds (ETFs) extend streaks of 14 and 18 days of outflows, aligning with the recent downturn. CoinGlass data show BTC ETFs recorded $396.60 million in outflows on Thursday, while ETH ETFs logged $52.94 million in outflows. The institutional sell-off phase pushes the broader market conditions bearish.
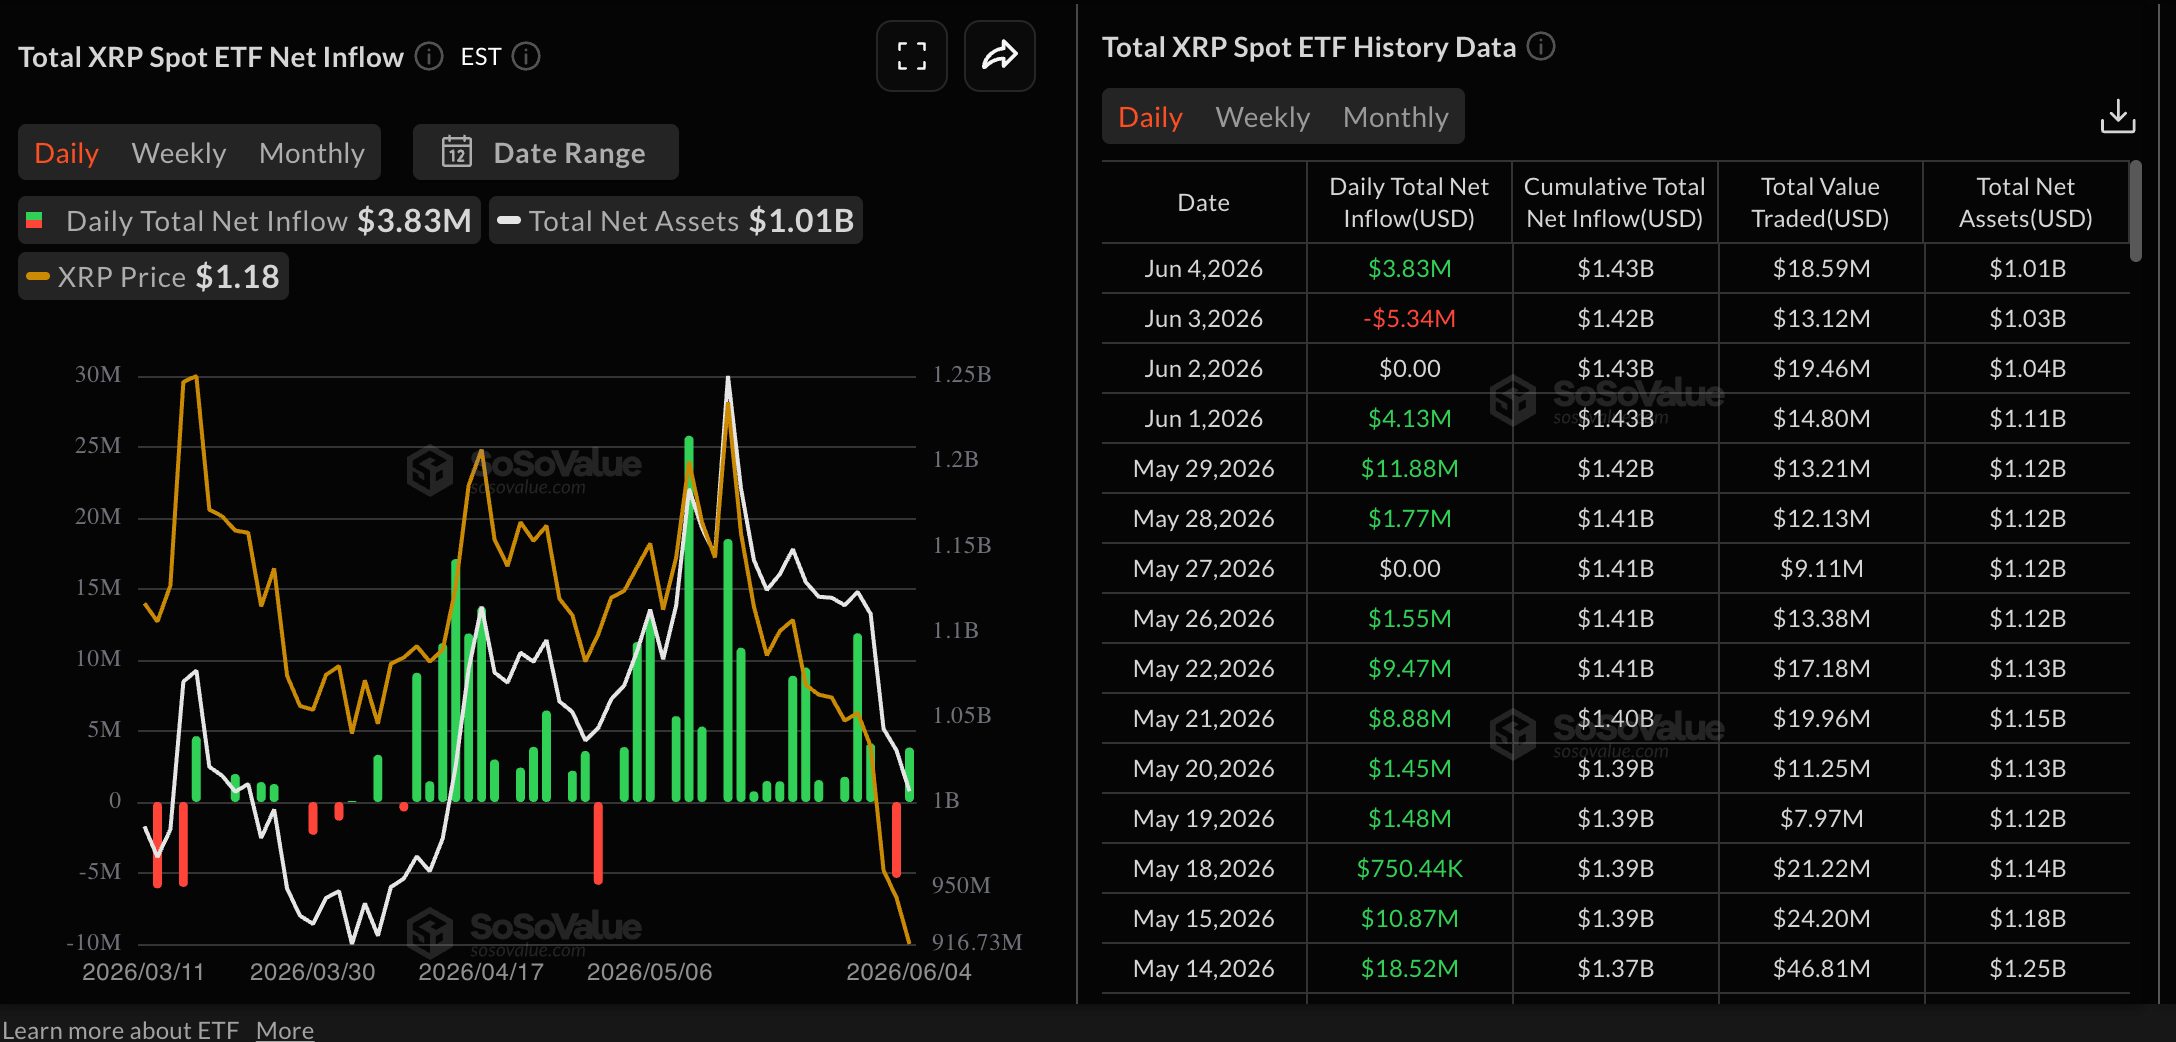
Meanwhile, XRP ETFs show a mild recovery, with $3.83 million in inflows following $5.34 million in outflows on Wednesday, suggesting comparatively greater institutional confidence.
Bitcoin risks a revisit to $60,000
Bitcoin edges below $63,000 at press time on Friday, extending a six-day bearish phase after losing the former rising trendline that now acts as resistance near $71,675. The BTC price remains far below the 50-, 100-, and 200-day Exponential Moving Averages (EMAs), which cluster overhead from roughly $74,300 up to $81,455 and reinforce a capped near-term outlook.
Momentum remains weak, with the Relative Strength Index (RSI) deeply oversold at around 17 on the daily chart, yet the Moving Average Convergence Divergence (MACD) extends further into negative territory as its bearish profile expands. Taken together, the indicators suggest persistent downside pressure despite the risk of corrective bounces.
On the downside, the key support to watch is the horizontal level at $60,000. A decisive break below this floor would open the door to a deeper slide, while holding above it could allow an oversold rebound toward the aforementioned resistance band.
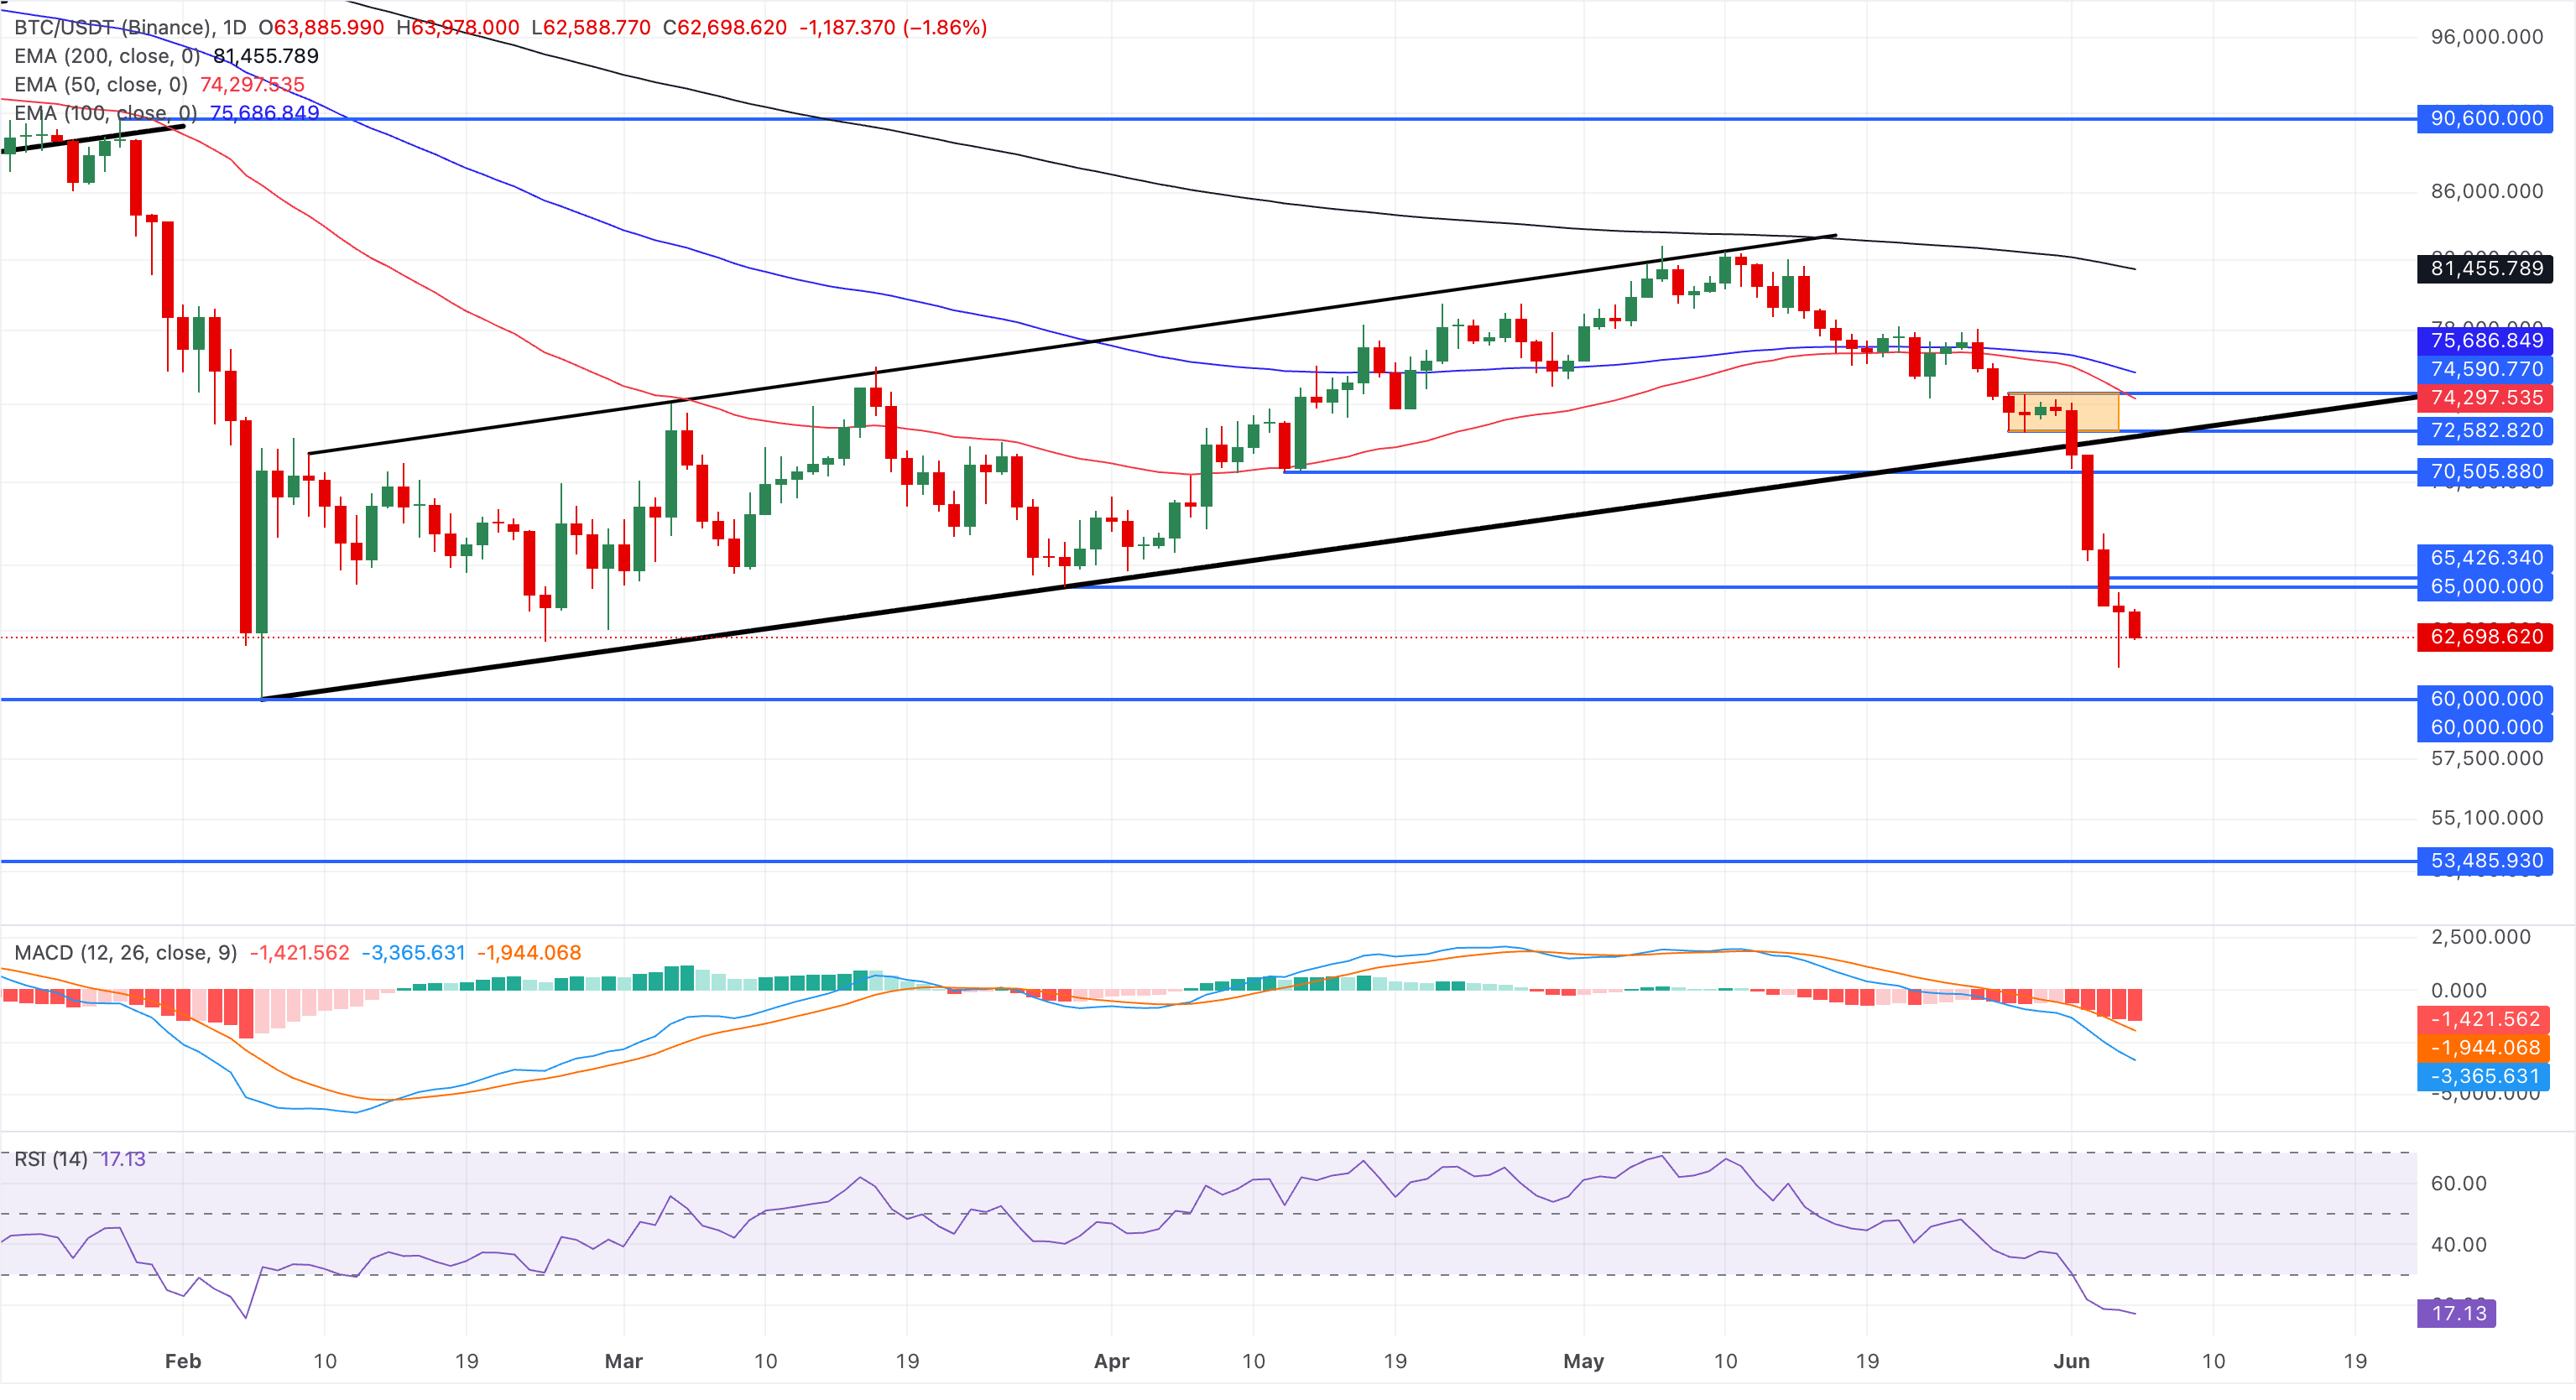
On the topside, initial resistance is seen at the $65,000 broken support level, now resistance, followed by the uptrend trendline around $71,675.
Ethereum extends the waterfall decline
Ethereum is down 2% at the time of writing on Friday, maintaining a bearish bias amid its six-day decline. The major altcoin holds well beneath the 50-day EMA around $2,116 and the 100-day EMA near $2,223, further reinforcing the overhead supply zone.
Momentum indicators on the daily chart align with this negative backdrop. The RSI is deeply oversold around 17, and the MACD remains below its signal line, and the zero line is firmly in negative territory, suggesting downside pressure dominates despite the risk of intermittent corrective bounces.
A break below the February 6 low of $1,747 would leave ETH vulnerable to discovering lower support levels including the $1,689 and $1,538 levels marked by the April 9, 2025 high and April 16 2025 low.
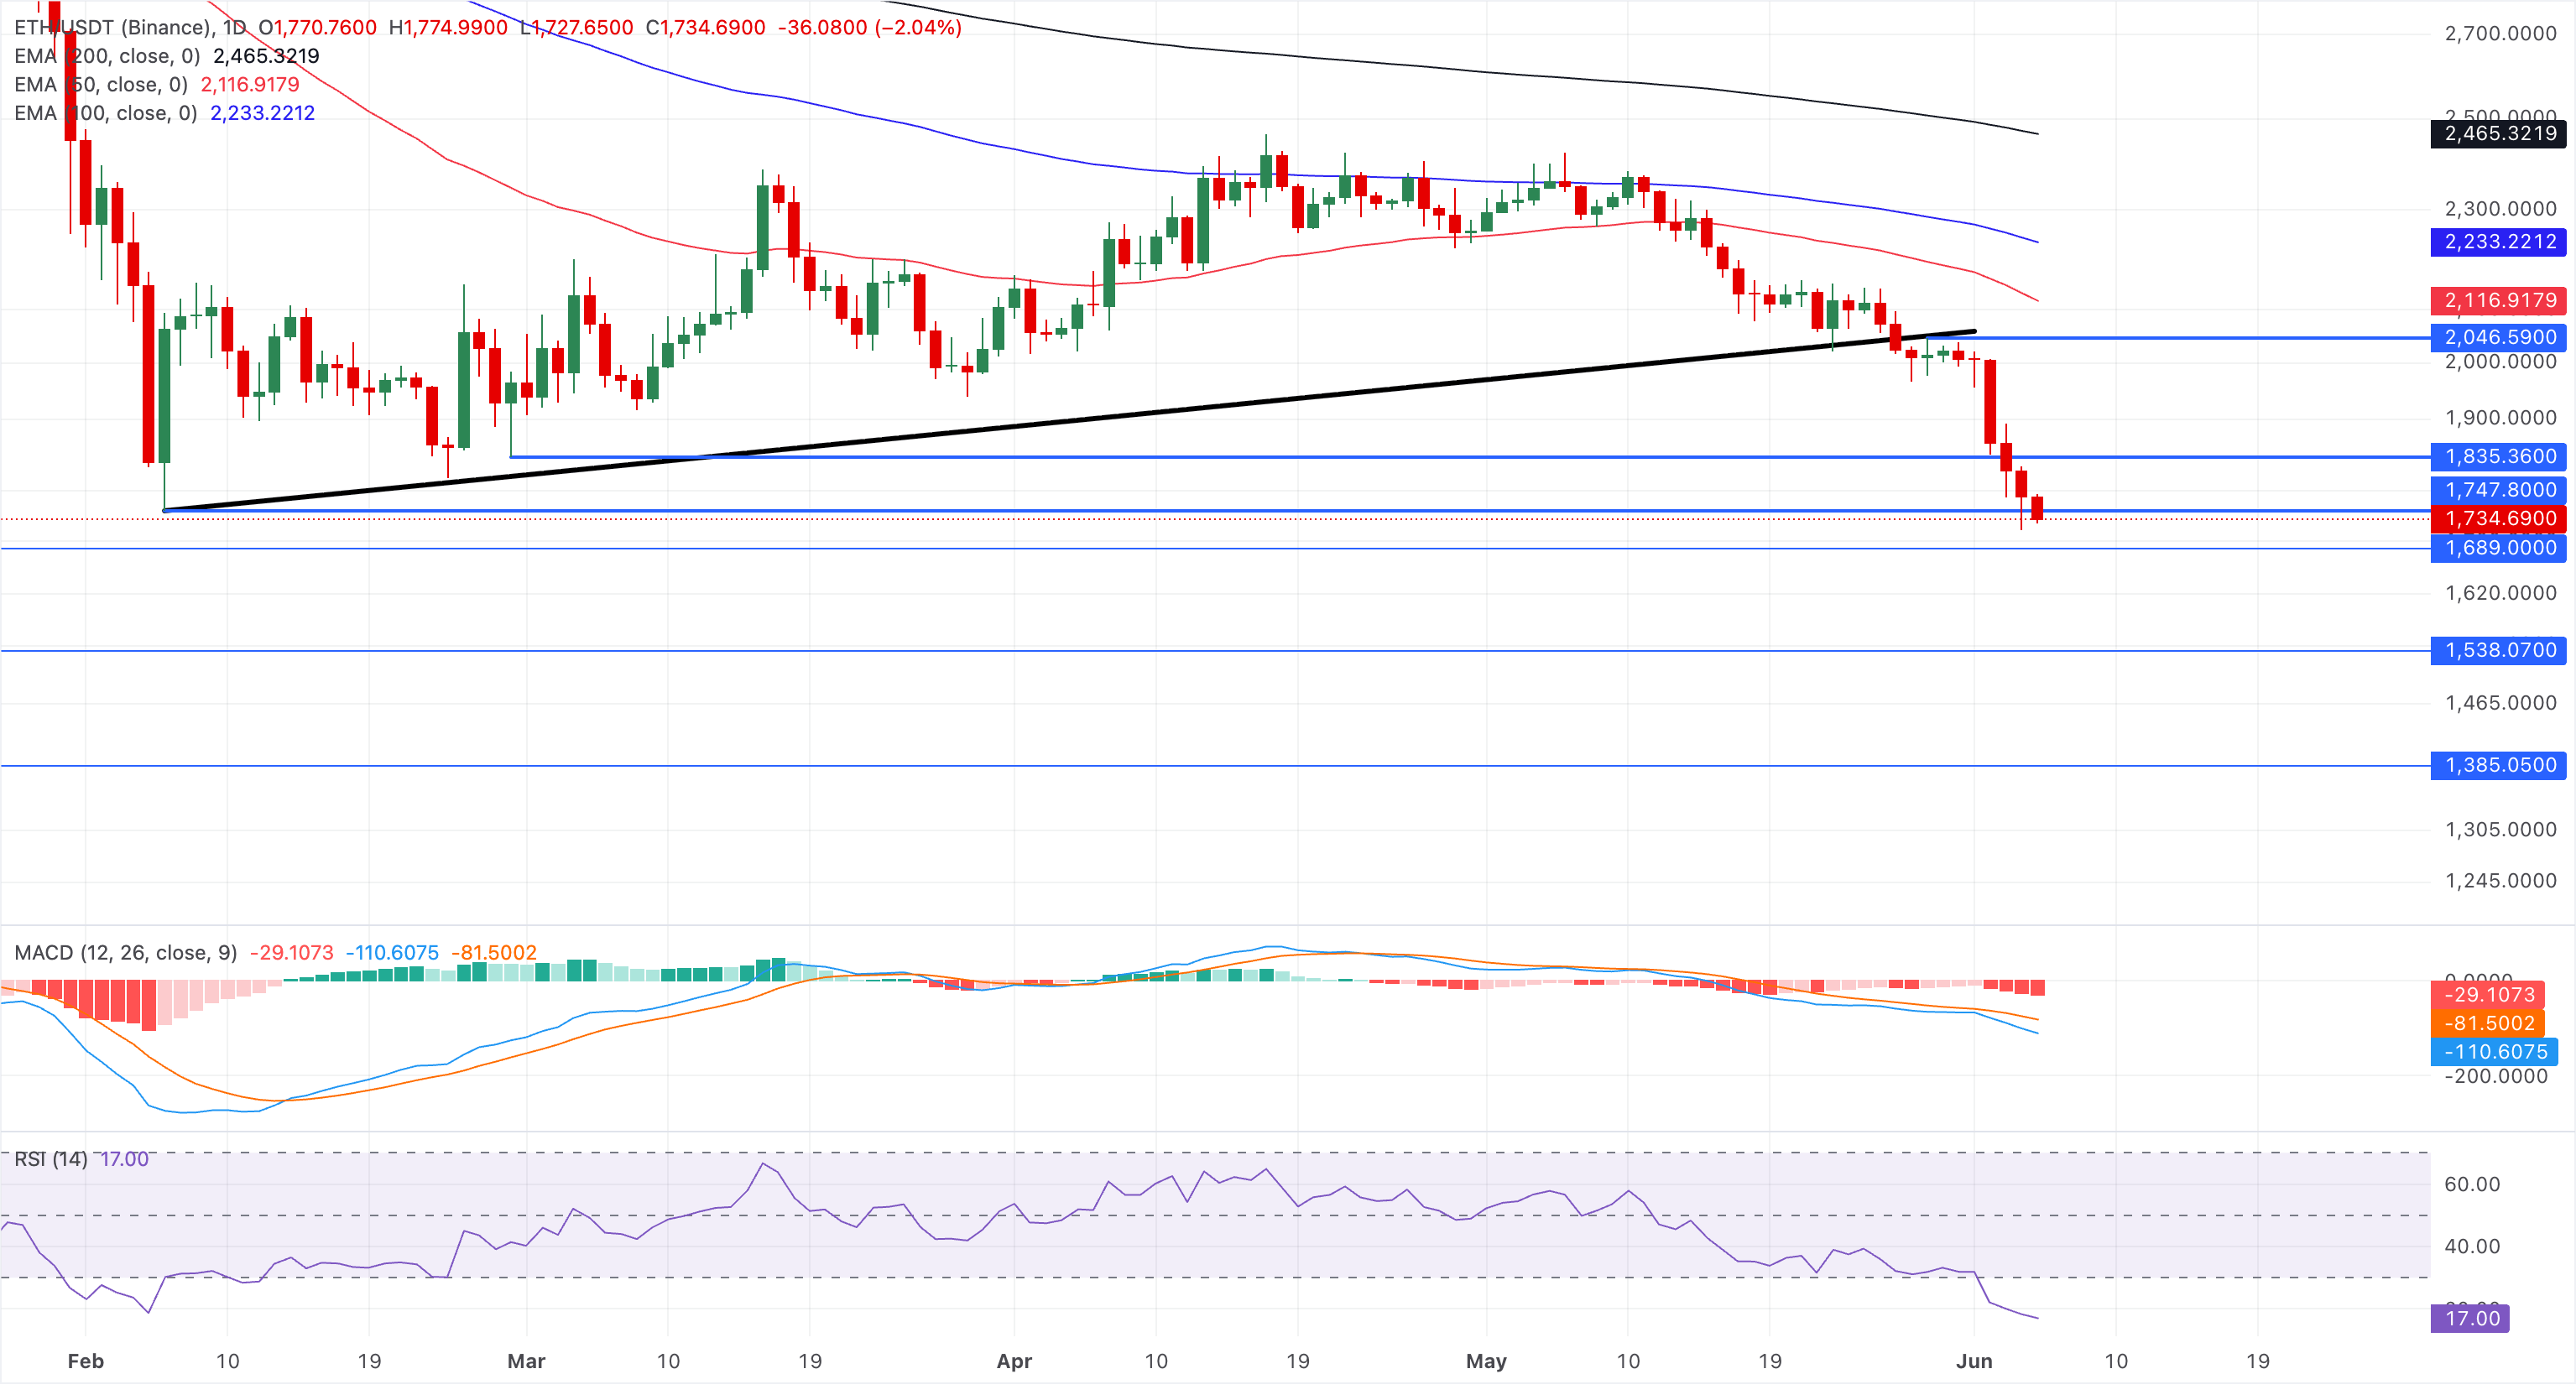
Looking up, the initial resistance emerges at the $1,835 lost support level from February 28, followed by the broken rising trendline around $2,070.
Ripple risks a steeper correction to $1
Ripple is down over 2% at press time on Friday, extending a six-day decline toward the $1.1179 low from February 6. A close below this level would mark the lowest price seen since November 21, 2024, and could open the path toward the $1.00 psychological level, last visited on November 17, 2024.
XRP maintains a clear bearish bias, with price holding well below the key exponential moving averages, reinforcing a heavy topside cap. That said, momentum remains under pressure, with the MACD deep into negative territory with a growing bearish profile, while the RSI sits in oversold territory near 22, hinting that downside may be stretched but not yet reversed.
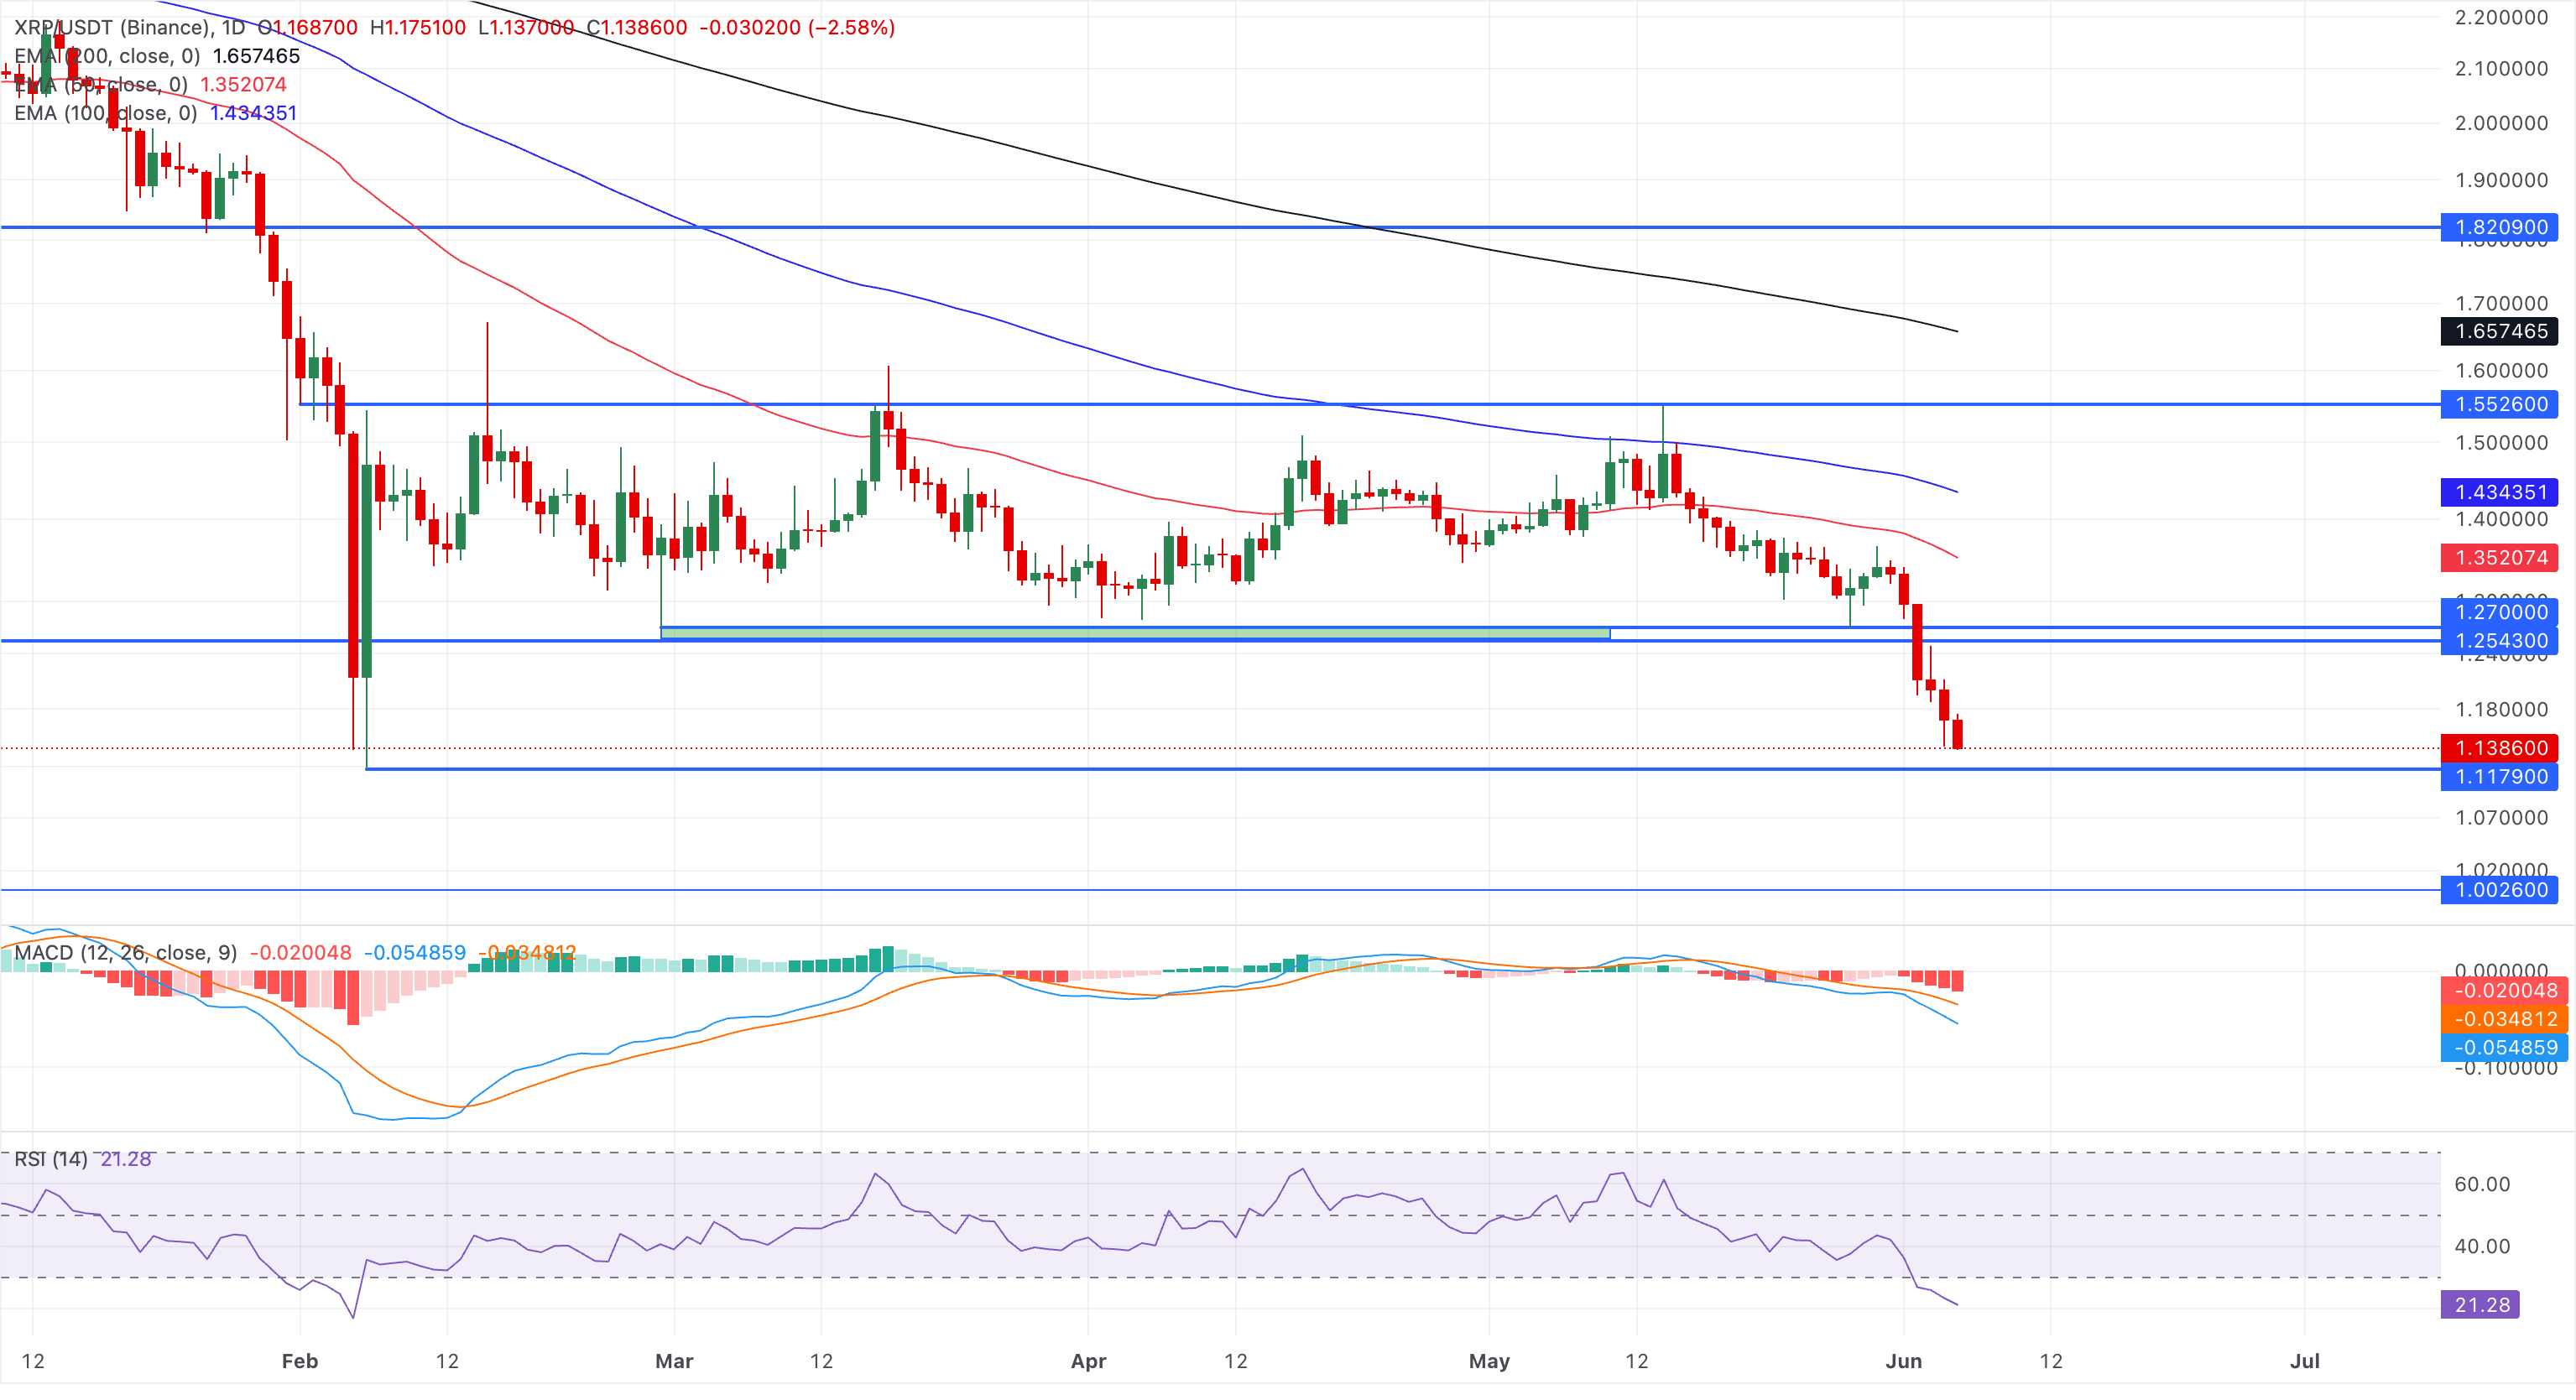
Initial resistance is located at the $1.2543-$1.2700 supply turned resistance zone, followed by the 50-day EMA around $1.3520.
(The technical analysis of this story was written with the help of an AI tool.)
Cryptocurrency metrics FAQs
The developer or creator of each cryptocurrency decides on the total number of tokens that can be minted or issued. Only a certain number of these assets can be minted by mining, staking or other mechanisms. This is defined by the algorithm of the underlying blockchain technology. On the other hand, circulating supply can also be decreased via actions such as burning tokens, or mistakenly sending assets to addresses of other incompatible blockchains.
Market capitalization is the result of multiplying the circulating supply of a certain asset by the asset’s current market value.
Trading volume refers to the total number of tokens for a specific asset that has been transacted or exchanged between buyers and sellers within set trading hours, for example, 24 hours. It is used to gauge market sentiment, this metric combines all volumes on centralized exchanges and decentralized exchanges. Increasing trading volume often denotes the demand for a certain asset as more people are buying and selling the cryptocurrency.
Funding rates are a concept designed to encourage traders to take positions and ensure perpetual contract prices match spot markets. It defines a mechanism by exchanges to ensure that future prices and index prices periodic payments regularly converge. When the funding rate is positive, the price of the perpetual contract is higher than the mark price. This means traders who are bullish and have opened long positions pay traders who are in short positions. On the other hand, a negative funding rate means perpetual prices are below the mark price, and hence traders with short positions pay traders who have opened long positions.

Hơn một triệu người dùng dựa vào FXStreet để có dữ liệu thị trường thời gian thực, công cụ biểu đồ, góc nhìn chuyên gia và tin tức Forex. Lịch kinh tế toàn diện và các hội thảo web giáo dục giúp nhà giao dịch luôn cập nhật và đưa ra quyết định có tính toán. FXStreet có khoảng 60 nhân sự, chia giữa trụ sở Barcelona và nhiều khu vực toàn cầu.
Đọc thêm


