
Top 3 Price Prediction: Bitcoin, Ethereum, Ripple – BTC consolidates, ETH holds support, XRP eyes breakout
Bởi Manish Chhetri
Đã cập nhật: 13 May 2026


BÀI VIẾT PHỔ BIẾN

Bitcoin (BTC), Ethereum (ETH), and Ripple (XRP) trade cautiously on Wednesday as price action approaches key technical levels across these top three cryptocurrencies. BTC stalls near the key resistance level around $82,000 while ETH holds firm above the key support at $2,275.
- Bitcoin price consolidates around $81,000 on Wednesday, after facing resistance at the 200-day EMA at $82,037 earlier this week.
- Ethereum price finds support at the 50-day EMA at $2,275.
- XRP hovers near the upper boundary of its descending channel, with a breakout potentially triggering an upside move.
Bitcoin (BTC), Ethereum (ETH), and Ripple (XRP) trade cautiously on Wednesday as price action approaches key technical levels across these top three cryptocurrencies. BTC stalls near the key resistance level around $82,000 while ETH holds firm above the key support at $2,275. Meanwhile, XRP is approaching the upper boundary of its descending channel, where a breakout will open the door for further gains.
Bitcoin stalls near overhead resistance
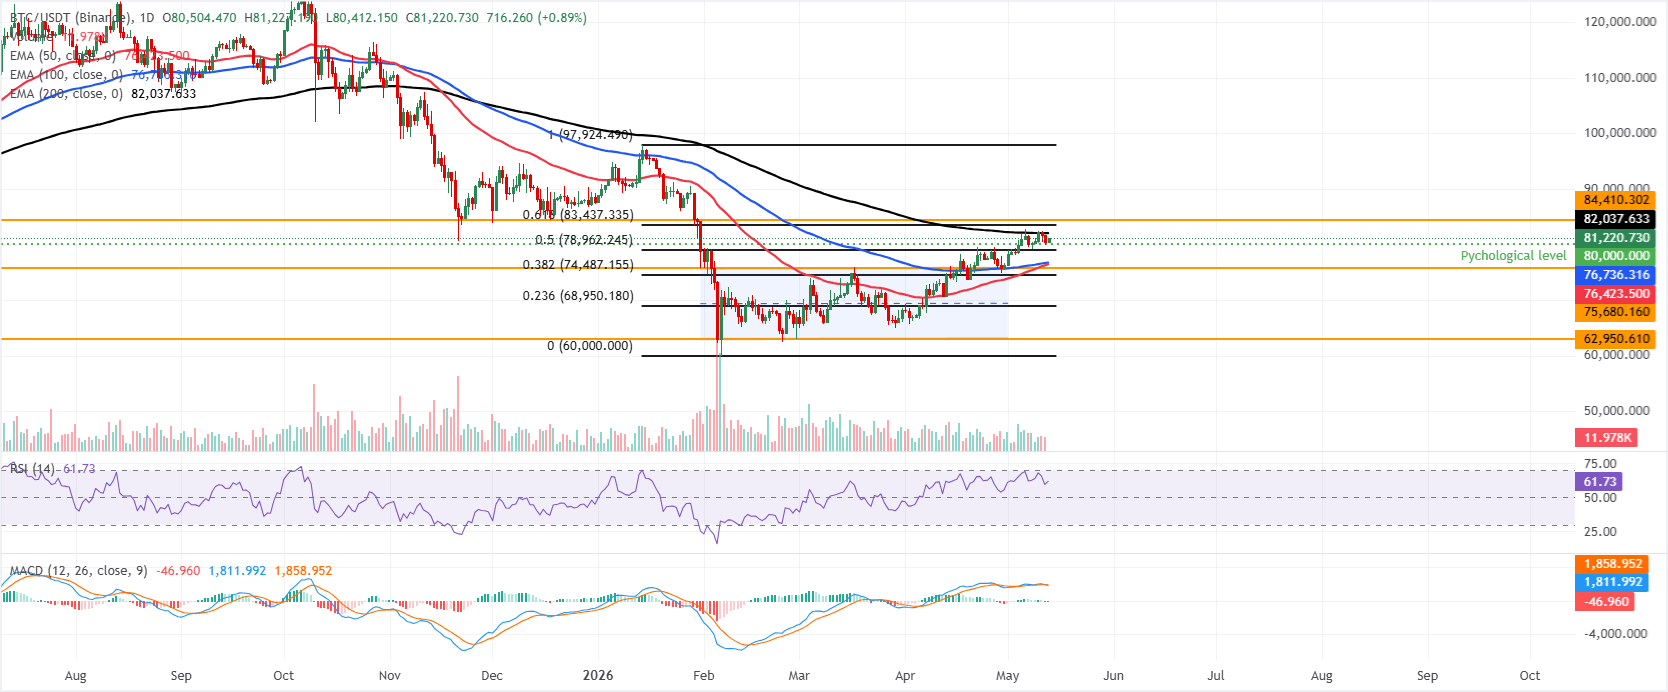
Bitcoin price is trading at $81,200 on Wednesday, holding a constructive bullish bias as it sits above the 50-day and 100-day Exponential Moving Averages (EMAs), clustered in the mid-$76,000s, while still capped by the 200-day EMA near $82,037, which is acting as the overhead supply zone.
The Crypto King also trades above the 50% retracement at roughly $78,962 (drawn from January high to the February low), suggesting dips remain supported, while the Relative Strength Index (RSI) on the daily chart around 62 hints at firm but not yet overbought upside momentum even as the Moving Average Convergence Divergence (MACD) has slipped slightly into negative territory, flagging the risk of a pause or shallow consolidation before further gains.
On the topside, immediate resistance emerges at the 200-day EMA around $82,037, with the 61.8% Fibonacci retracement near $83,437 next, ahead of a more substantial horizontal barrier at about $84,410.
On the downside, initial support lies at the psychological $80,000 level, followed by the 50% retracement at $78,962. Then, the 100-day and 50-day EMAs are near $76,735 and $76,421, respectively, with the former channel’s top resistance turned support around $75,680, reinforcing a broader demand band above $74,500.
Ethereum holds firm above key support
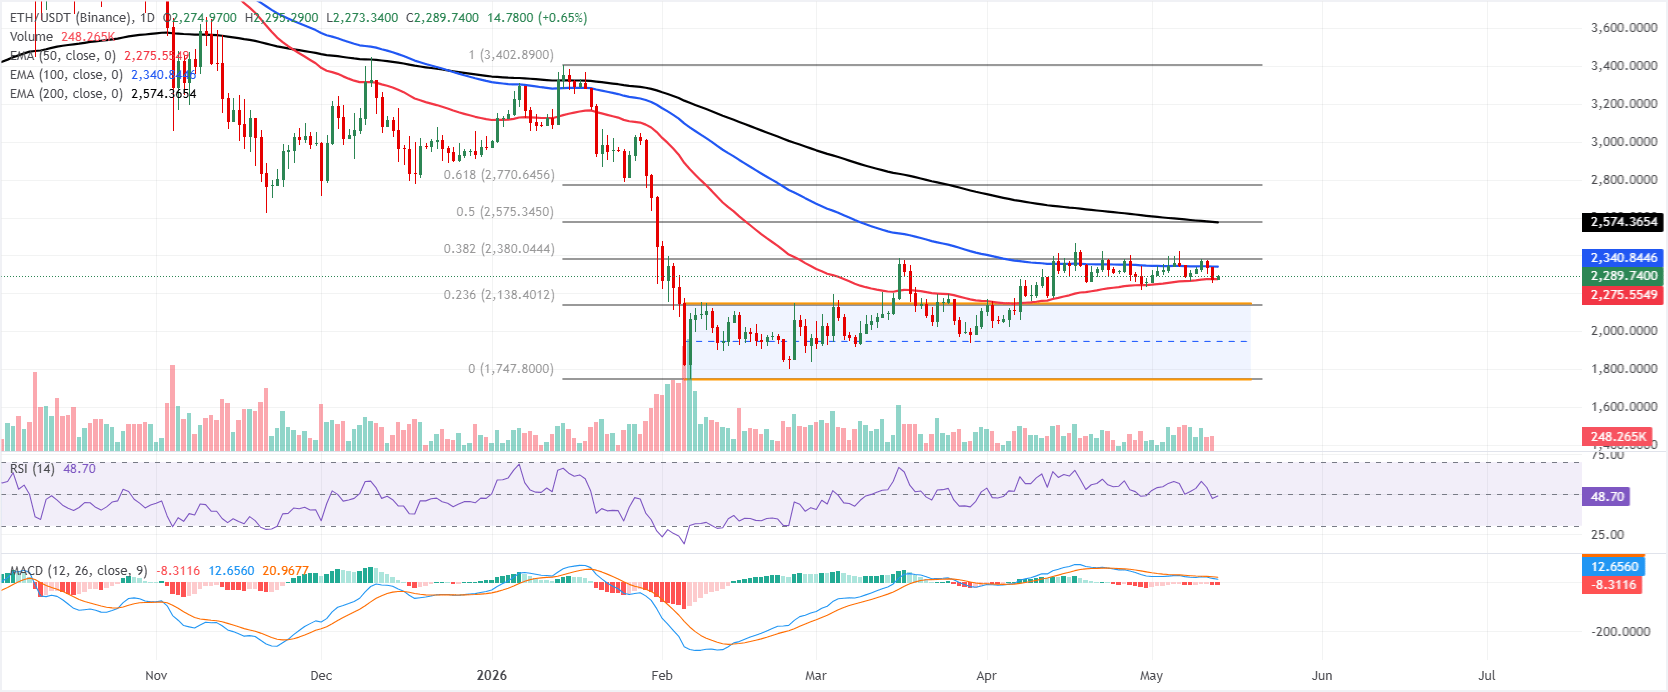
Ethereum trades at $2,289 on Wednesday, maintaining a mildly bearish bias as price holds just above the 50-day EMA at $2,275 while staying capped beneath the 100-day EMA at $2,340.
ETH also trades below the 38.2% Fibonacci retracement of the latest upswing at roughly $2,380 and remains well under the 200-day EMA around $2,574, suggesting rallies are still meeting overhead supply.
The RSI hovers just below the neutral 50 mark, and the MACD line is below its signal line and below the zero line, with a negative histogram, hinting that upside momentum is fragile despite the recent bounce off short-term support.
On the topside, immediate resistance emerges at the 100-day EMA near $2,340, with the 38.2% Fibonacci retracement at about $2,380 as the next hurdle, while the 200-day EMA around $2,574 marks a broader bearish cap if buyers attempt a stronger recovery.
On the downside, initial support is seen at the 50-day EMA around $2,275, followed by a structural band near the former channel top around $2,148 and the 23.6% Fibonacci level at roughly $2,138; a sustained break below that zone would expose the channel base and major swing floor around $1,748, where medium-term buyers could look to re-enter.
XRP could extend gains if it breaks above the descending channel pattern
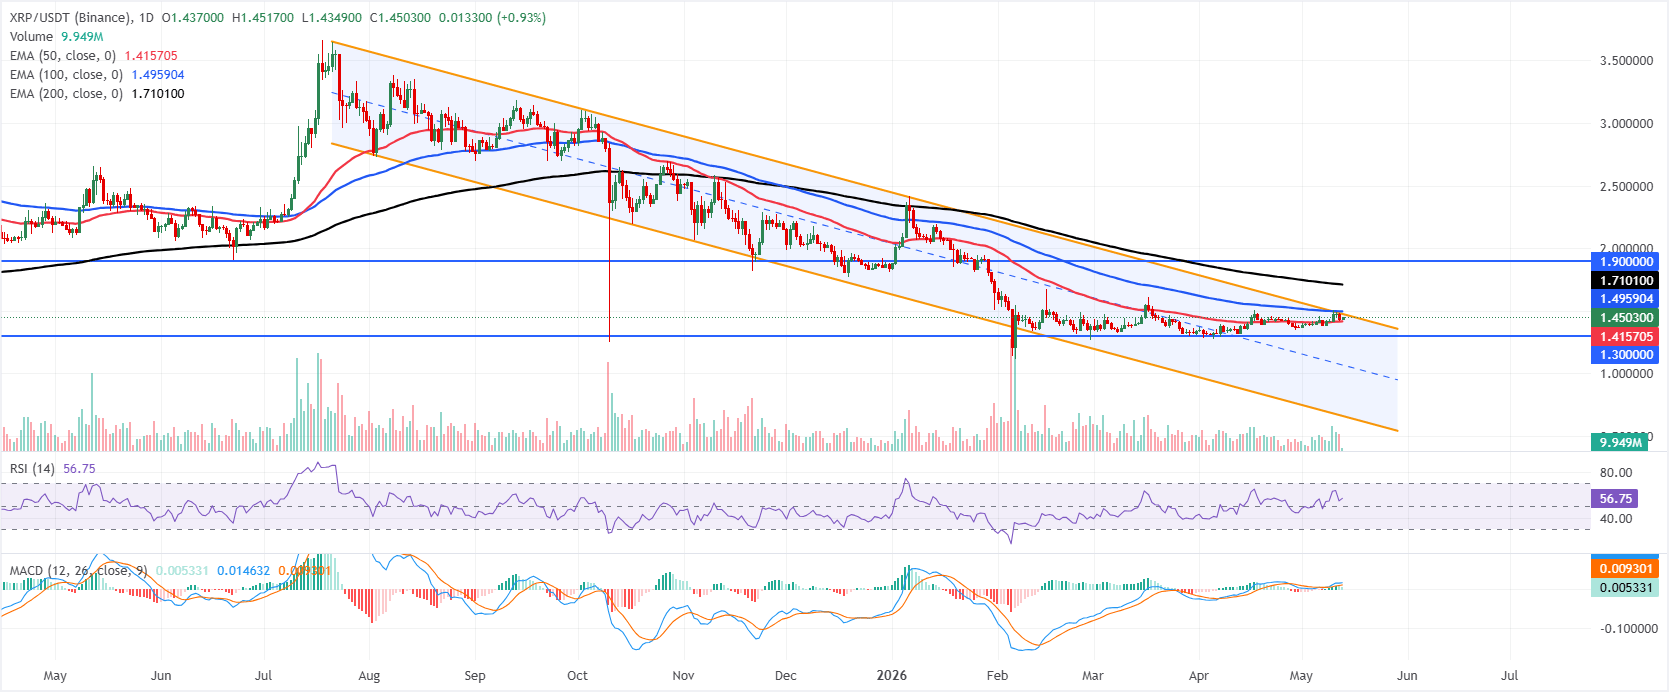
XRP price trades at $1.45 and holds above the 50-day EMA at $1.41, suggesting tentative near-term support, but remains capped within a broader downward parallel channel and below the 100-day and 200-day EMAs at $1.4959 and $1.7101, respectively, which keeps the broader tone only mildly constructive.
The RSI is around 56, and a slightly positive MACD reading hints at improving momentum, yet buyers still need to clear nearby overhead levels to strengthen the bullish case.
On the topside, initial resistance emerges at the channel’s upper boundary near $1.47, followed by the 100-day EMA at $1.49, while the 200-day EMA at $1.71 and the horizontal resistance around $1.90 form a more distant supply zone within the broader downtrend.
On the downside, immediate support is seen at the 50-day EMA around $1.41, with the horizontal floor at $1.30 acting as the next key level; a deeper pullback toward the channel bottom near $0.65 would only come into focus if these supports give way.
(The technical analysis of this story was written with the help of an AI tool.)
Cryptocurrency prices FAQs
Token launches influence demand and adoption among market participants. Listings on crypto exchanges deepen the liquidity for an asset and add new participants to an asset’s network. This is typically bullish for a digital asset.
A hack is an event in which an attacker captures a large volume of the asset from a DeFi bridge or hot wallet of an exchange or any other crypto platform via exploits, bugs or other methods. The exploiter then transfers these tokens out of the exchange platforms to ultimately sell or swap the assets for other cryptocurrencies or stablecoins. Such events often involve an en masse panic triggering a sell-off in the affected assets.
Macroeconomic events like the US Federal Reserve’s decision on interest rates influence crypto assets mainly through the direct impact they have on the US Dollar. An increase in interest rate typically negatively influences Bitcoin and altcoin prices, and vice versa. If the US Dollar index declines, risk assets and associated leverage for trading gets cheaper, in turn driving crypto prices higher.
Halvings are typically considered bullish events as they slash the block reward in half for miners, constricting the supply of the asset. At consistent demand if the supply reduces, the asset’s price climbs.

Hơn một triệu người dùng dựa vào FXStreet để có dữ liệu thị trường thời gian thực, công cụ biểu đồ, góc nhìn chuyên gia và tin tức Forex. Lịch kinh tế toàn diện và các hội thảo web giáo dục giúp nhà giao dịch luôn cập nhật và đưa ra quyết định có tính toán. FXStreet có khoảng 60 nhân sự, chia giữa trụ sở Barcelona và nhiều khu vực toàn cầu.
Đọc thêm


