
Top Crypto Gainers: Aster, Decred, and Kaspa rise as selling pressure wanes
Bởi Vishal Dixit
Ngày xuất bản: 9 Feb 2026 | Ngày chỉnh sửa: 9 Feb 2026


BÀI VIẾT PHỔ BIẾN

Altcoins such as Aster (ASTER), Decred (DCR), and Kaspa (KAS) are leading the broader cryptocurrency market recovery over the last 24 hours, as Bitcoin (BTC) holds above $70,000 on Monday, up from the $60,000 dip on Thursday.
- Aster remains steady on Monday after breaking a resistance trendline on Sunday with an 11% increase.
- Decred extends recovery by 4% on Monday, with bulls targeting a key resistance breakout.
- Kaspa holds above the 8% Sunday gains as selling pressure eases, approaching a crucial supply zone.
Altcoins such as Aster (ASTER), Decred (DCR), and Kaspa (KAS) are leading the broader cryptocurrency market recovery over the last 24 hours, as Bitcoin (BTC) holds above $70,000 on Monday, up from the $60,000 dip on Thursday. Technically, the recovery in ASTER, DCR, and KAS lacks momentum and is driven by the short-term easing of selling pressure. If Bitcoin extends the decline, altcoins would likely face similar or more intense selling pressure.
Aster breakout rally struggles to pick up momentum
Aster rose 11% on Sunday, closing above a long-term resistance trendline connecting the October 7 and November 19 highs. At the time of writing, ASTER is holding above $0.600 on Monday, below the declining 50-day Exponential Moving Average at $0.683, keeping the near-term bias capped.
The technical indicators on the daily chart suggest an increased likelihood of renewed bullish momentum in ASTER, corroborating the breakout rally thesis. The Moving Average Convergence Divergence (MACD) crosses above the signal line on Saturday, starting a positive wave of successively rising MACD histograms. At the same time, the Relative Strength Index is at 50, hovering around its midline, signaling a neutral shift as selling pressure wanes.
The 50-day Exponential Moving Average (EMA) at $0.683, followed by the R1 Pivot Point at $0.740, could serve as overhead resistance.
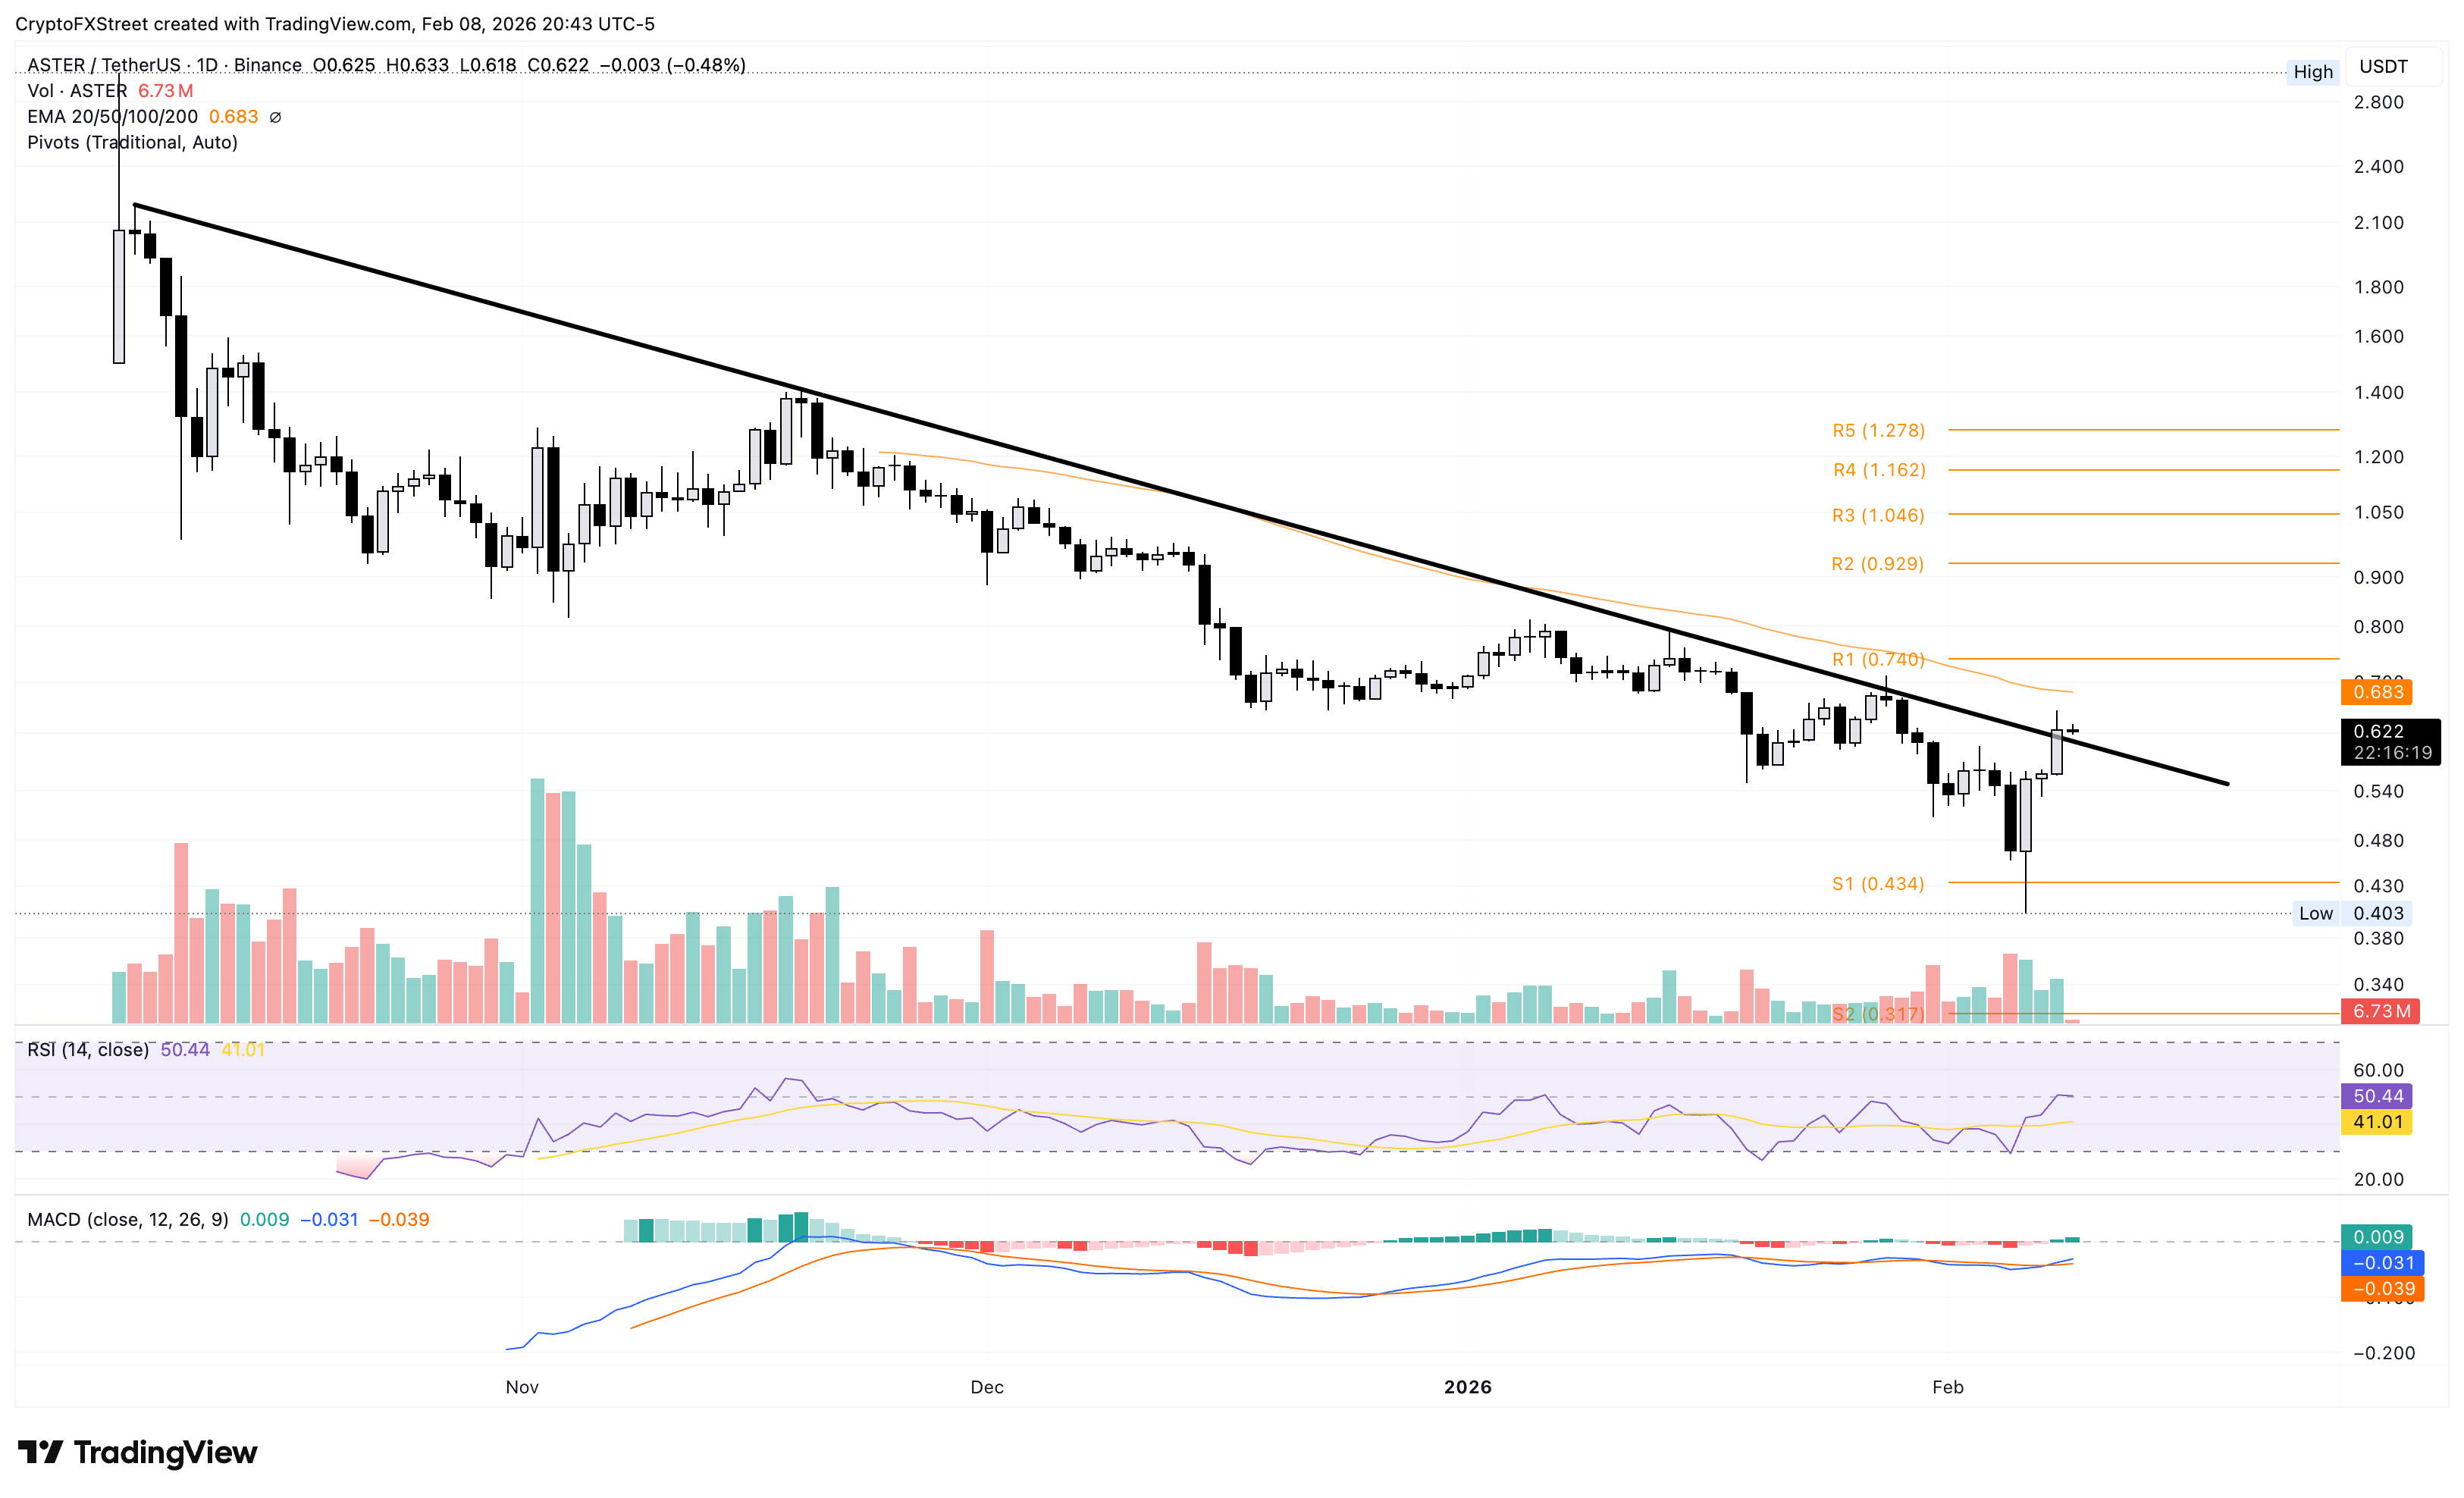
On the flip side, the crucial support remains the $0.500 psychological mark, followed by a deeper zone at the S1 Pivot Point at $0.434.
Decred extends its rally as buying pressure resurfaces
Decred is up 4% at press time on Monday, extending the roughly 30% gains from last week. The privacy coin is holding above the 50- and 200-day EMAs, with the shorter above the longer average, reinforcing a bullish bias.
The MACD remains above the signal line following Thursday's bullish crossover, indicating rising bullish momentum.
The RSI at 70.71 enters the overbought zone, indicating strengthening buying pressure.
The DCR rally approaches the 38.2% Fibonacci retracement level, drawn from the November 4 high of $70 to the December 23 low of $14.21, at $26.12. If DCR clears this level, it could target the 50% retracement at $31.53.
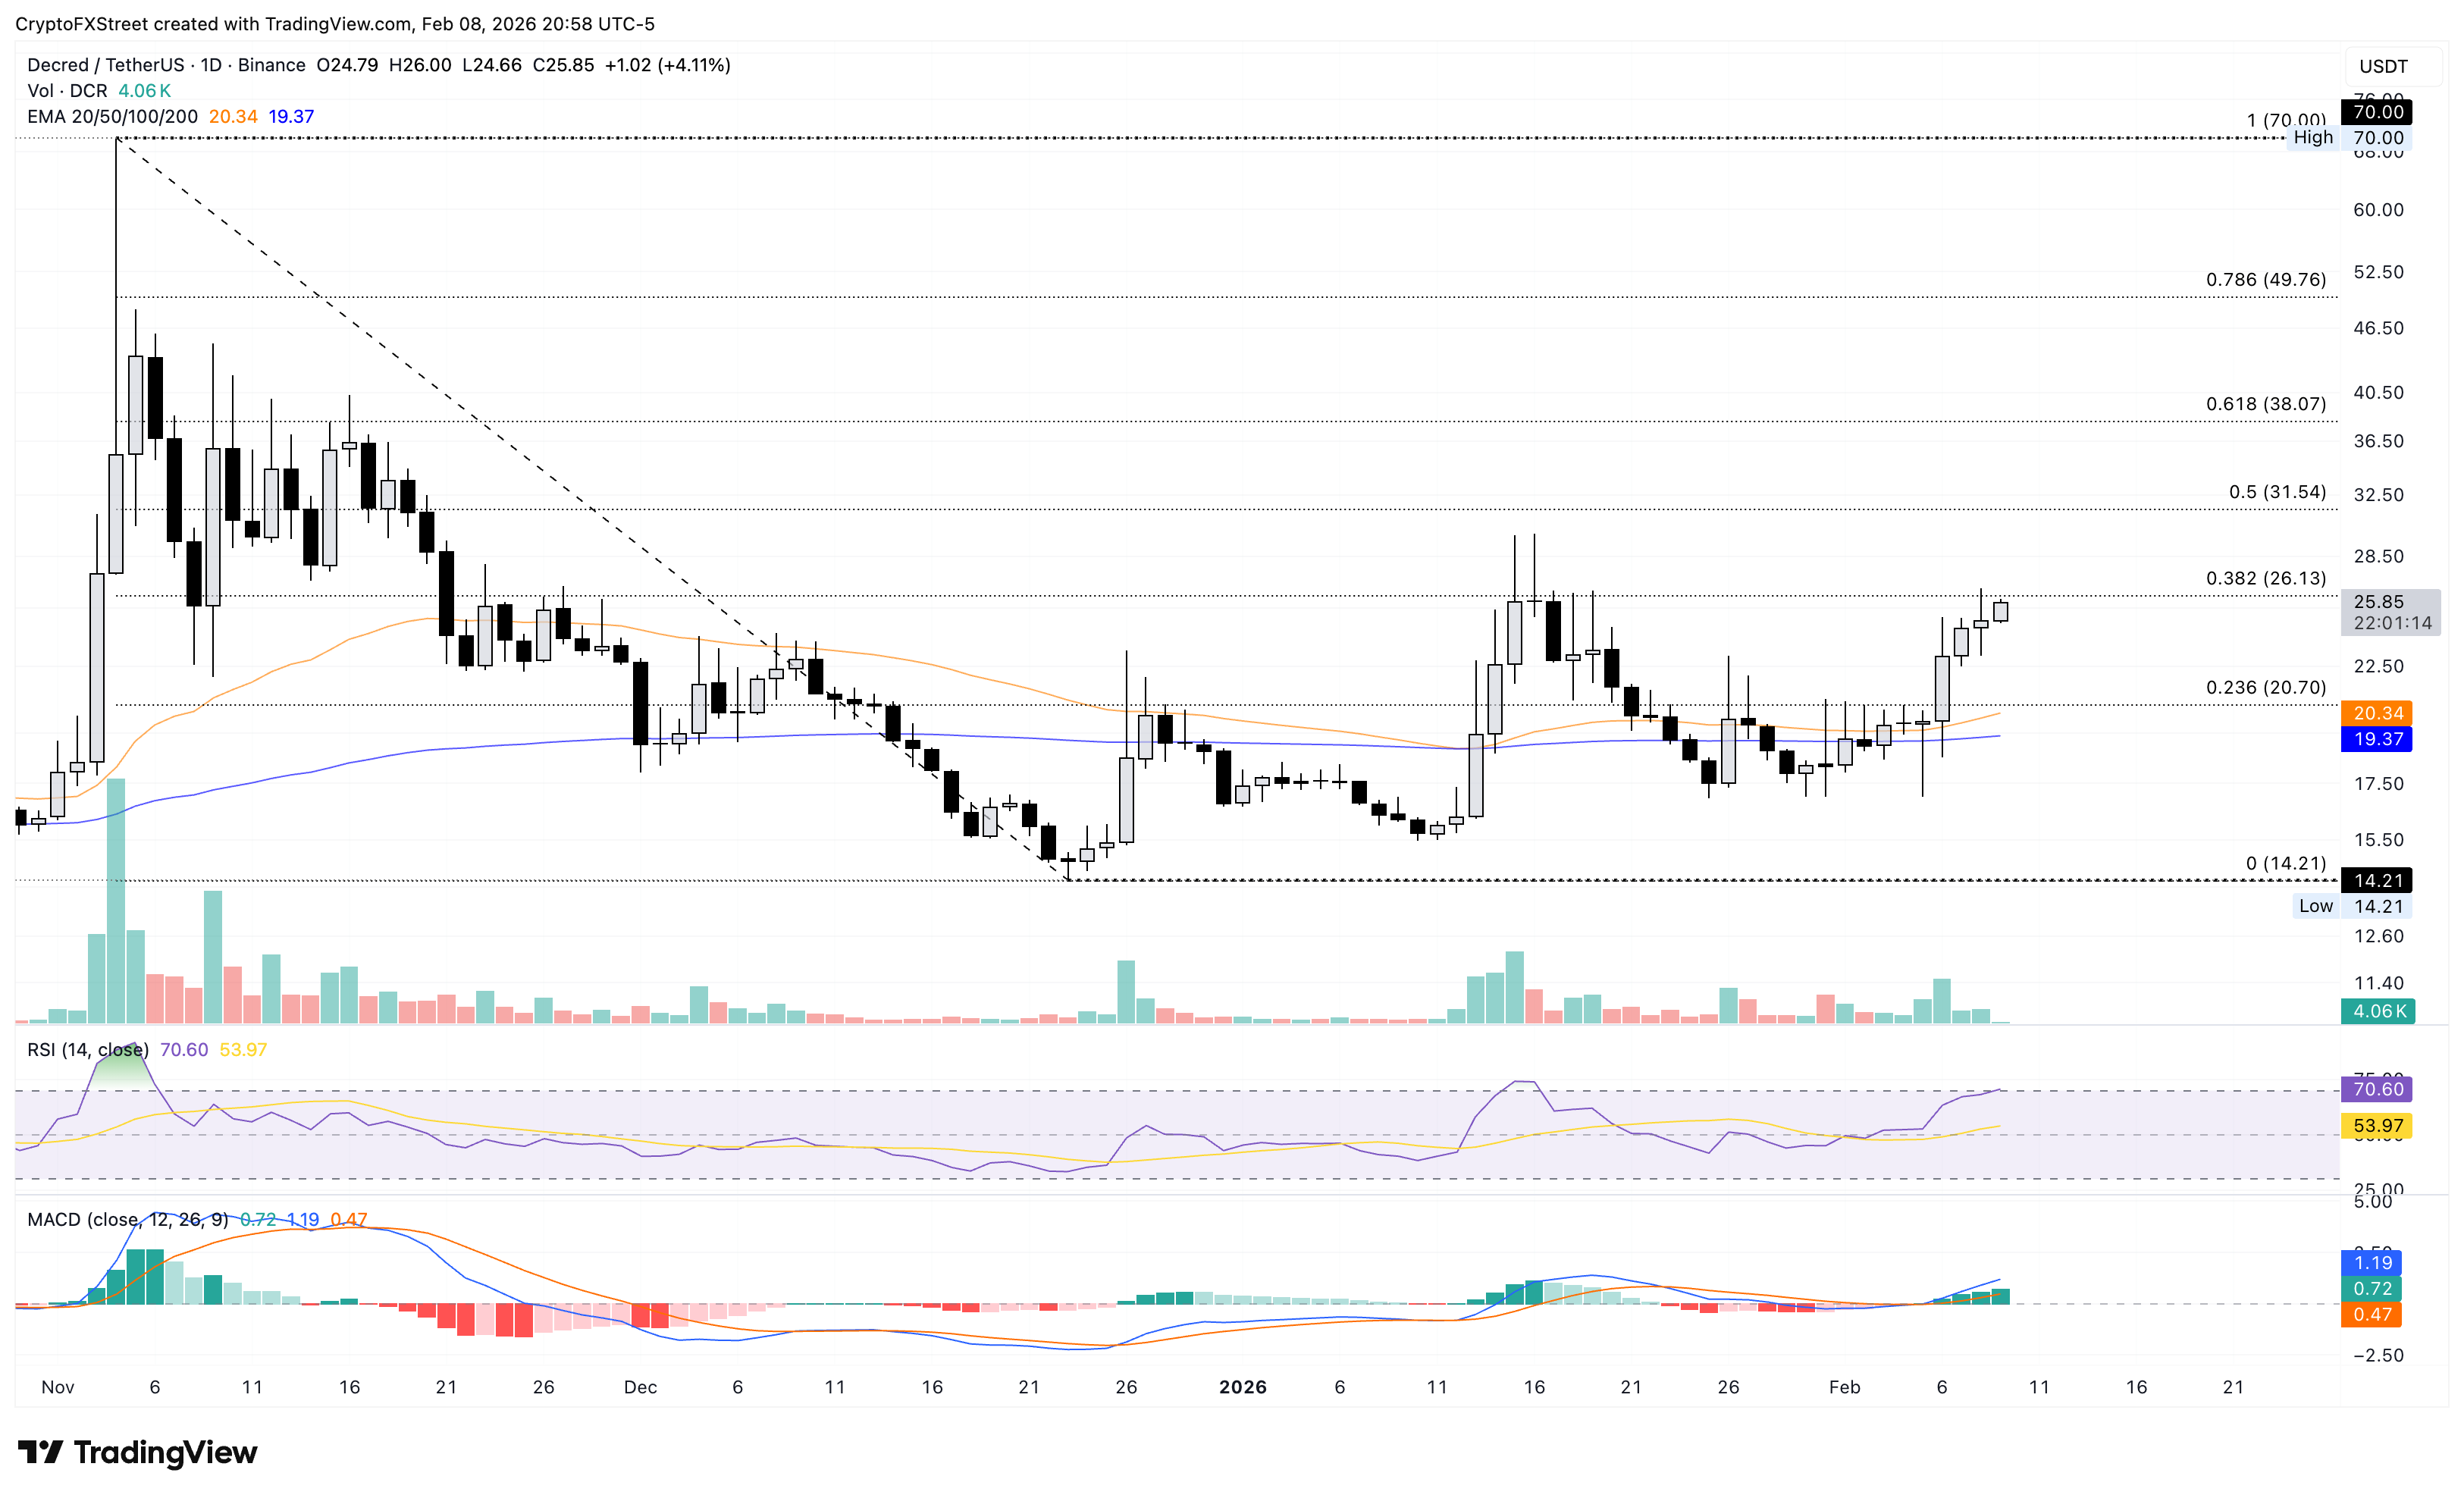
However, failure to clear that barrier would cap gains and encourage a pullback toward the 23.60% Fibonacci retracement at $20.70.
Kaspa approaches key resistance zone
Kaspa steadies above $0.03300 at press time on Monday, significantly lower than the declining 50- and 200-day EMAs, preserving a bearish bias. The rebound from Thursday’s low at $0.02518, coinciding with Bitcoin’s dip to $60,000, reflects an ease in selling pressure.
The MACD histogram has shifted slightly positive after a steady contraction, indicating that the MACD line has crossed above the signal line. Both lines sit near or slightly below zero, so momentum repair remains tentative. Meanwhile, the RSI at 42, below the midline, points to a weak upside impulse.
The overhead supply zone, ranging from the $0.03607 to $0.03865, could cap the recovery. A potential breakout could target the R1 Pivot Point at $0.04751.
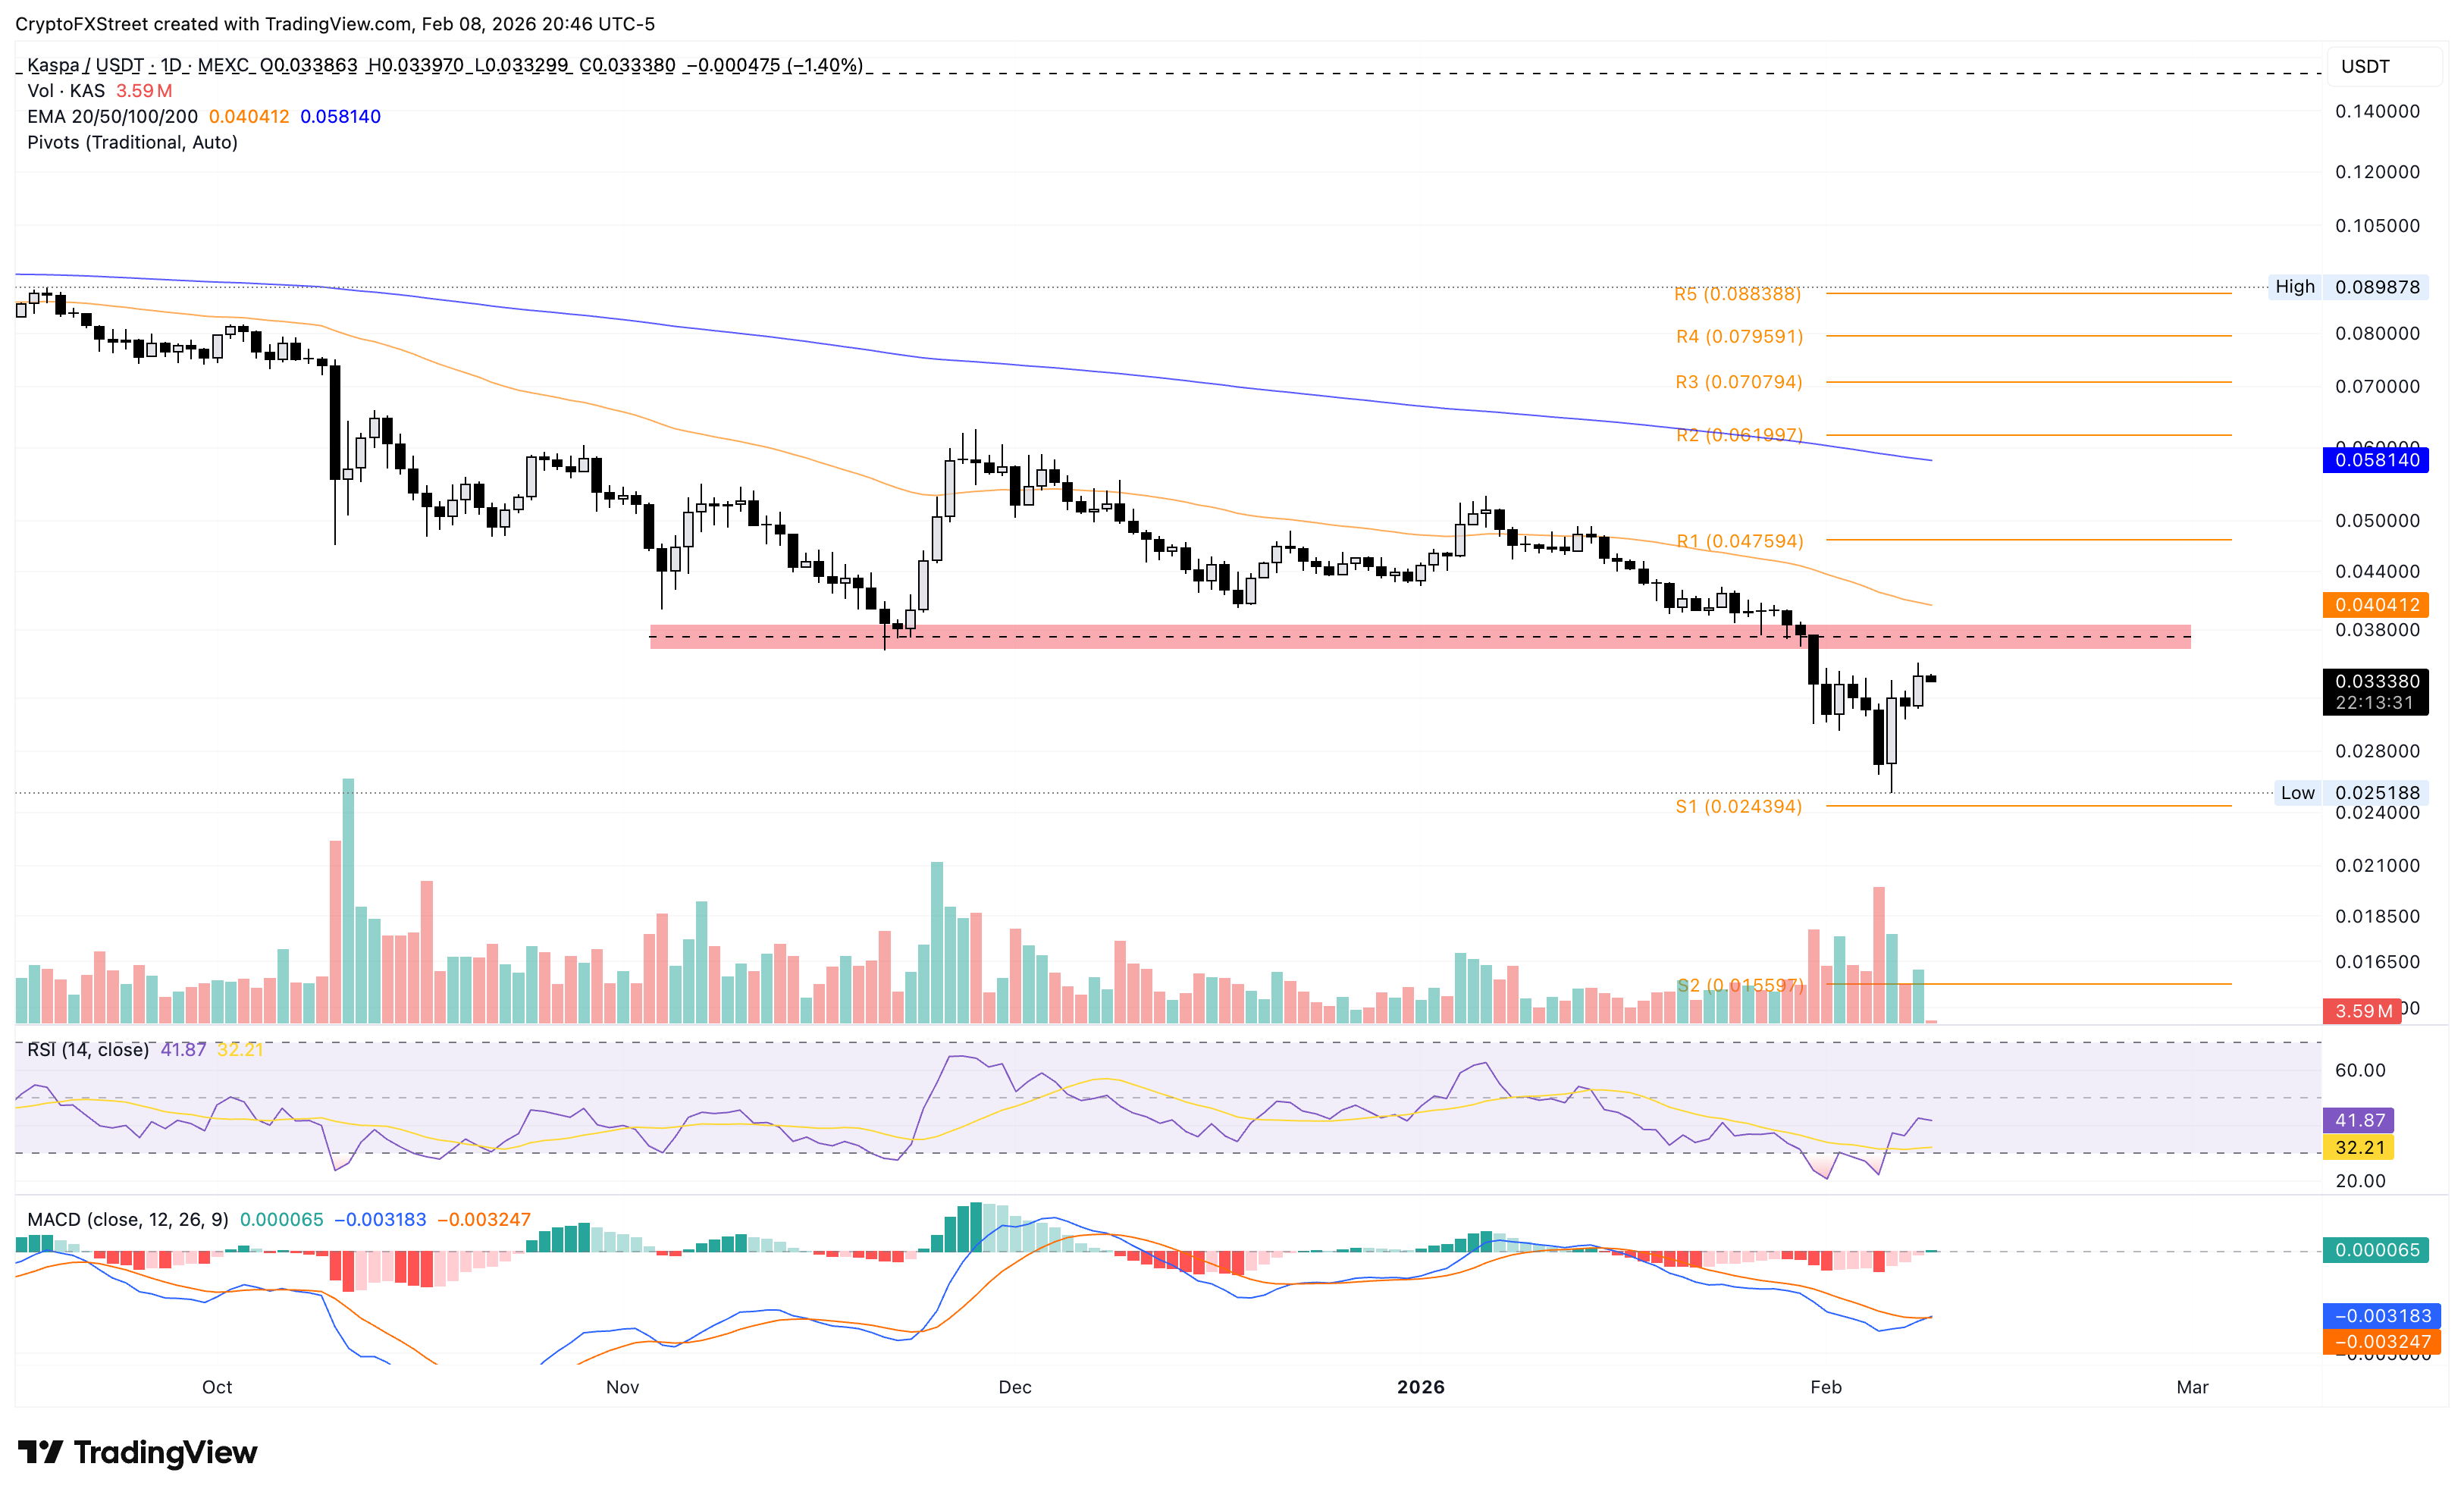
However, a downside reversal could find support at the S1 Pivot Point at $0.02439.
(The technical analysis of this story was written with the help of an AI tool.)

Hơn một triệu người dùng dựa vào FXStreet để có dữ liệu thị trường thời gian thực, công cụ biểu đồ, góc nhìn chuyên gia và tin tức Forex. Lịch kinh tế toàn diện và các hội thảo web giáo dục giúp nhà giao dịch luôn cập nhật và đưa ra quyết định có tính toán. FXStreet có khoảng 60 nhân sự, chia giữa trụ sở Barcelona và nhiều khu vực toàn cầu.
Đọc thêm


