
Top Crypto Gainers: Morpho, Ether.fi, and Pippin rally amid market pressure
Bởi Vishal Dixit
Ngày xuất bản: 25 Feb 2026 | Ngày chỉnh sửa: 25 Feb 2026


BÀI VIẾT PHỔ BIẾN

Altcoins, including Morpho (MORPHO), Ether.fi (ETHFI) and Pippin (PIPPIN) are leading the gains over the last 24 hours as the broader cryptocurrency market remains under pressure. Technically, the recovery in MORPHO, ETHFI, and PIPPIN shows upside potential as buying pressure increases.
- Morpho is up 3% on Wednesday, extending its 10% rebound from the previous day.
- Ether.fi extends higher by 2%, building on Tuesday’s 10% gains within a consolidation range, with bulls aiming for a breakout.
- Pippin holds steady above $0.80 on Wednesday after a four-day rally, accounting for roughly 70% gains.
Altcoins, including Morpho (MORPHO), Ether.fi (ETHFI) and Pippin (PIPPIN) are leading the gains over the last 24 hours as the broader cryptocurrency market remains under pressure. Technically, the recovery in MORPHO, ETHFI, and PIPPIN shows upside potential as buying pressure increases.
Morpho extends the trendline breakout rally
Morpho extends the breakout rally from a resistance trendline on the daily logarithmic chart, connecting the August 22 and November 13 highs. At the time of writing, Morpho is up 3% on Wednesday, extending the 10% bounce back from the 200-day Exponential Moving Average (EMA) from the previous day.
The recovery run targets the $1.9250 resistance marked by the November 18 high. A decisive close above this level could aim for the $2.00 round figure.
Morpho trades significantly higher than the 50-day and 200-day EMAs, while the positive slope in the moving averages indicates the possibility of a Golden Cross pattern. Typically, a golden cross triggers a buy signal as the short-term recovery outpaces the prevailing trend.
The technical indicators on the daily chart maintain a buy-side bias. The Relative Strength Index (RSI) at 71 enters the overbought region as buying pressure increases. At the same time, the Moving Average Convergence Divergence (MACD) shows a steady upward trend, with its signal line, as the positive histogram widens, indicating heightened bullish momentum.
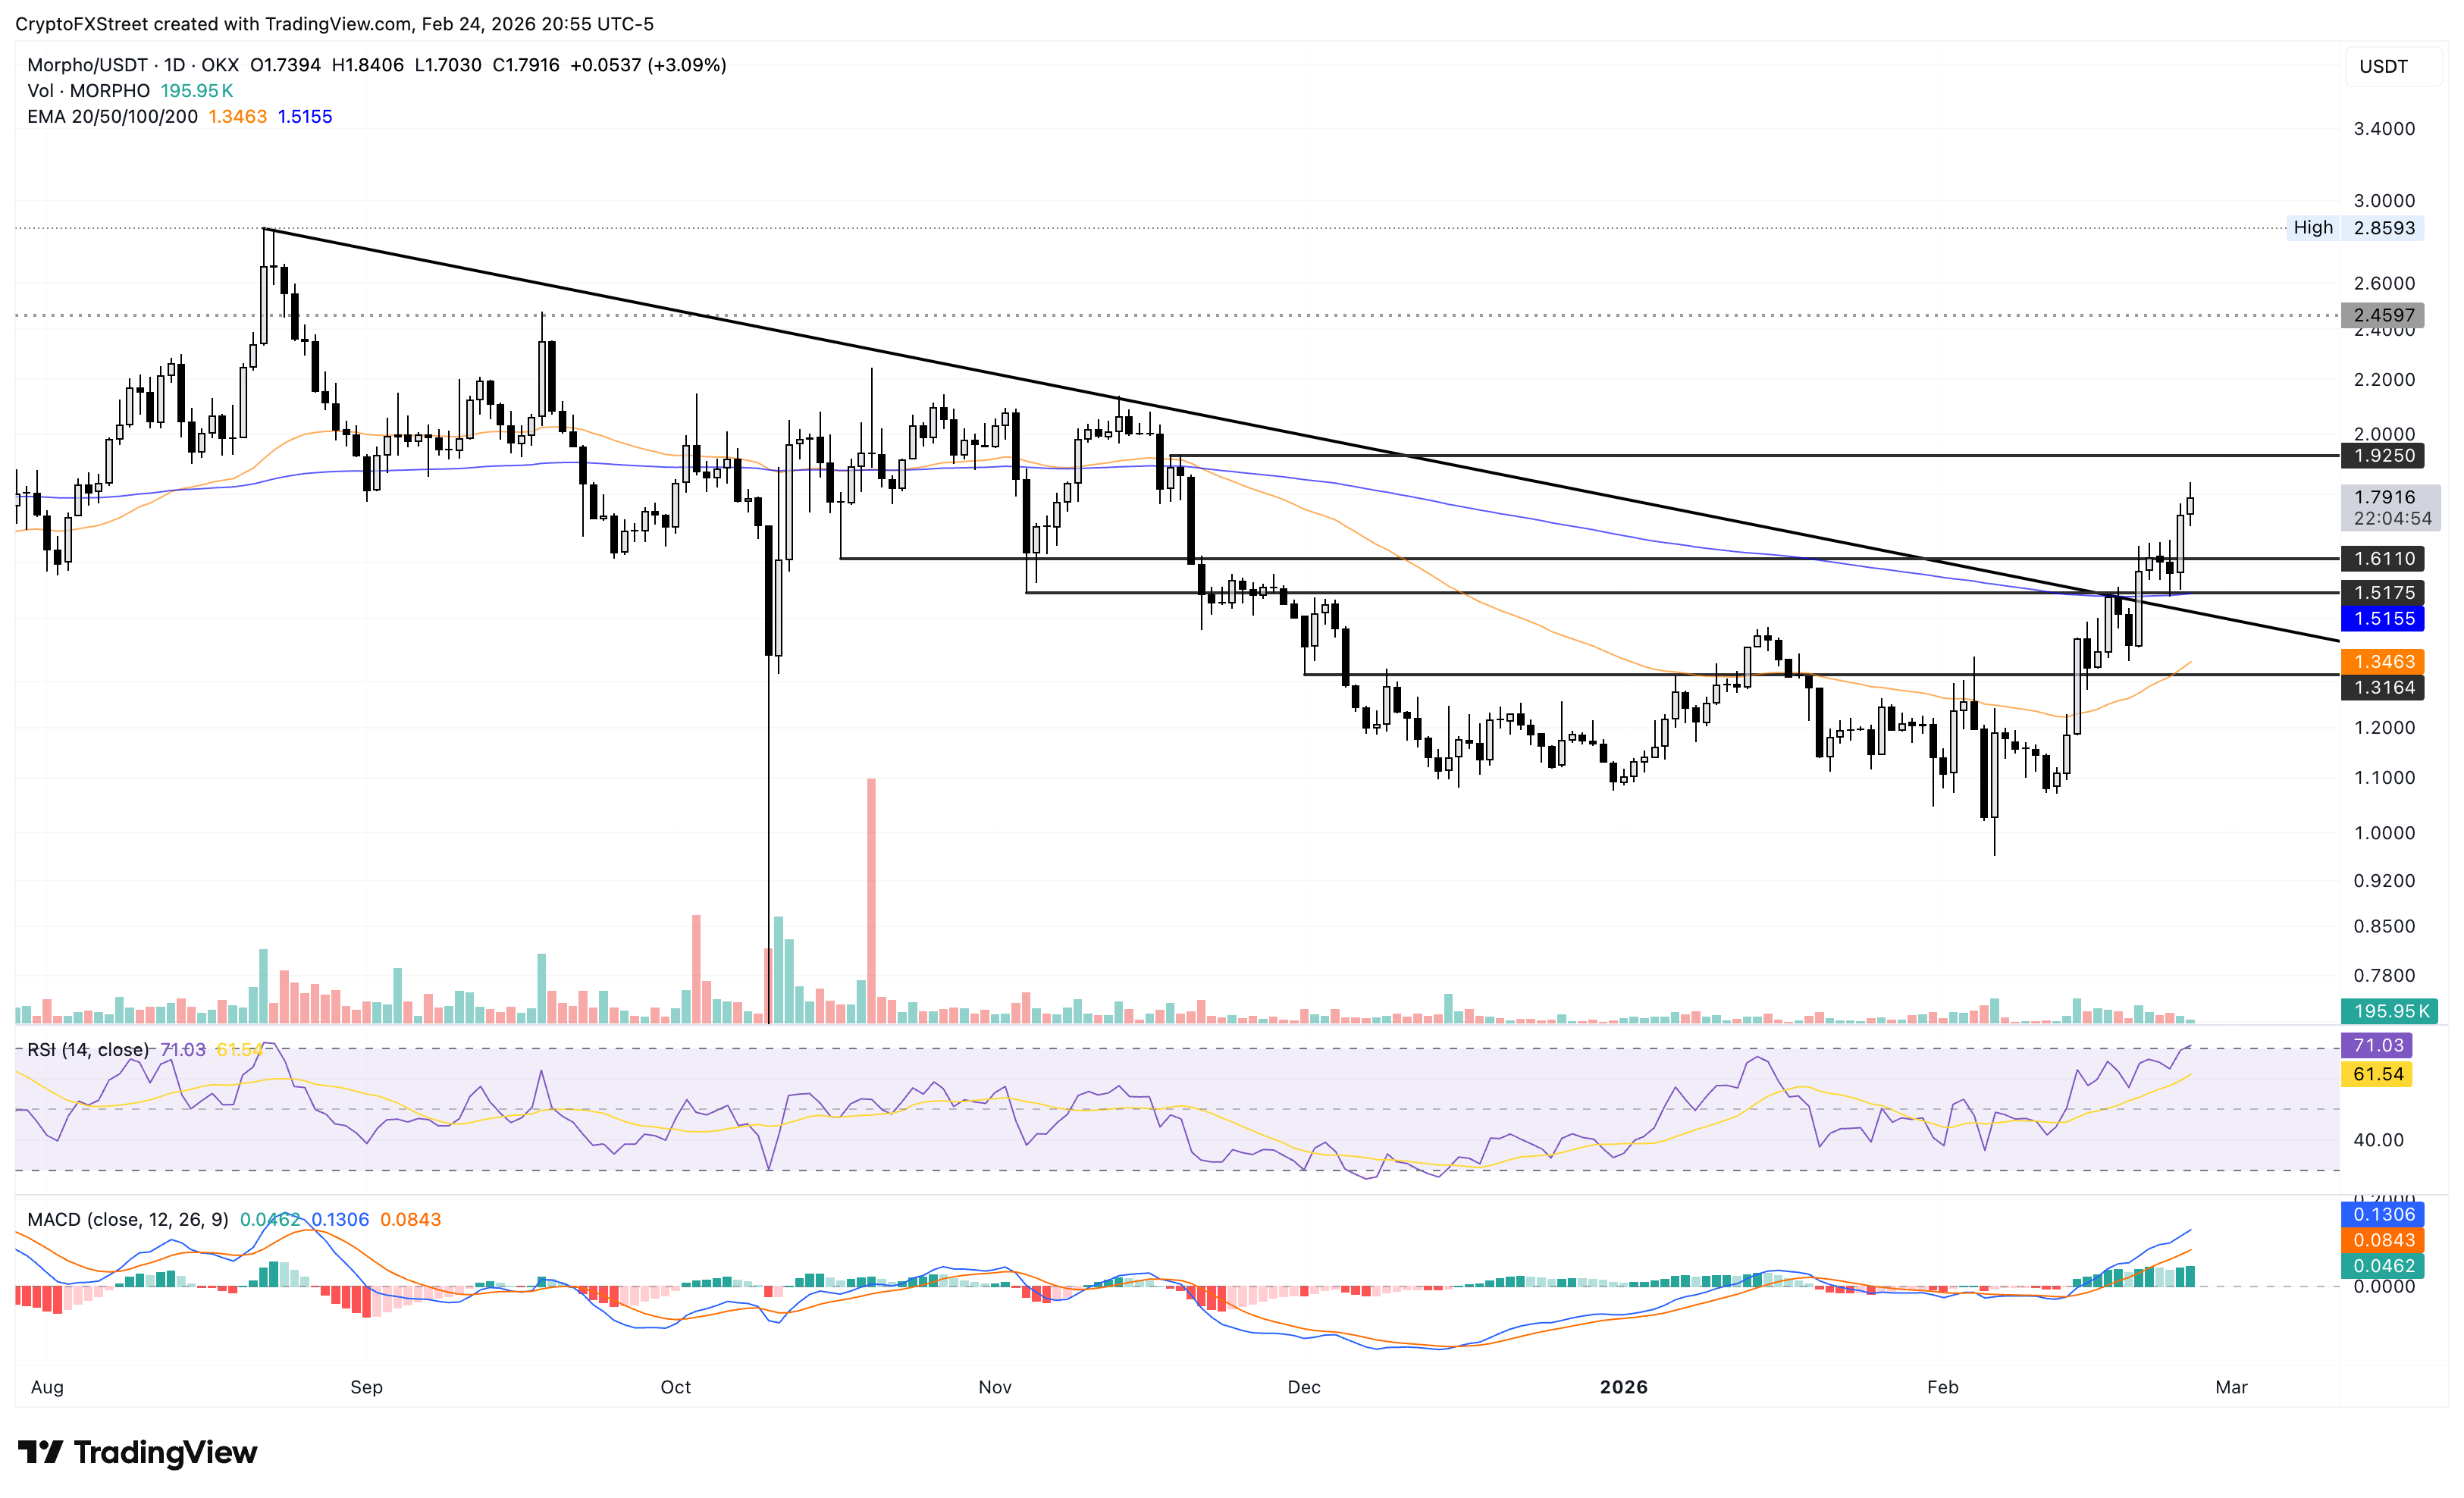
On the downside, the October 17 low at $1.6110 and the 200-day EMA at $1.5152 serve as crucial support levels.
Ether.fi regains strength after a short-term consolidation
ETHFI is up 3% above the $0.500 psychological level at the time of writing on Wednesday, extending gains for the third consecutive day. The recovery approaches the overhead resistance of a short-term consolidation ranging from $0.420 to $0.527.
A decisive close above $0.527 would confirm the range breakout and target the 50-day EMA at $0.556. If Ether.fi exceeds the moving average, it could target the support-turned-resistance level at $0.665, which coincides with a descending trendline connecting the November 14 and January 14 highs.
The RSI is at 52 on the daily chart, crossing above the midline and signaling rising buying pressure. Meanwhile, the MACD diverges to the upside from its signal line, with bullish histograms widening, suggesting a boost in trend momentum.
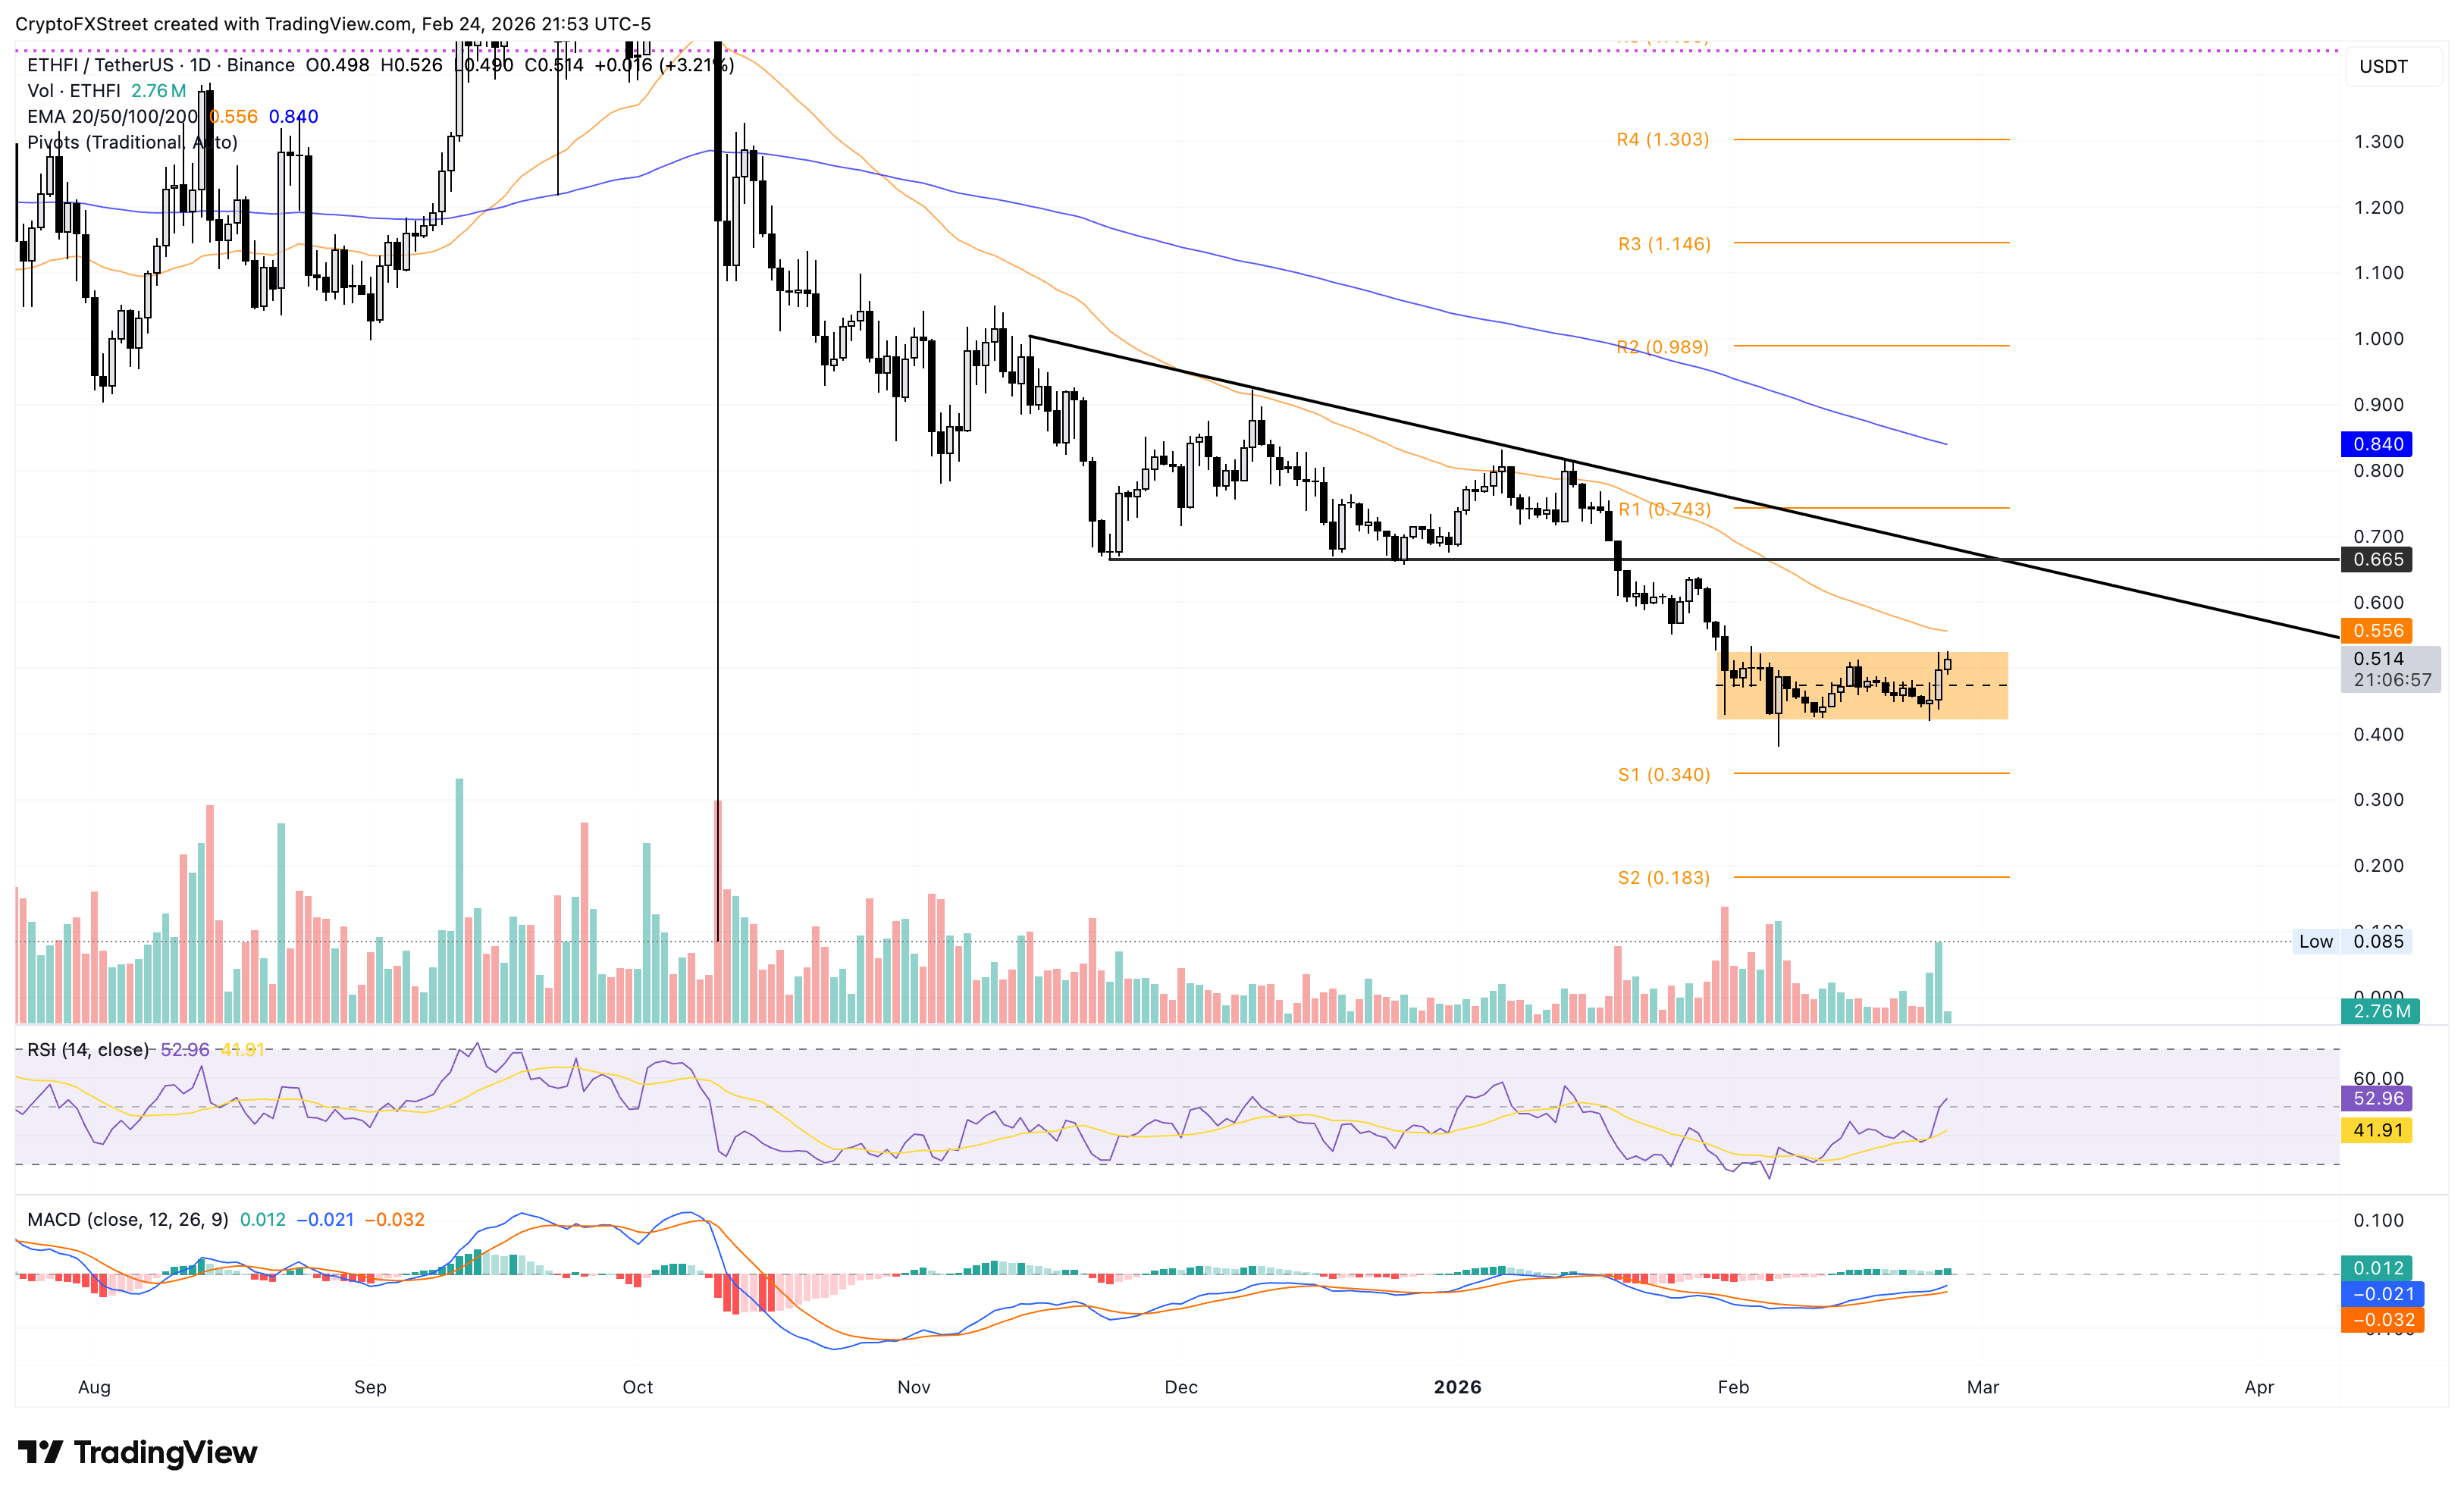
On the flip side, a negative close for the day would indicate sustained downside pressure, opening the door to the $0.420 support level.
Pippin recovery run pauses near a crucial resistance level
PIPPIN shows a U-shaped reversal on the daily chart from the R1 pivot point at $0.4331, resulting in a four-day rally from Saturday, totaling roughly 70% gains. At the time of writing, PIPPIN trades above the R3 pivot point at $0.8012.
The steady recovery targets the R4 pivot point at $0.9250, followed by the $1.00 psychological level.
The upward-trending 50- and 200-day EMAs signal a bullish bias. The RSI at 71 remains in the overbought region, indicating heightened buying pressure. At the same time, the MACD remains above the signal line as the positive histogram expands, indicating increased bullish momentum.
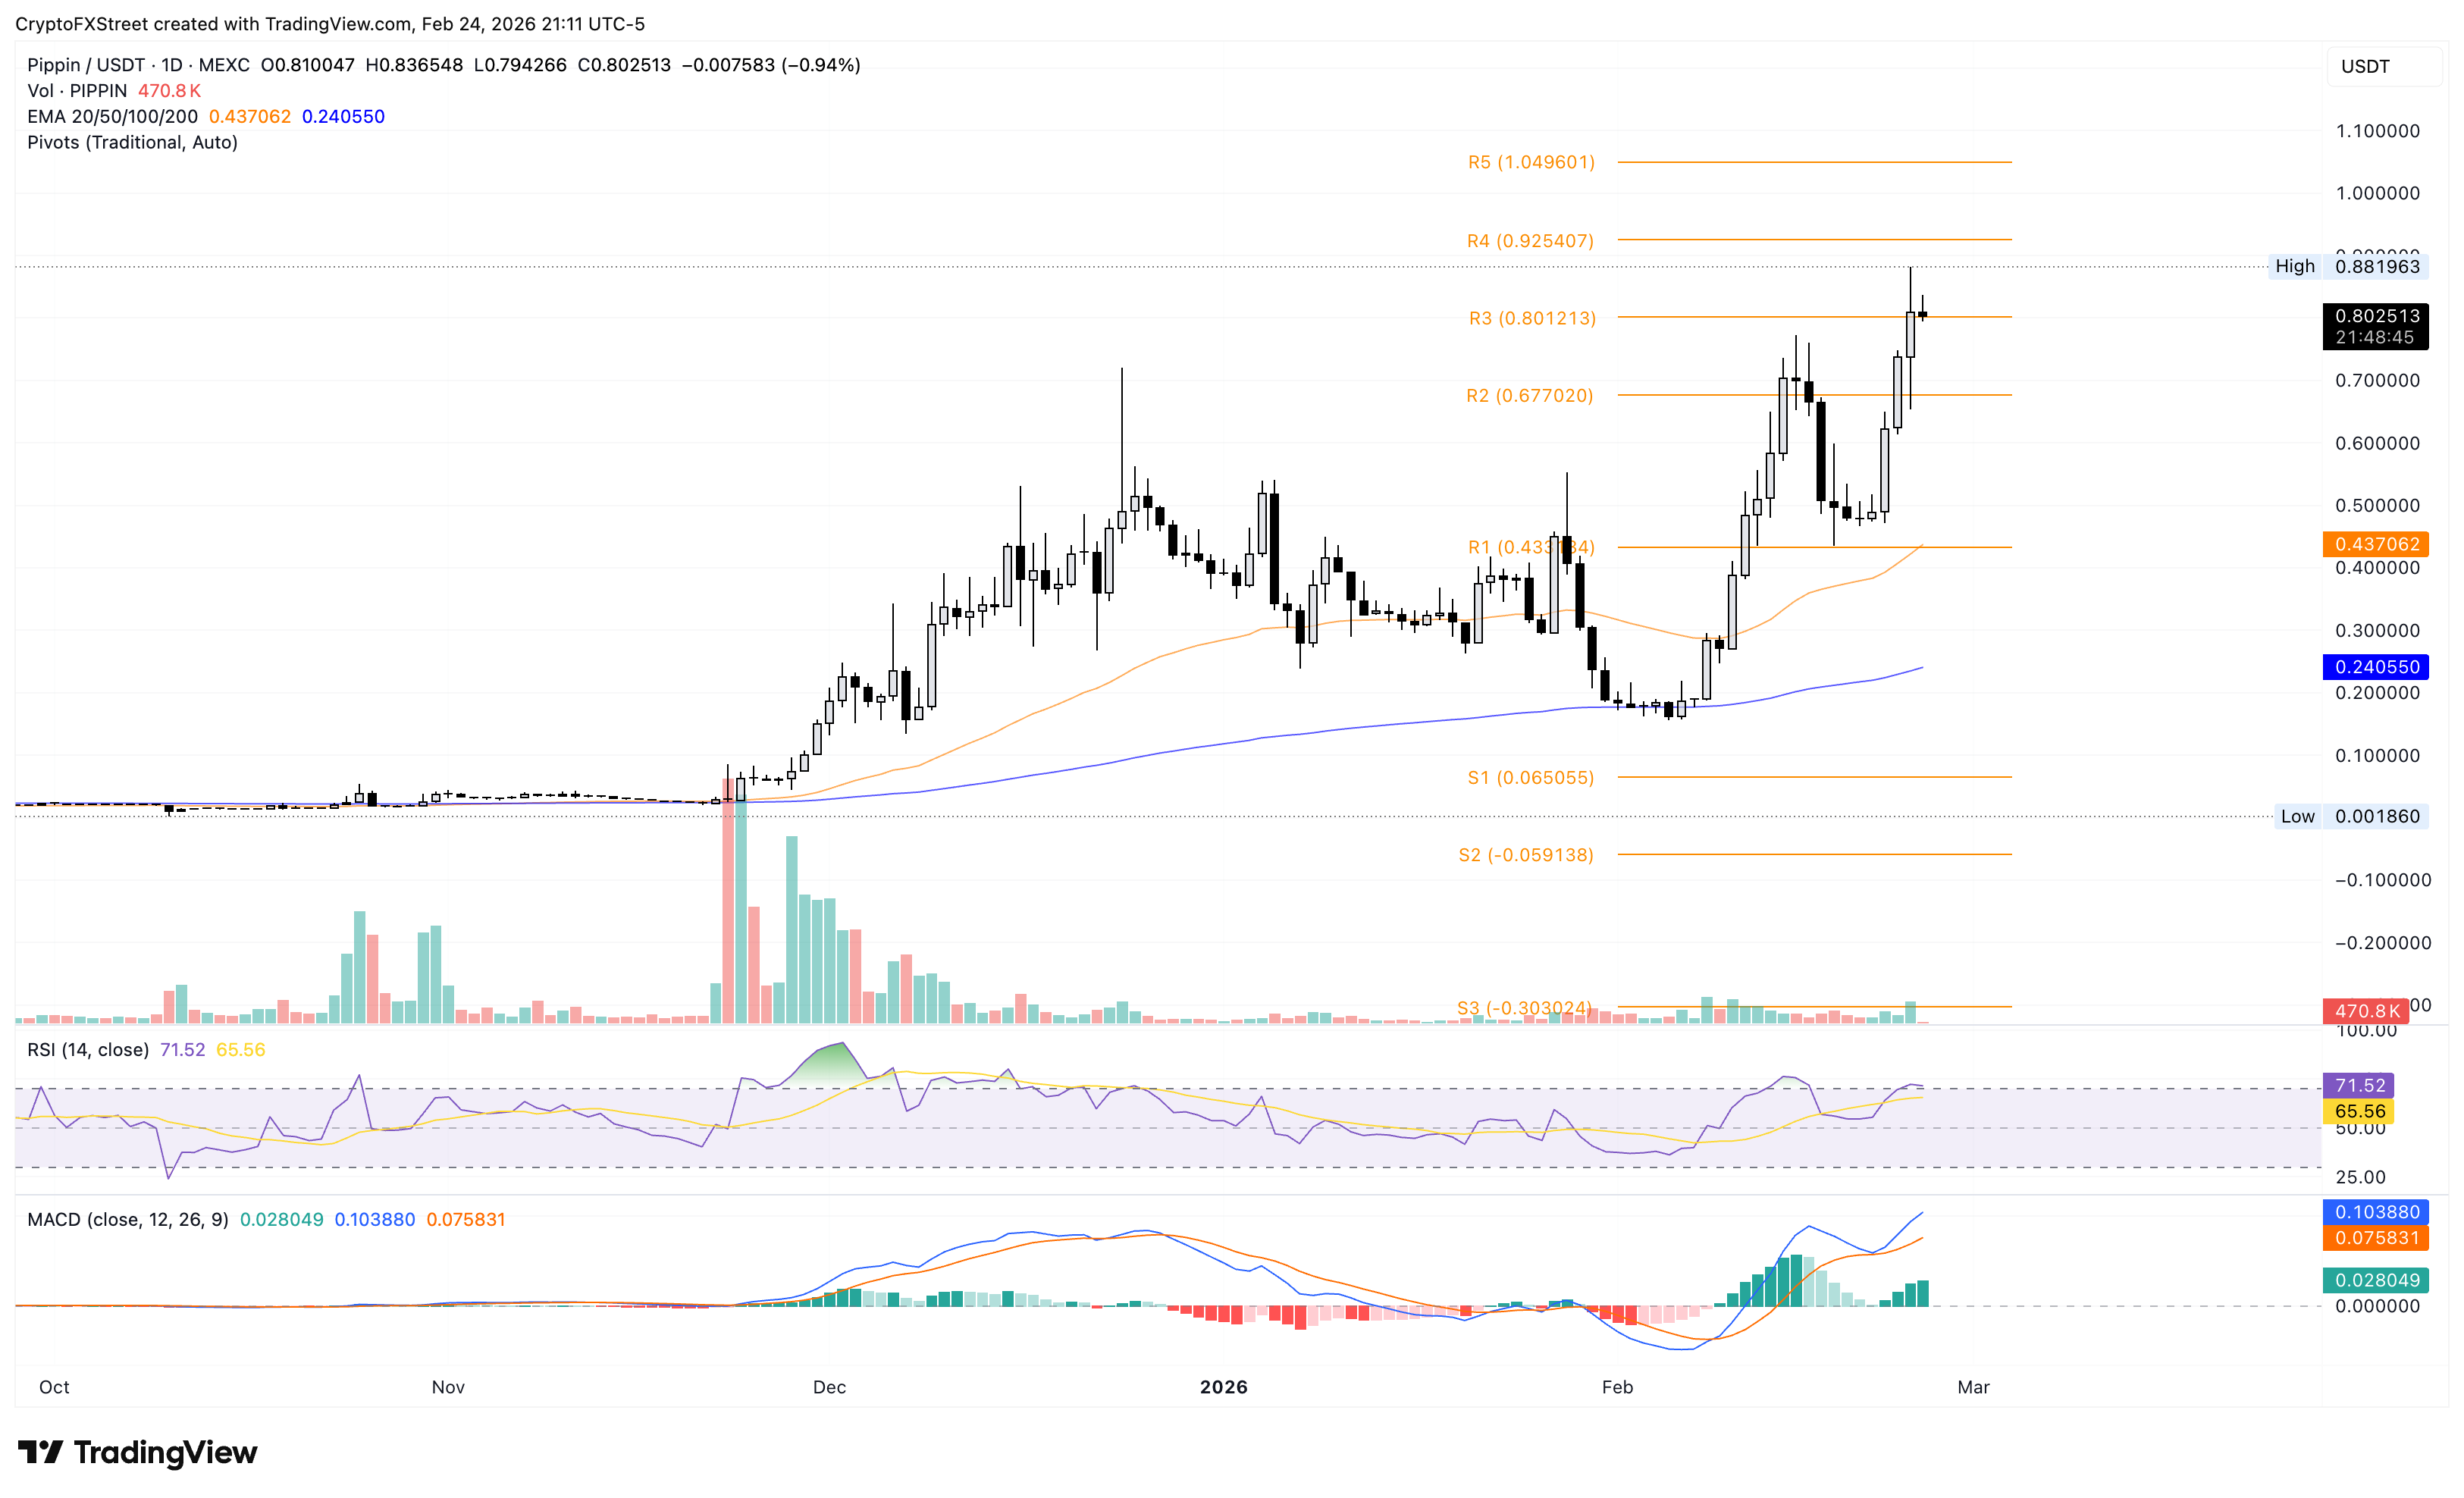
However, a decisive daily close below $0.8012 could flash a downside risk to the R2 pivot point at $0.6770.

Hơn một triệu người dùng dựa vào FXStreet để có dữ liệu thị trường thời gian thực, công cụ biểu đồ, góc nhìn chuyên gia và tin tức Forex. Lịch kinh tế toàn diện và các hội thảo web giáo dục giúp nhà giao dịch luôn cập nhật và đưa ra quyết định có tính toán. FXStreet có khoảng 60 nhân sự, chia giữa trụ sở Barcelona và nhiều khu vực toàn cầu.
Đọc thêm


