
Top Crypto Losers: Optimism, Helium and Arbitrum tumble amid volatile week
Bởi Vishal Dixit
Đã cập nhật: 20 Feb 2026


BÀI VIẾT PHỔ BIẾN

Optimism (OP), Helium (HNT), and Arbitrum (ARB) are leading losses over the last 24 hours, testing crucial support levels. Optimism remains under pressure as Coinbase’s Base chain pulls support from the Layer-2.
- Optimism is down more than 25% so far this week, approaching the $0.100 mark.
- Helium is up 4% on Friday, recovering after a 17% drop the previous day.
- Arbitrum drops below a crucial support level after a 9% loss on Thursday.
Optimism (OP), Helium (HNT), and Arbitrum (ARB) are leading losses over the last 24 hours, testing crucial support levels. Optimism remains under pressure as Coinbase’s Base chain pulls support from the Layer-2. Helium shows a sudden bearish turnaround while Arbitrum breaks below the $0.10 psychological mark amid intense selling pressure. Technically, OP shows no sign of reversal, while HNT and ARB imply underlying signals of a potential bounce back.
Optimism in a free fall after Coinbase’s exit
Optimism is down 6% at the time of writing on Friday, extending the 15% decline from the previous day. The Layer-2 token is down 30% so far this week, primarily driven by Coinbase's Base chain exiting to form its own native network.
The declining trend is approaching the S2 pivot point at $0.1071, which would serve as the immediate support level.
The Relative Strength Index (RSI) at 21 is deep in the oversold zone, signaling intensified selling pressure. Additionally, the Moving Average Convergence Divergence (MACD) drops below its signal line, indicating a fresh wave of bearish momentum.
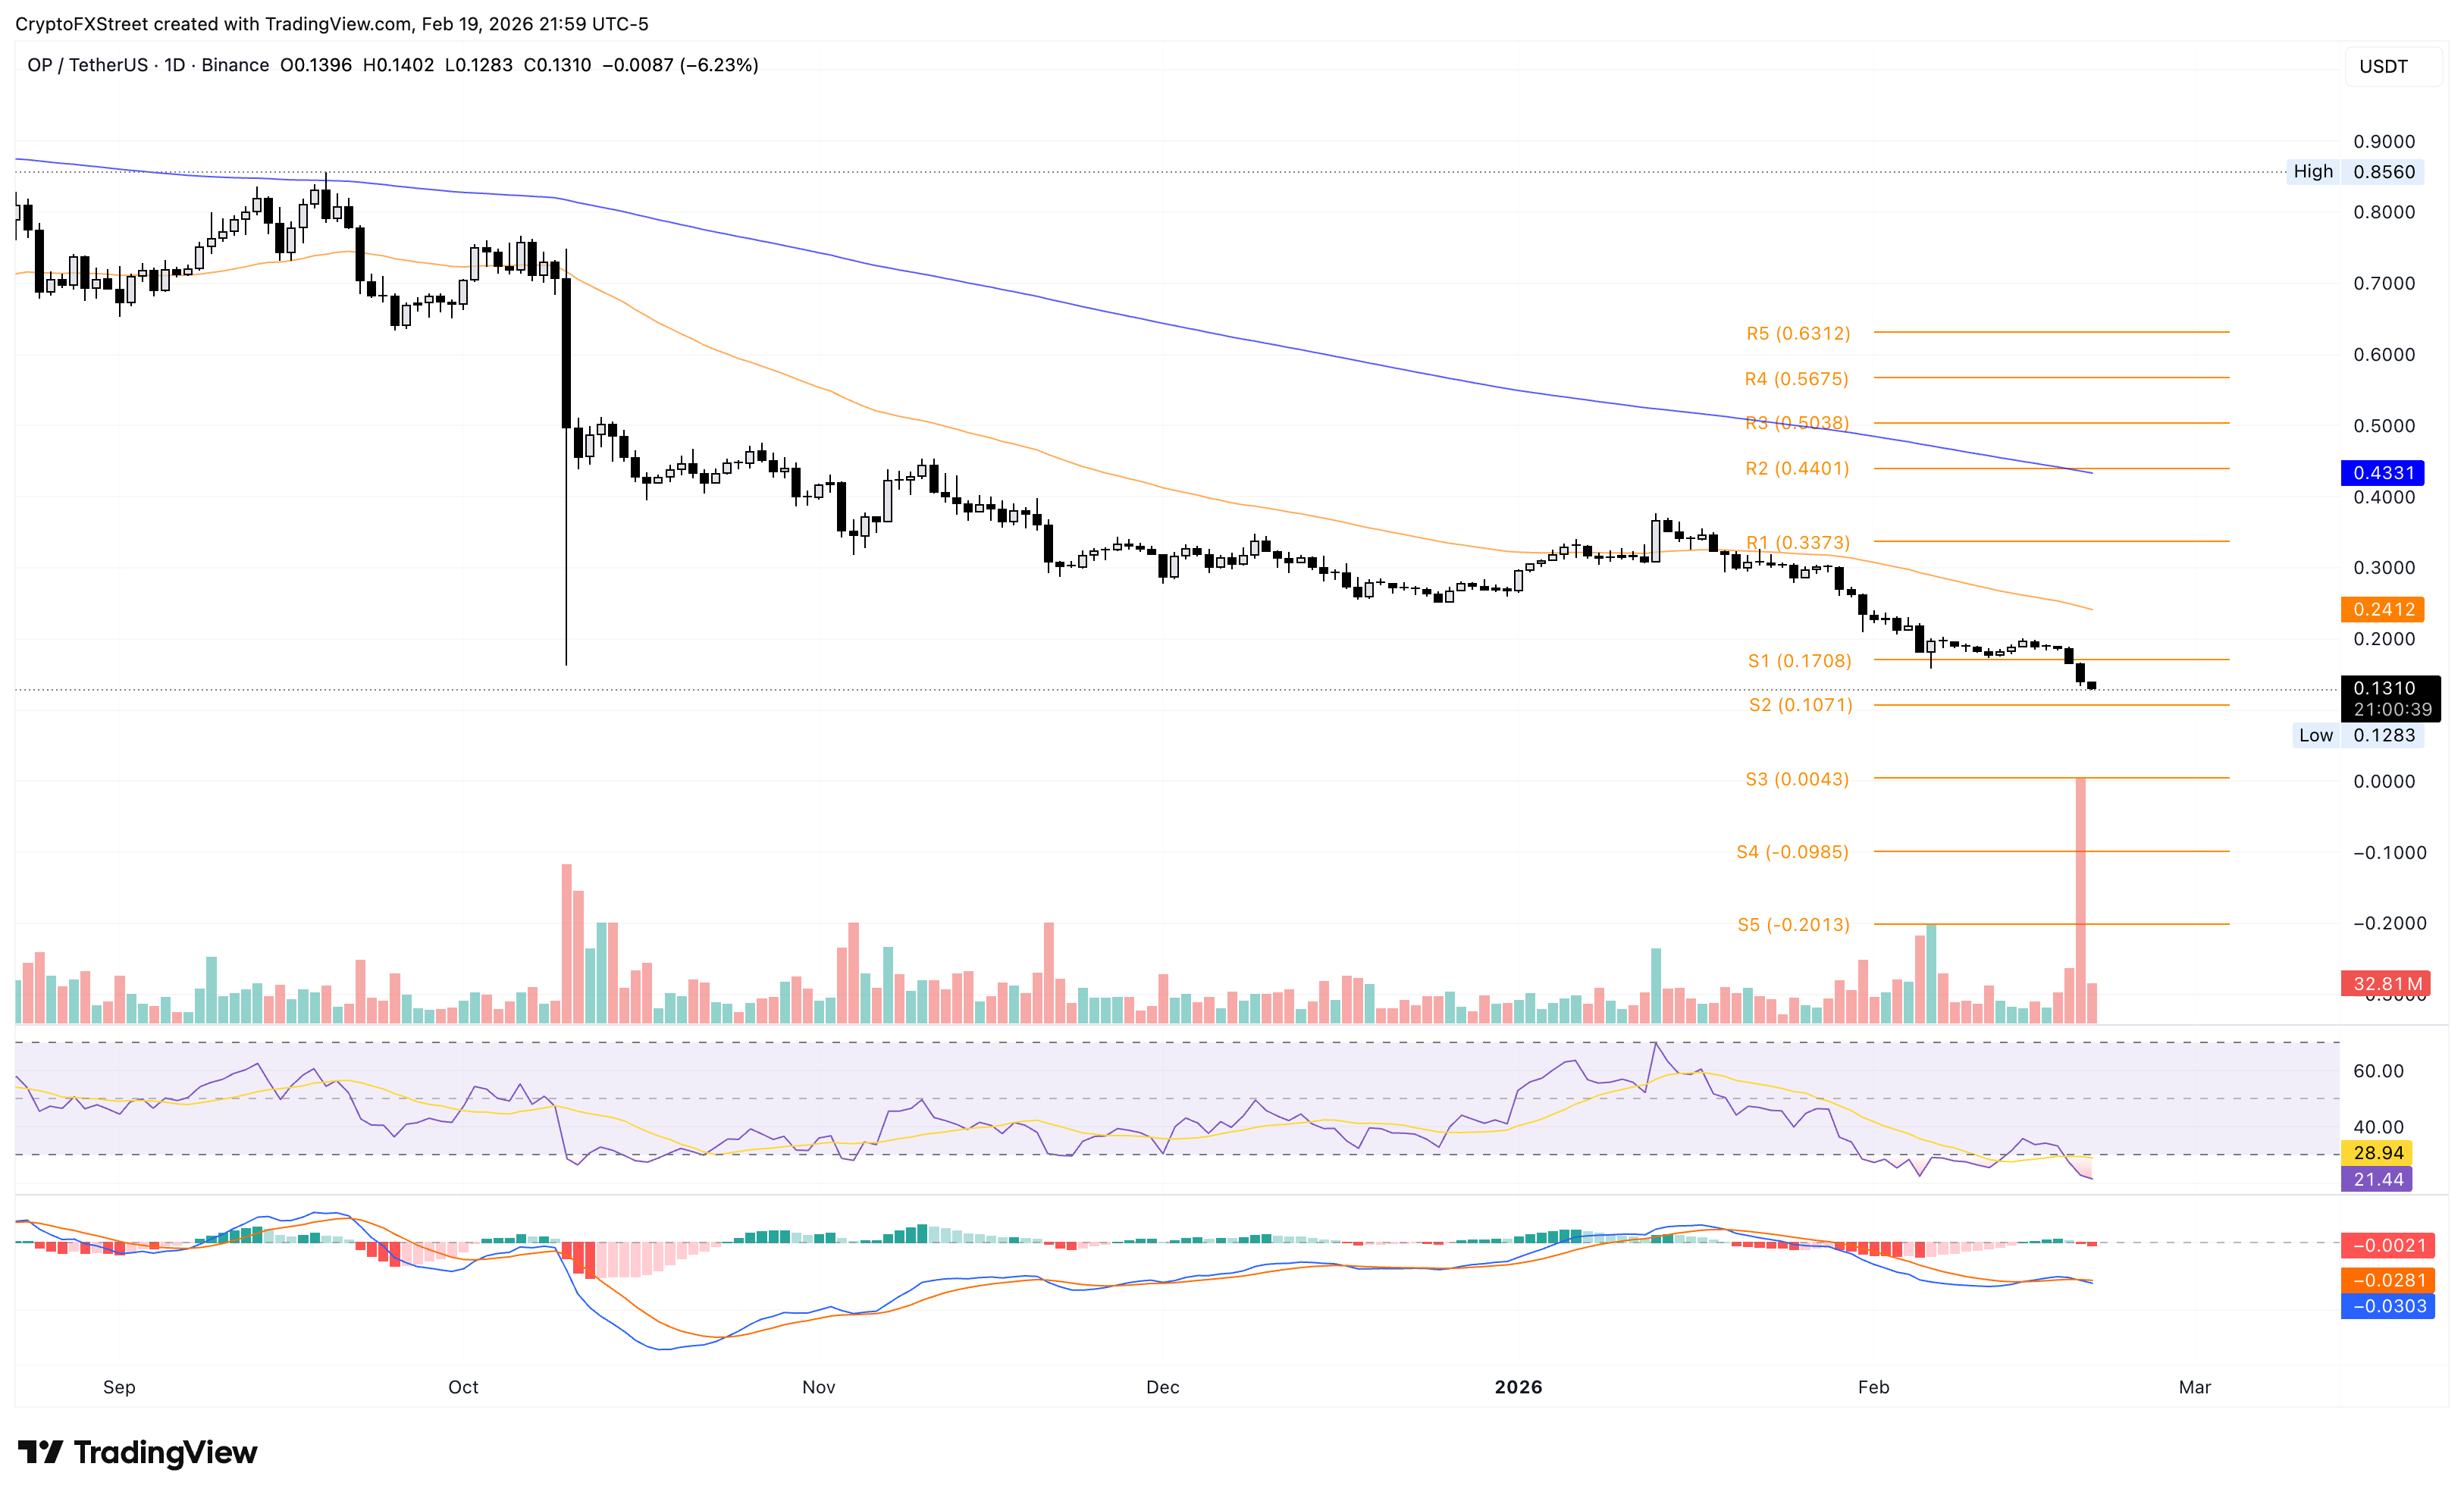
A potential recovery in the OP token could retest the S1 pivot point at $0.1708.
Helium breakout rally faces headwinds
Helium shows a bullish breakout of a falling wedge pattern on the daily chart, with over 60% gains last week. At the time of writing, Helium is up over 4% on Friday, bouncing off the $1.368 support level, aligning with the December 31 daily close, after Thursday’s 17% pullback.
The upward slope in the 50-day Exponential Moving Average (EMA) suggests short-term relief from the bearish bias, while the declining 200-day EMA could cap further recovery.
The RSI at 60 on the daily chart slips below the overbought zone while the MACD positive histogram contracts above the zero line, confirming the short-term decline in bullish momentum.
The bullish trend struggles to surpass the January 2 daily close of $1.638, which serves as short-term resistance. If HNT exceeds this level, it could test the 200-day EMA at $1.26.
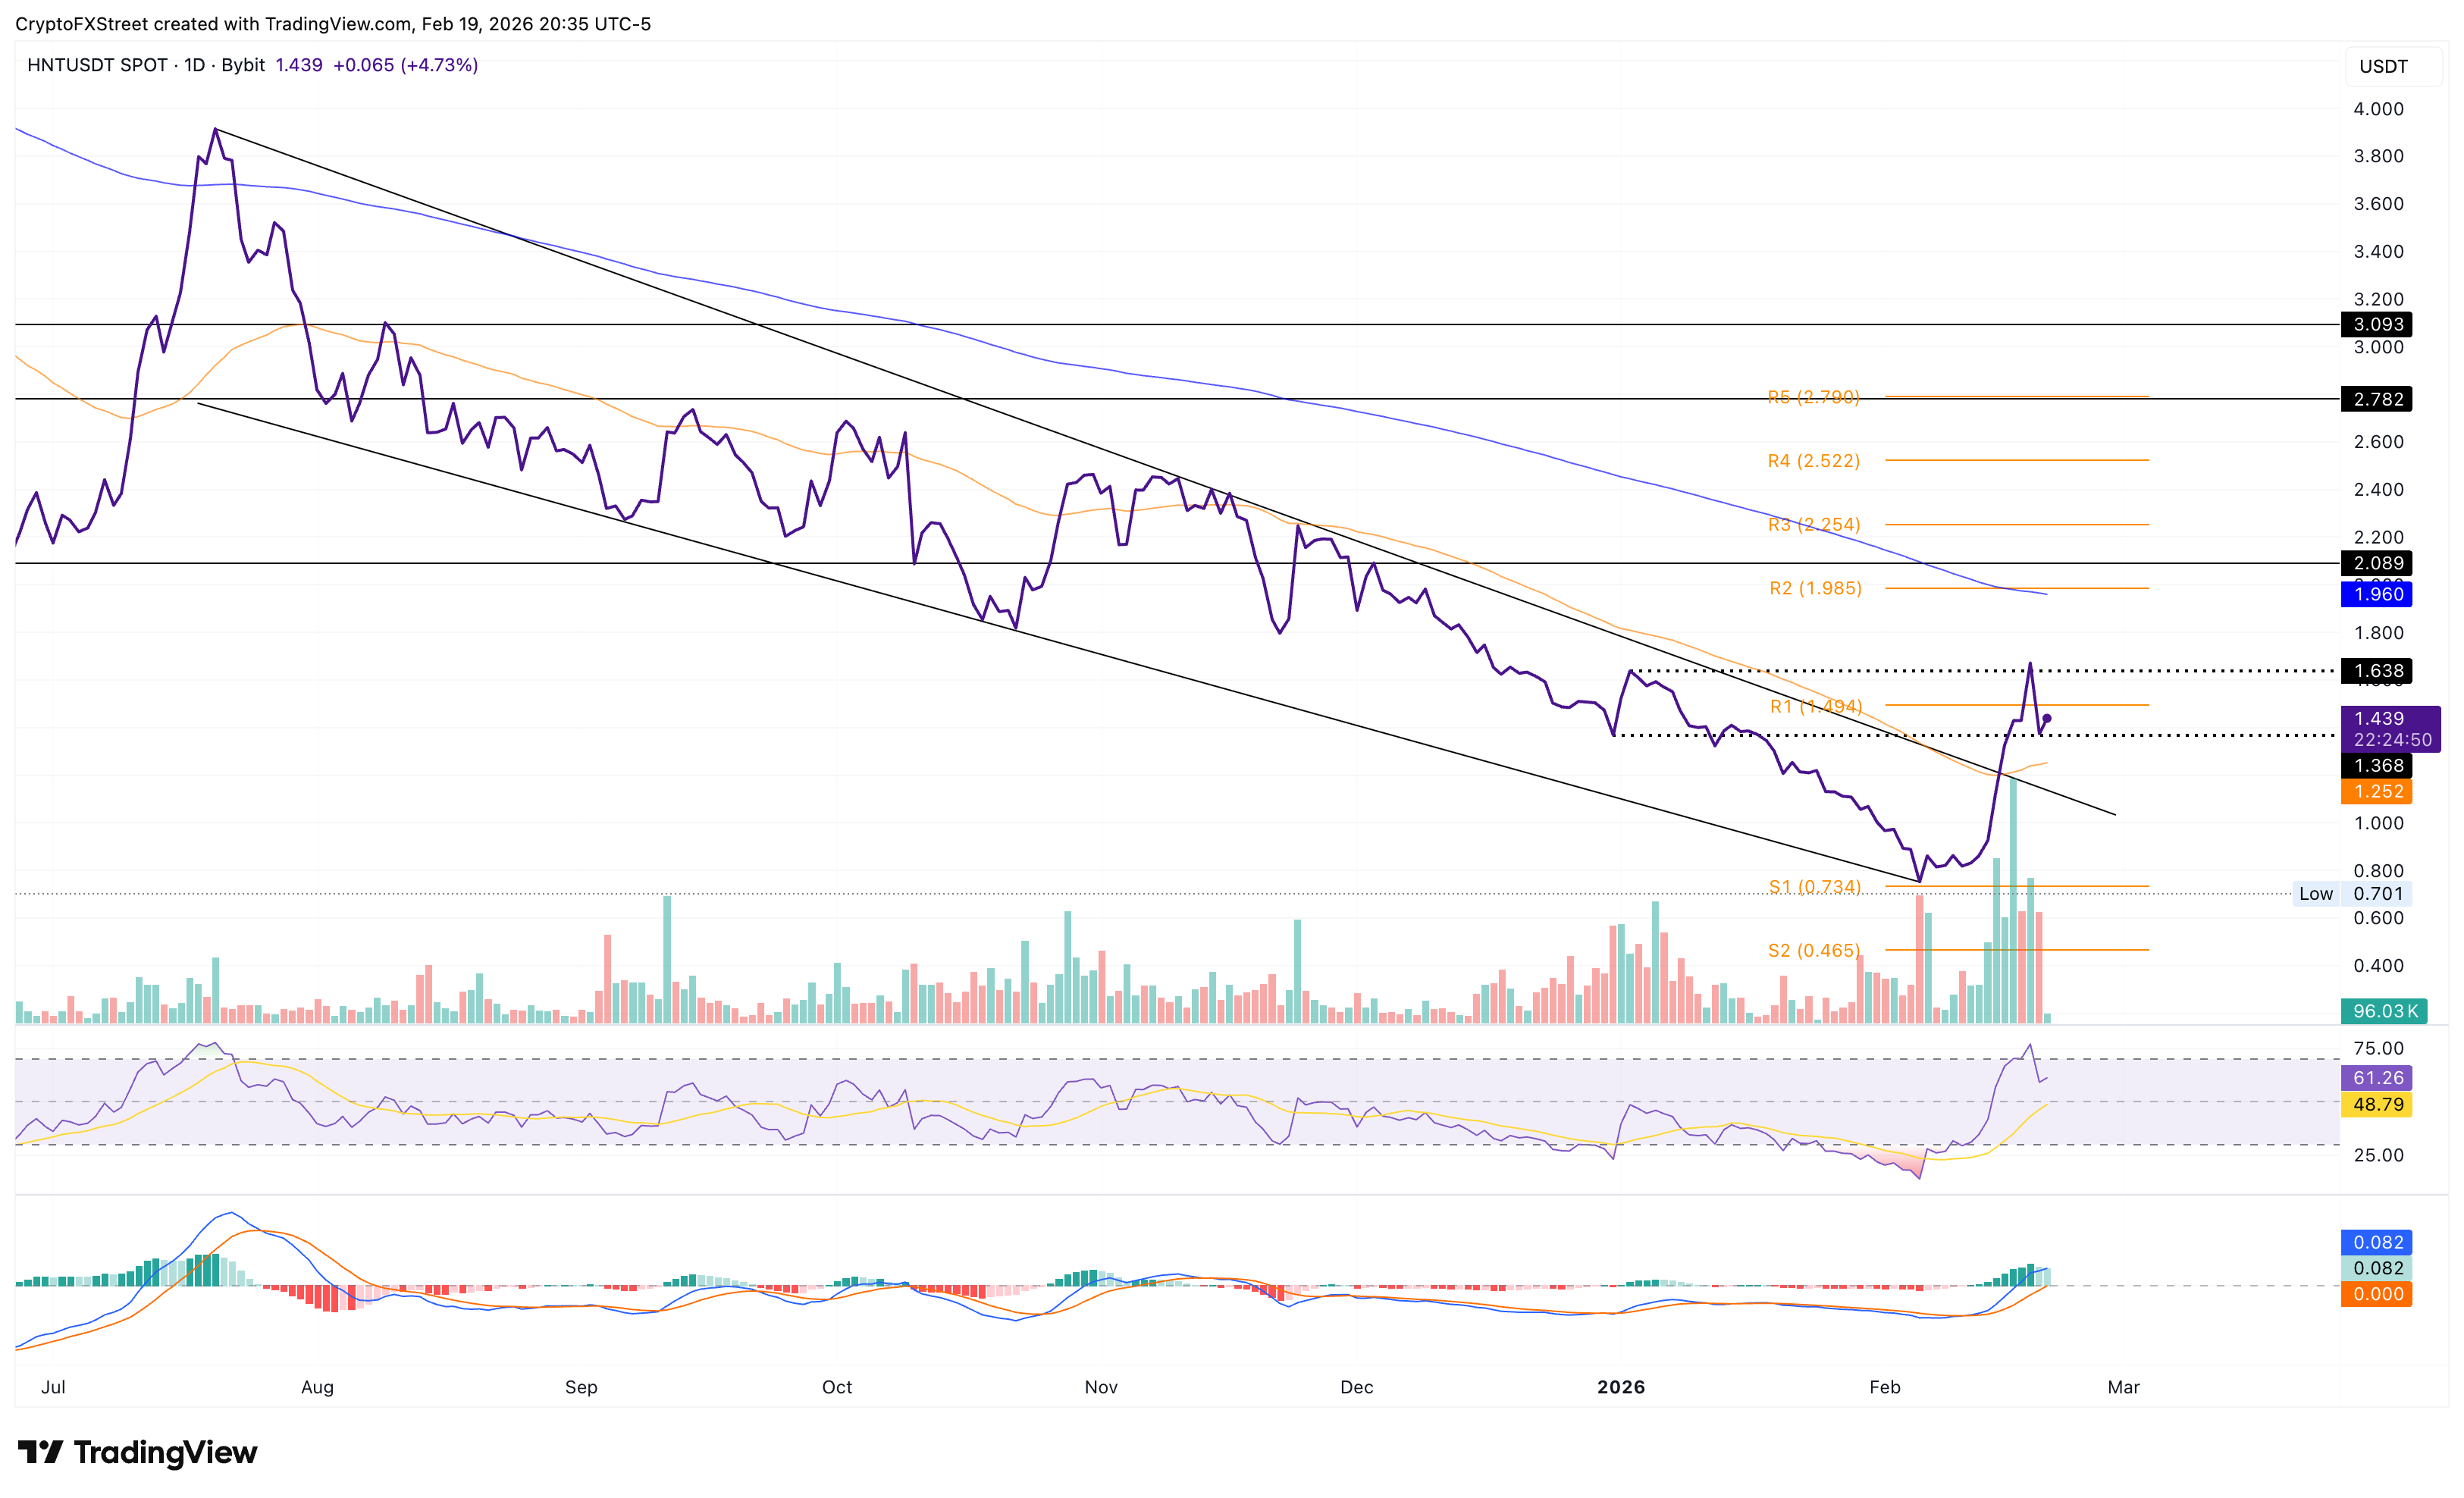
On the flip side, the 50-day EMA at $1.252 serves as the crucial support below the $1.368 support level.
Arbitrum flashes rebound hopes on bullish RSI divergence
Arbitrum is trading below the $0.1000 psychological level at the time of writing at press time on Friday, following a 9% decline the previous day. The ARB token has been in a steady decline since Sunday, recording an over 15% loss so far this week.
The altcoin broke below the S1 pivot point at $0.1013 on Thursday, risking further decline to the S2 pivot point at $0.0624.
However, the lower low on the daily chart signals a bullish RSI divergence, which stands at 25 and rises from oversold territory. Still, the MACD converges with the signal line, risking a bearish crossover.
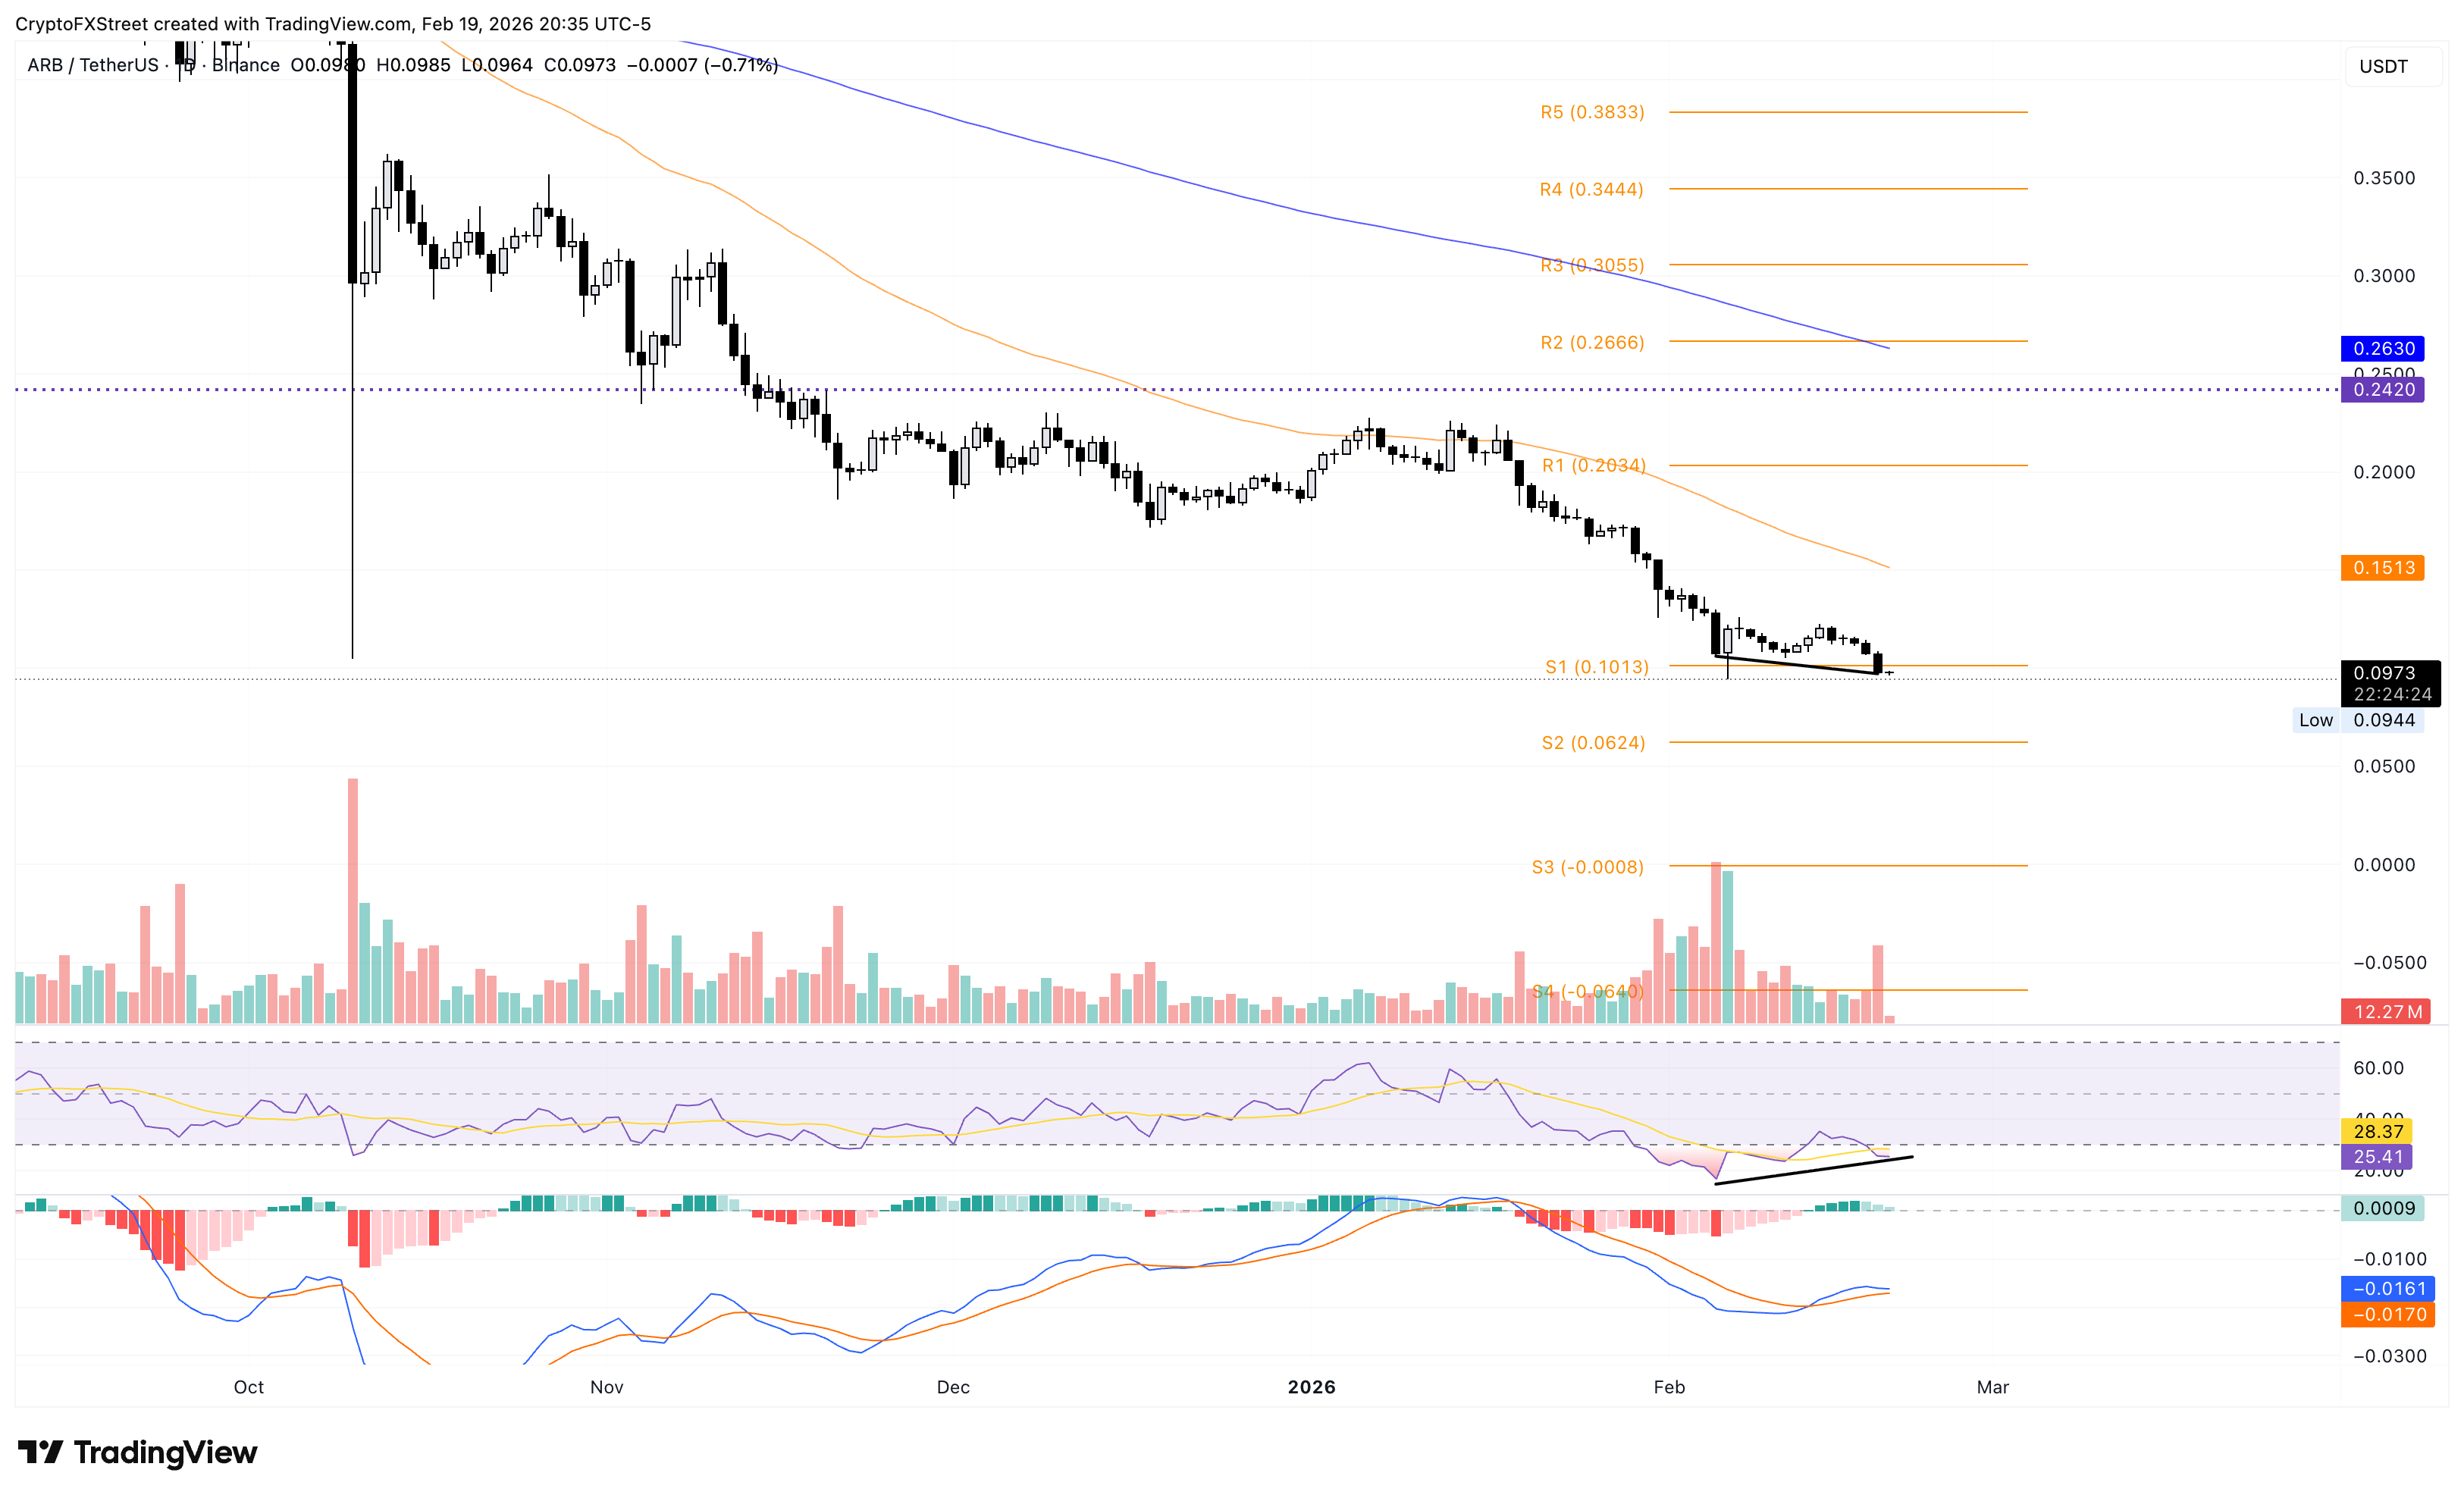
A potential rebound above the $0.1013 level could test the 50-day EMA at $0.1513.

Hơn một triệu người dùng dựa vào FXStreet để có dữ liệu thị trường thời gian thực, công cụ biểu đồ, góc nhìn chuyên gia và tin tức Forex. Lịch kinh tế toàn diện và các hội thảo web giáo dục giúp nhà giao dịch luôn cập nhật và đưa ra quyết định có tính toán. FXStreet có khoảng 60 nhân sự, chia giữa trụ sở Barcelona và nhiều khu vực toàn cầu.
Đọc thêm


