
Top Crypto Losers: Pump.fun, Pudgy Penguins, and Hyperliquid extend bearish streak
Bởi Vishal Dixit
Ngày xuất bản: 19 Dec 2025 | Ngày chỉnh sửa: 19 Dec 2025


BÀI VIẾT PHỔ BIẾN

Pump.fun (PUMP), Pudgy Penguins (PENGU), and Hyperliquid (HYPE) lose ground in an extended bearish streak, recording double-digit losses this week. The surprise drop in the November US Consumer Price Index (CPI) to 2.7%, beating expectations of 3.1%, fueled a rally in the stock market.
- Pump.fun is down 2% on Friday after breaking below the $0.0020 mark with an 11% decline on Thursday.
- Pudgy Penguins edges lower by over 1% on Friday, extending the bearish streak for the sixth straight day.
- Hyperliquid holds above $22 after a five-day decline of nearly 25% while bears target the $20 mark.
Pump.fun (PUMP), Pudgy Penguins (PENGU), and Hyperliquid (HYPE) lose ground in an extended bearish streak, recording double-digit losses this week. The surprise drop in the November US Consumer Price Index (CPI) to 2.7%, beating expectations of 3.1%, fueled a rally in the stock market. Still, the cryptocurrency market remains under pressure from the Bank of Japan’s rate hike decision on Friday.
The technical outlook for PUMP, PENGU, and HYPE indicates a bearish bias, with immediate support levels in focus.
Pump.fun extends the bearish streak
Pump.fun edges lower by 2% at press time on Friday, marking its sixth consecutive day of losses. The Solana-based launchpad token inches closer to the $0.001800 round figure, with bears focusing on the October 10 low at $0.001496.
If PUMP fails to hold at $0.001496, it could extend the decline to the $0.001000 psychological level.
The technical indicators on the daily chart suggest the PUMP token is under intense bearish pressure. The Relative Strength Index (RSI) is at 26 under the oversold zone, indicating a steady rise in selling pressure. Additionally, the Moving Average Convergence Divergence (MACD) reverses into negative territory after crossing below the signal line on Monday.
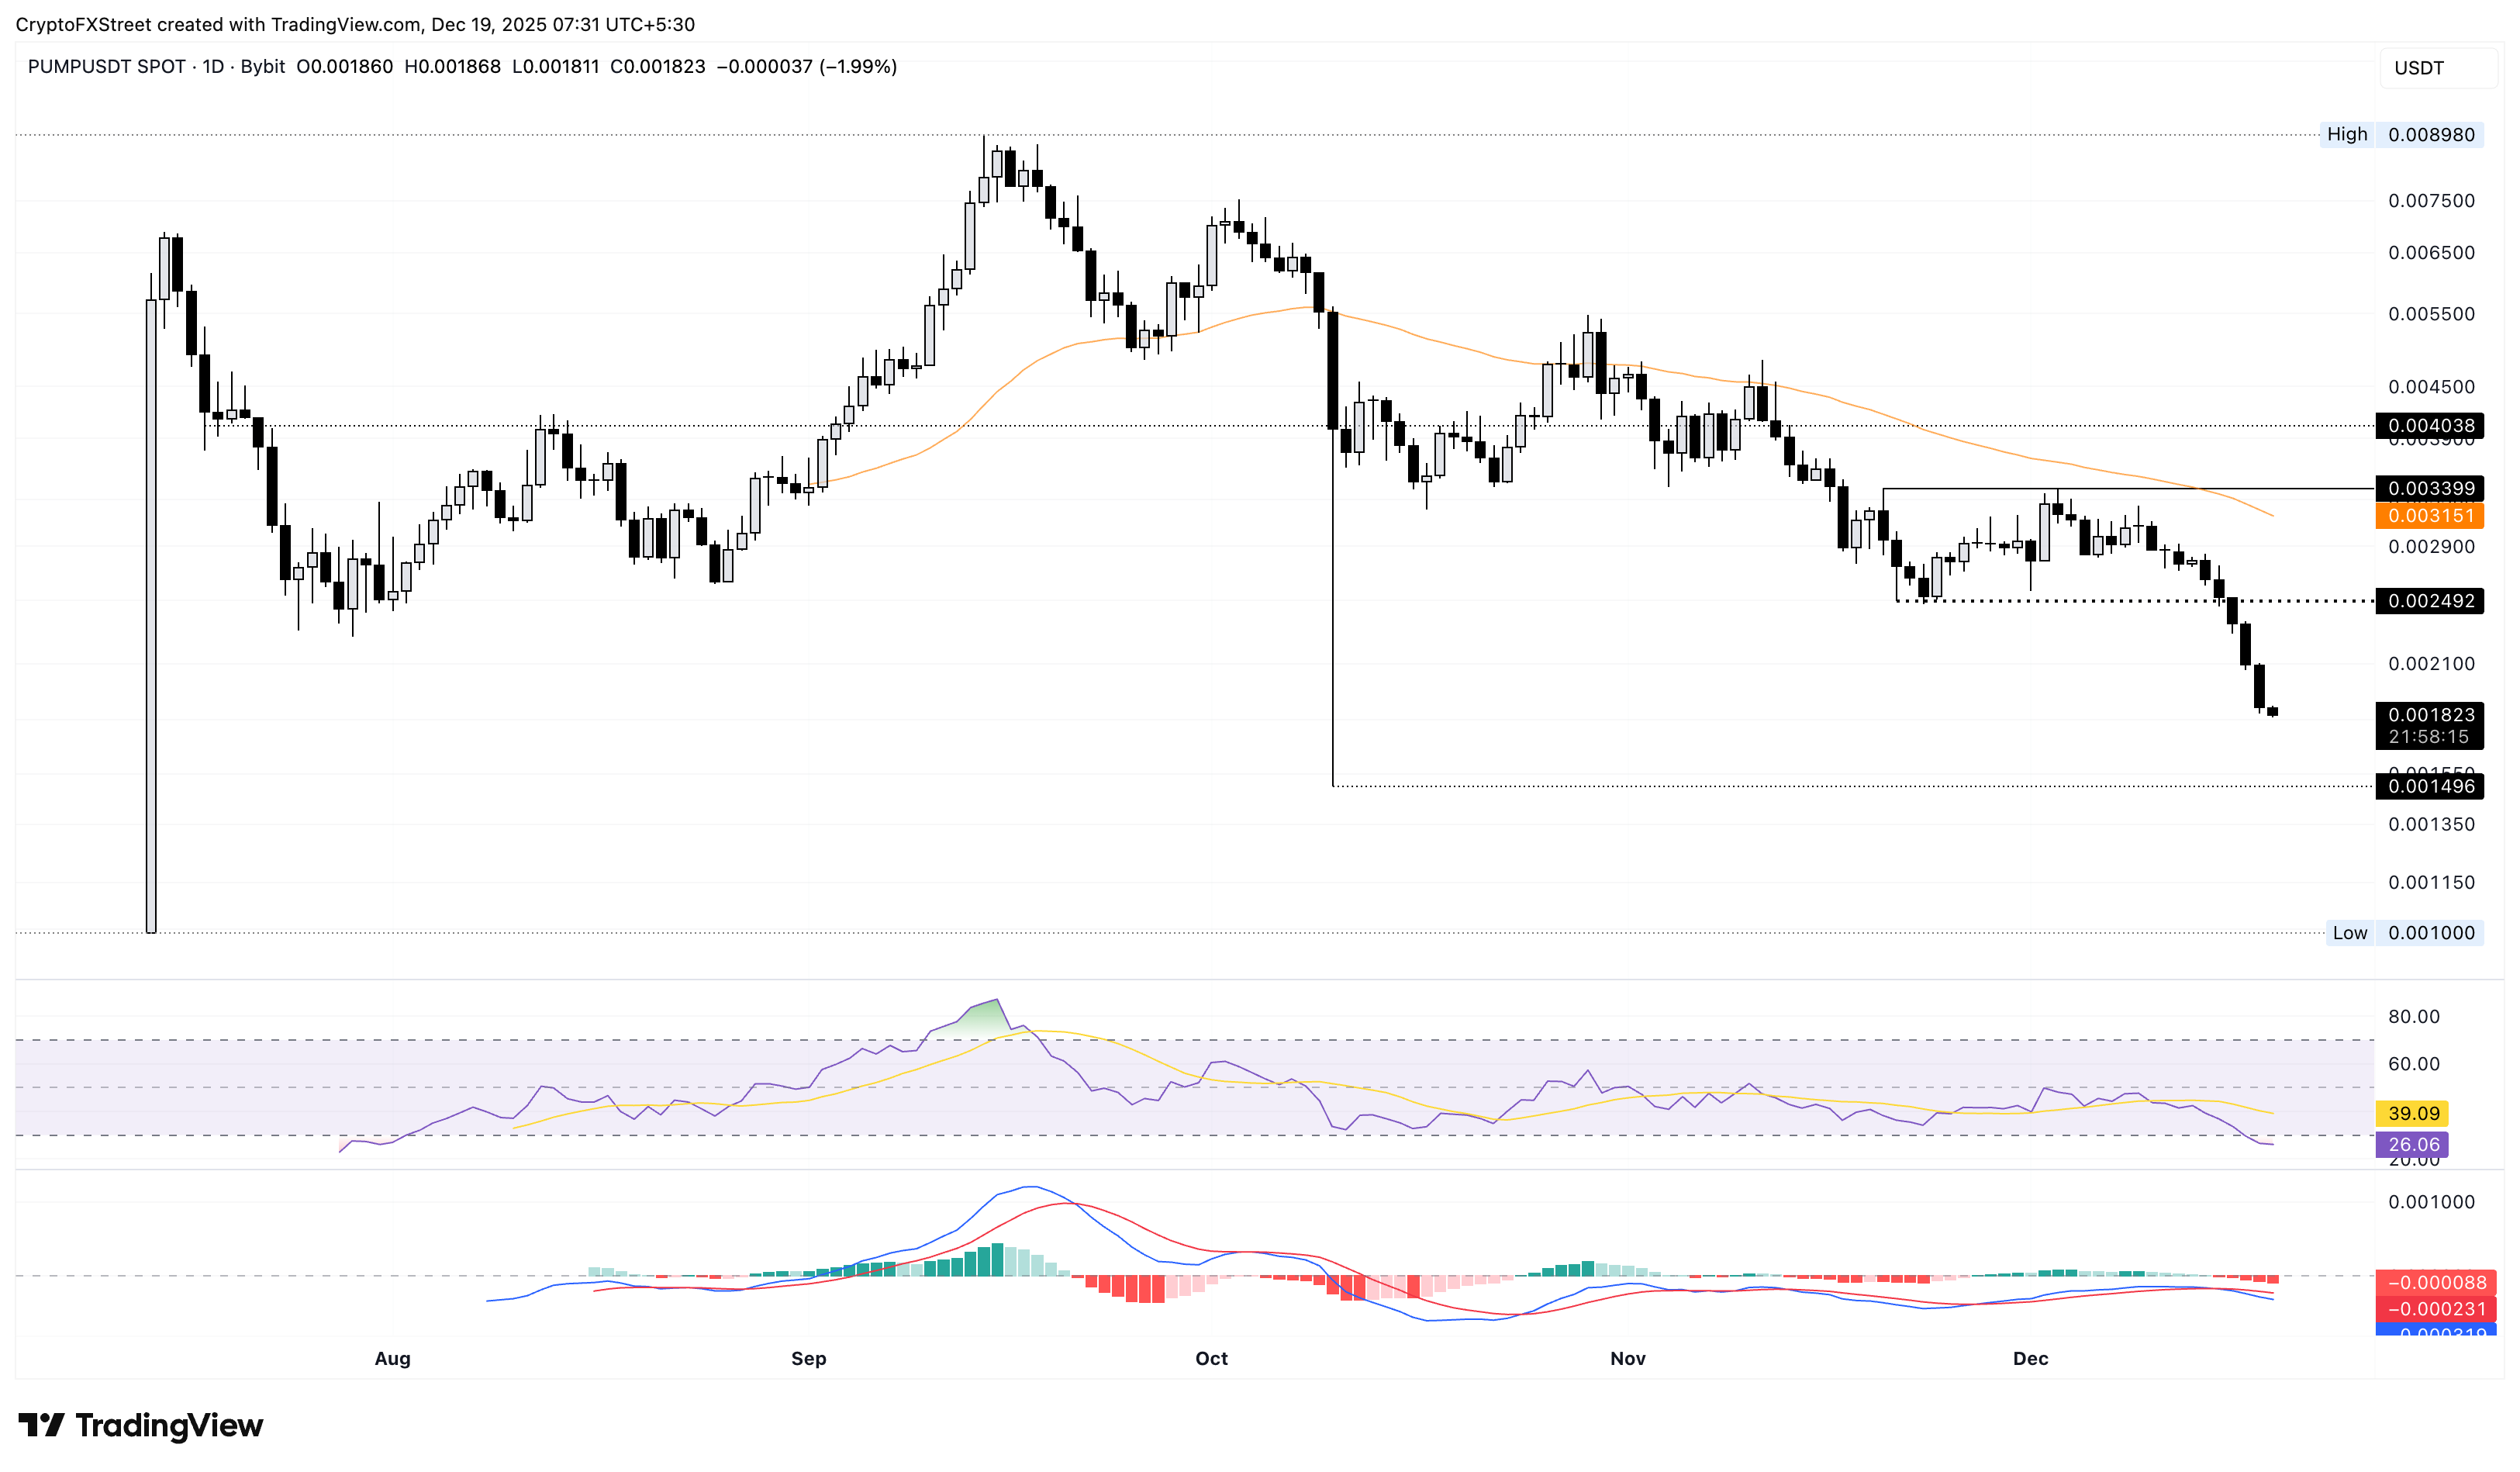
Looking up, the $0.002000 mark and the November 21 low at $0.002492 could serve as resistance.
Pudgy Penguins in a free fall risks further losses
Pudgy Penguins is trading below the $0.001000 psychological level, down 17% so far this week. At the time of writing, PENGU is down nearly 2% on Friday, aiming for the $0.007737 support level, which aligns with the June 22 low.
If the declining PENGU trend exceeds this support level, it could target the October 10 low at $0.005778.
The RSI is at 31 with a declining slope inching toward the oversold zone as selling pressure increases. Meanwhile, the MACD indicator maintains a sell signal triggered on Thursday following a bearish crossover with the red line.
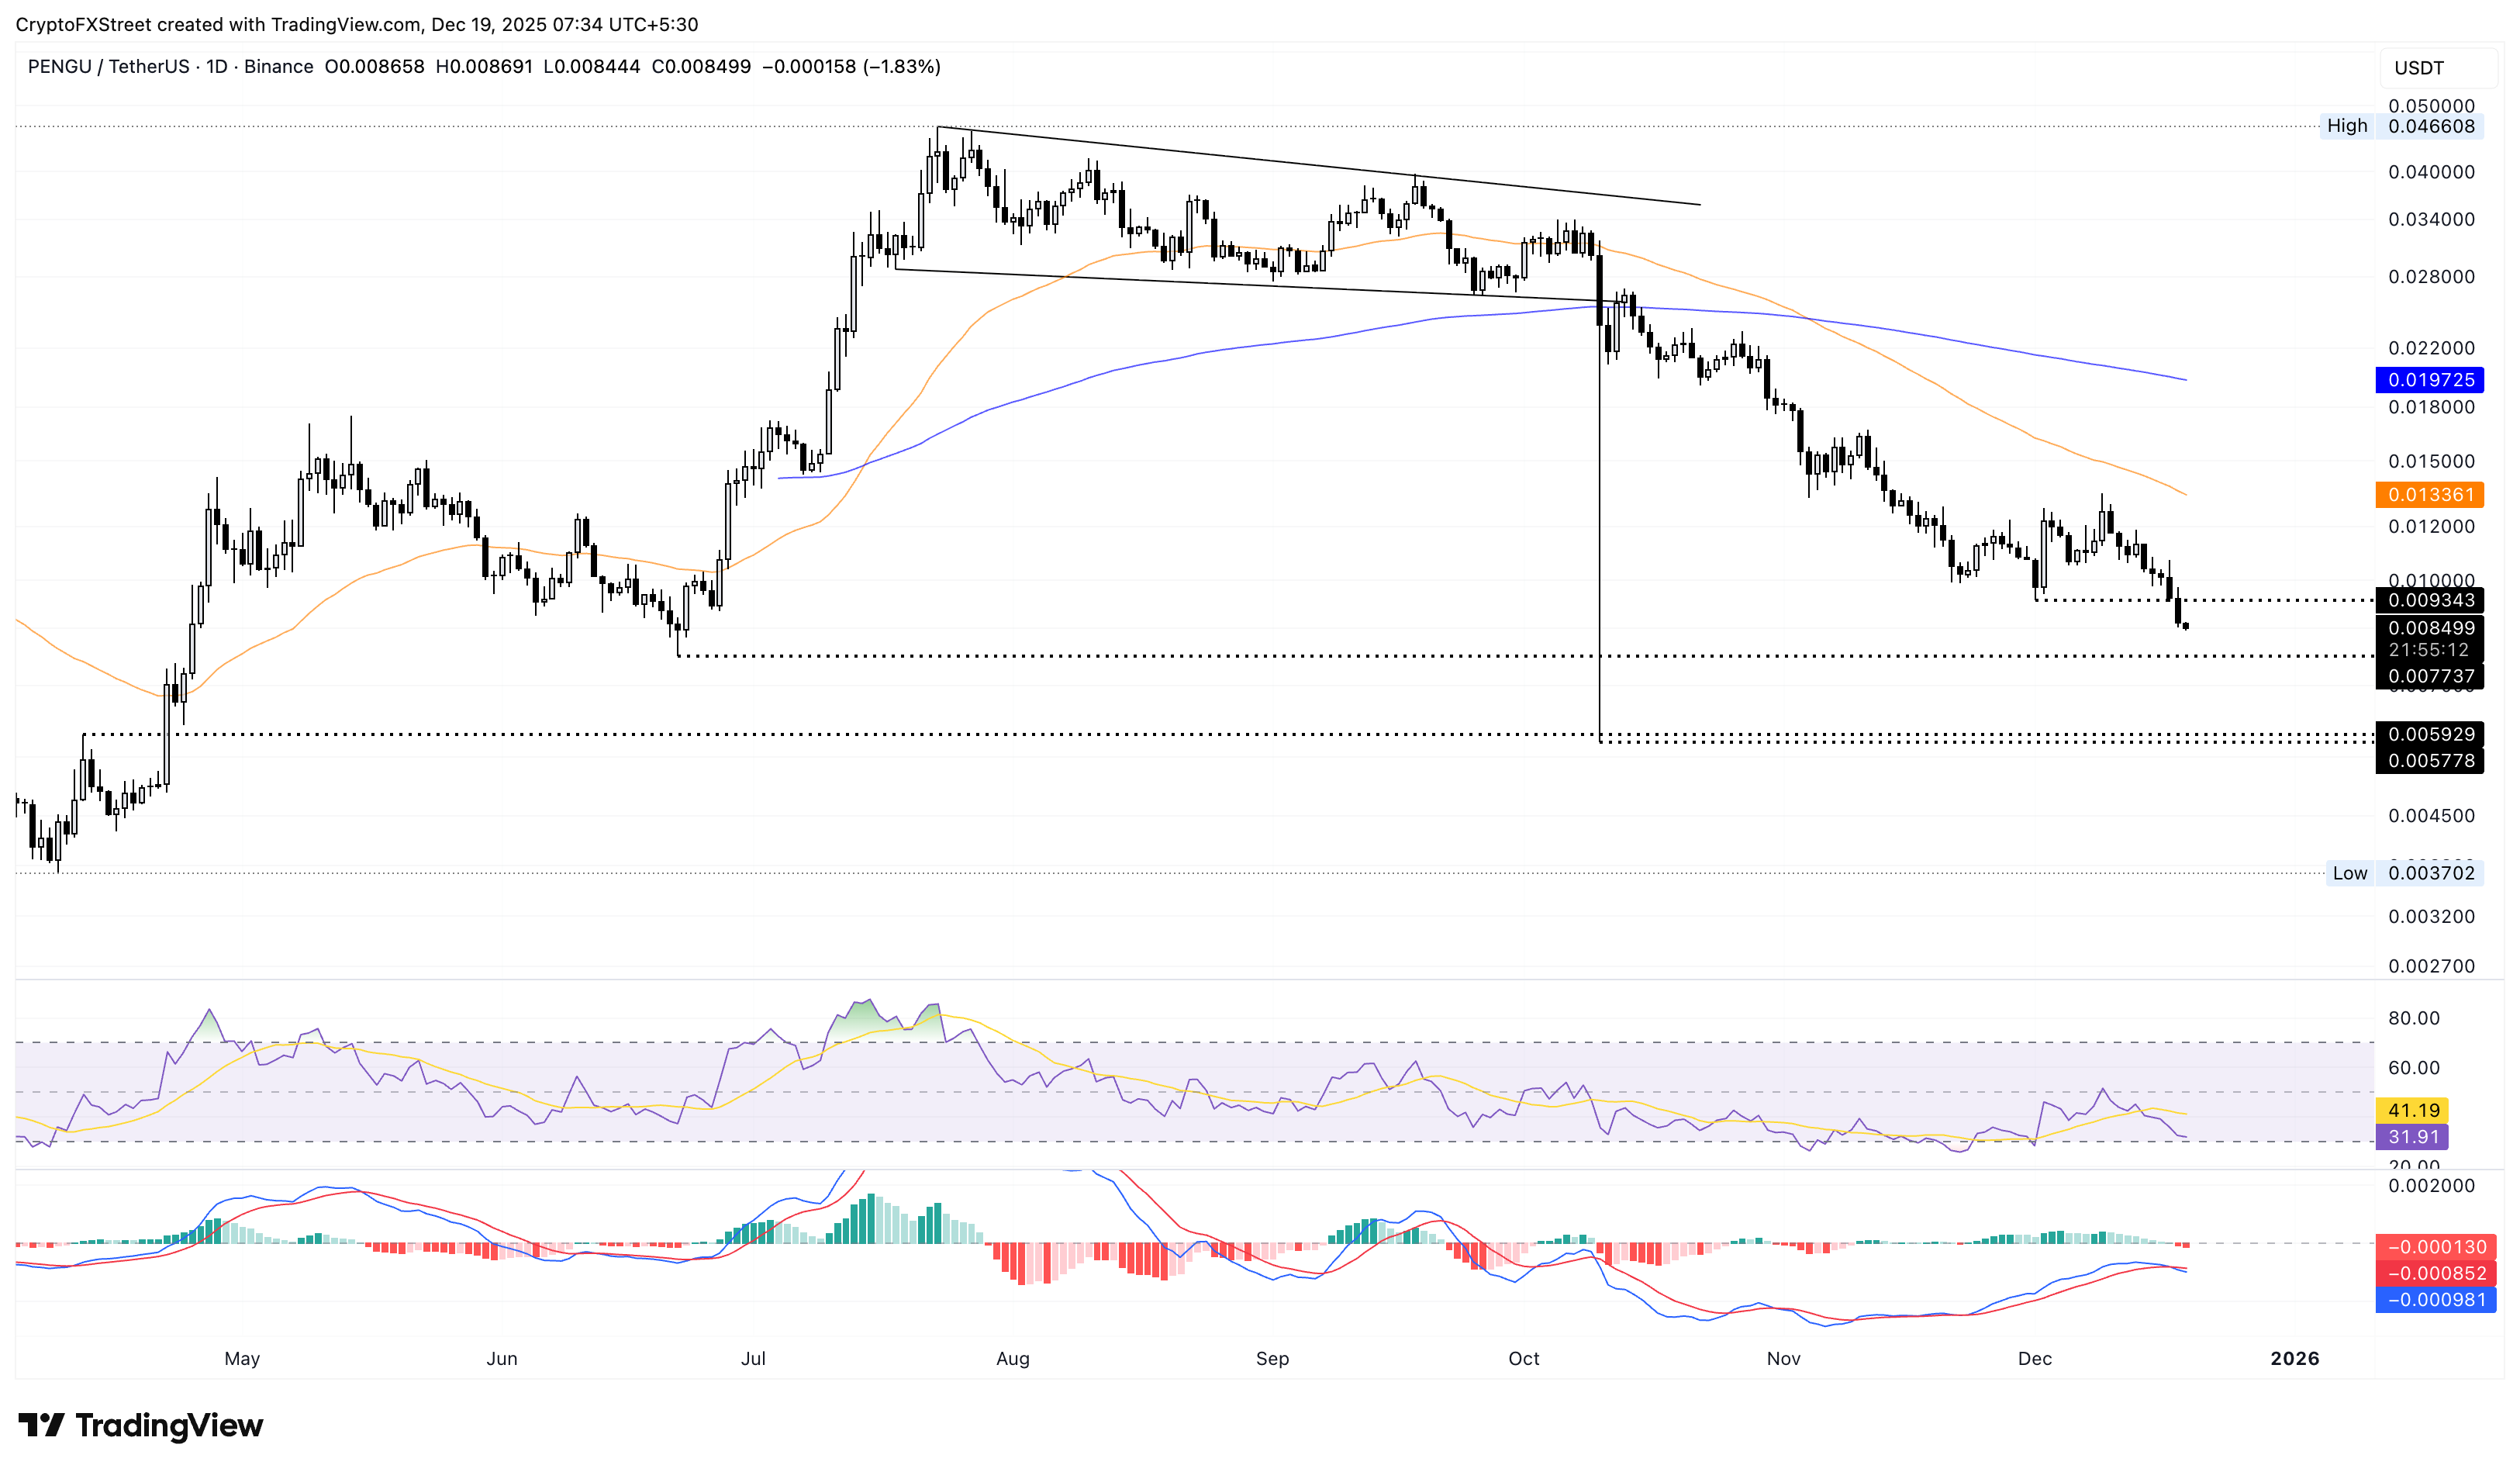
To reinstate an uptrend, PENGU should rebound above $0.001000.
Hyperliquid halts above $22 amid intense bearish pressure
Hyperliquid holds steady above $22.00 at press time on Friday, after an 8% decline on Thursday, which marked the fifth consecutive day of losses. Still, the perpetual-focused exchange token risks extending the decline to the October 10 low at $22.82.
If HYPE falls below this level, it could retest the $17.05 level marked by the February 17 low.
Similar to PUMP, the technical indicators suggest intense bearish pressure over Hyperliquid. The RSI at 25 remains oversold, but levels near 20 typically signal a possible reversal. Still, the MACD and signal lines extend the declining trend into negative territory, indicating a rise in bearish momentum.
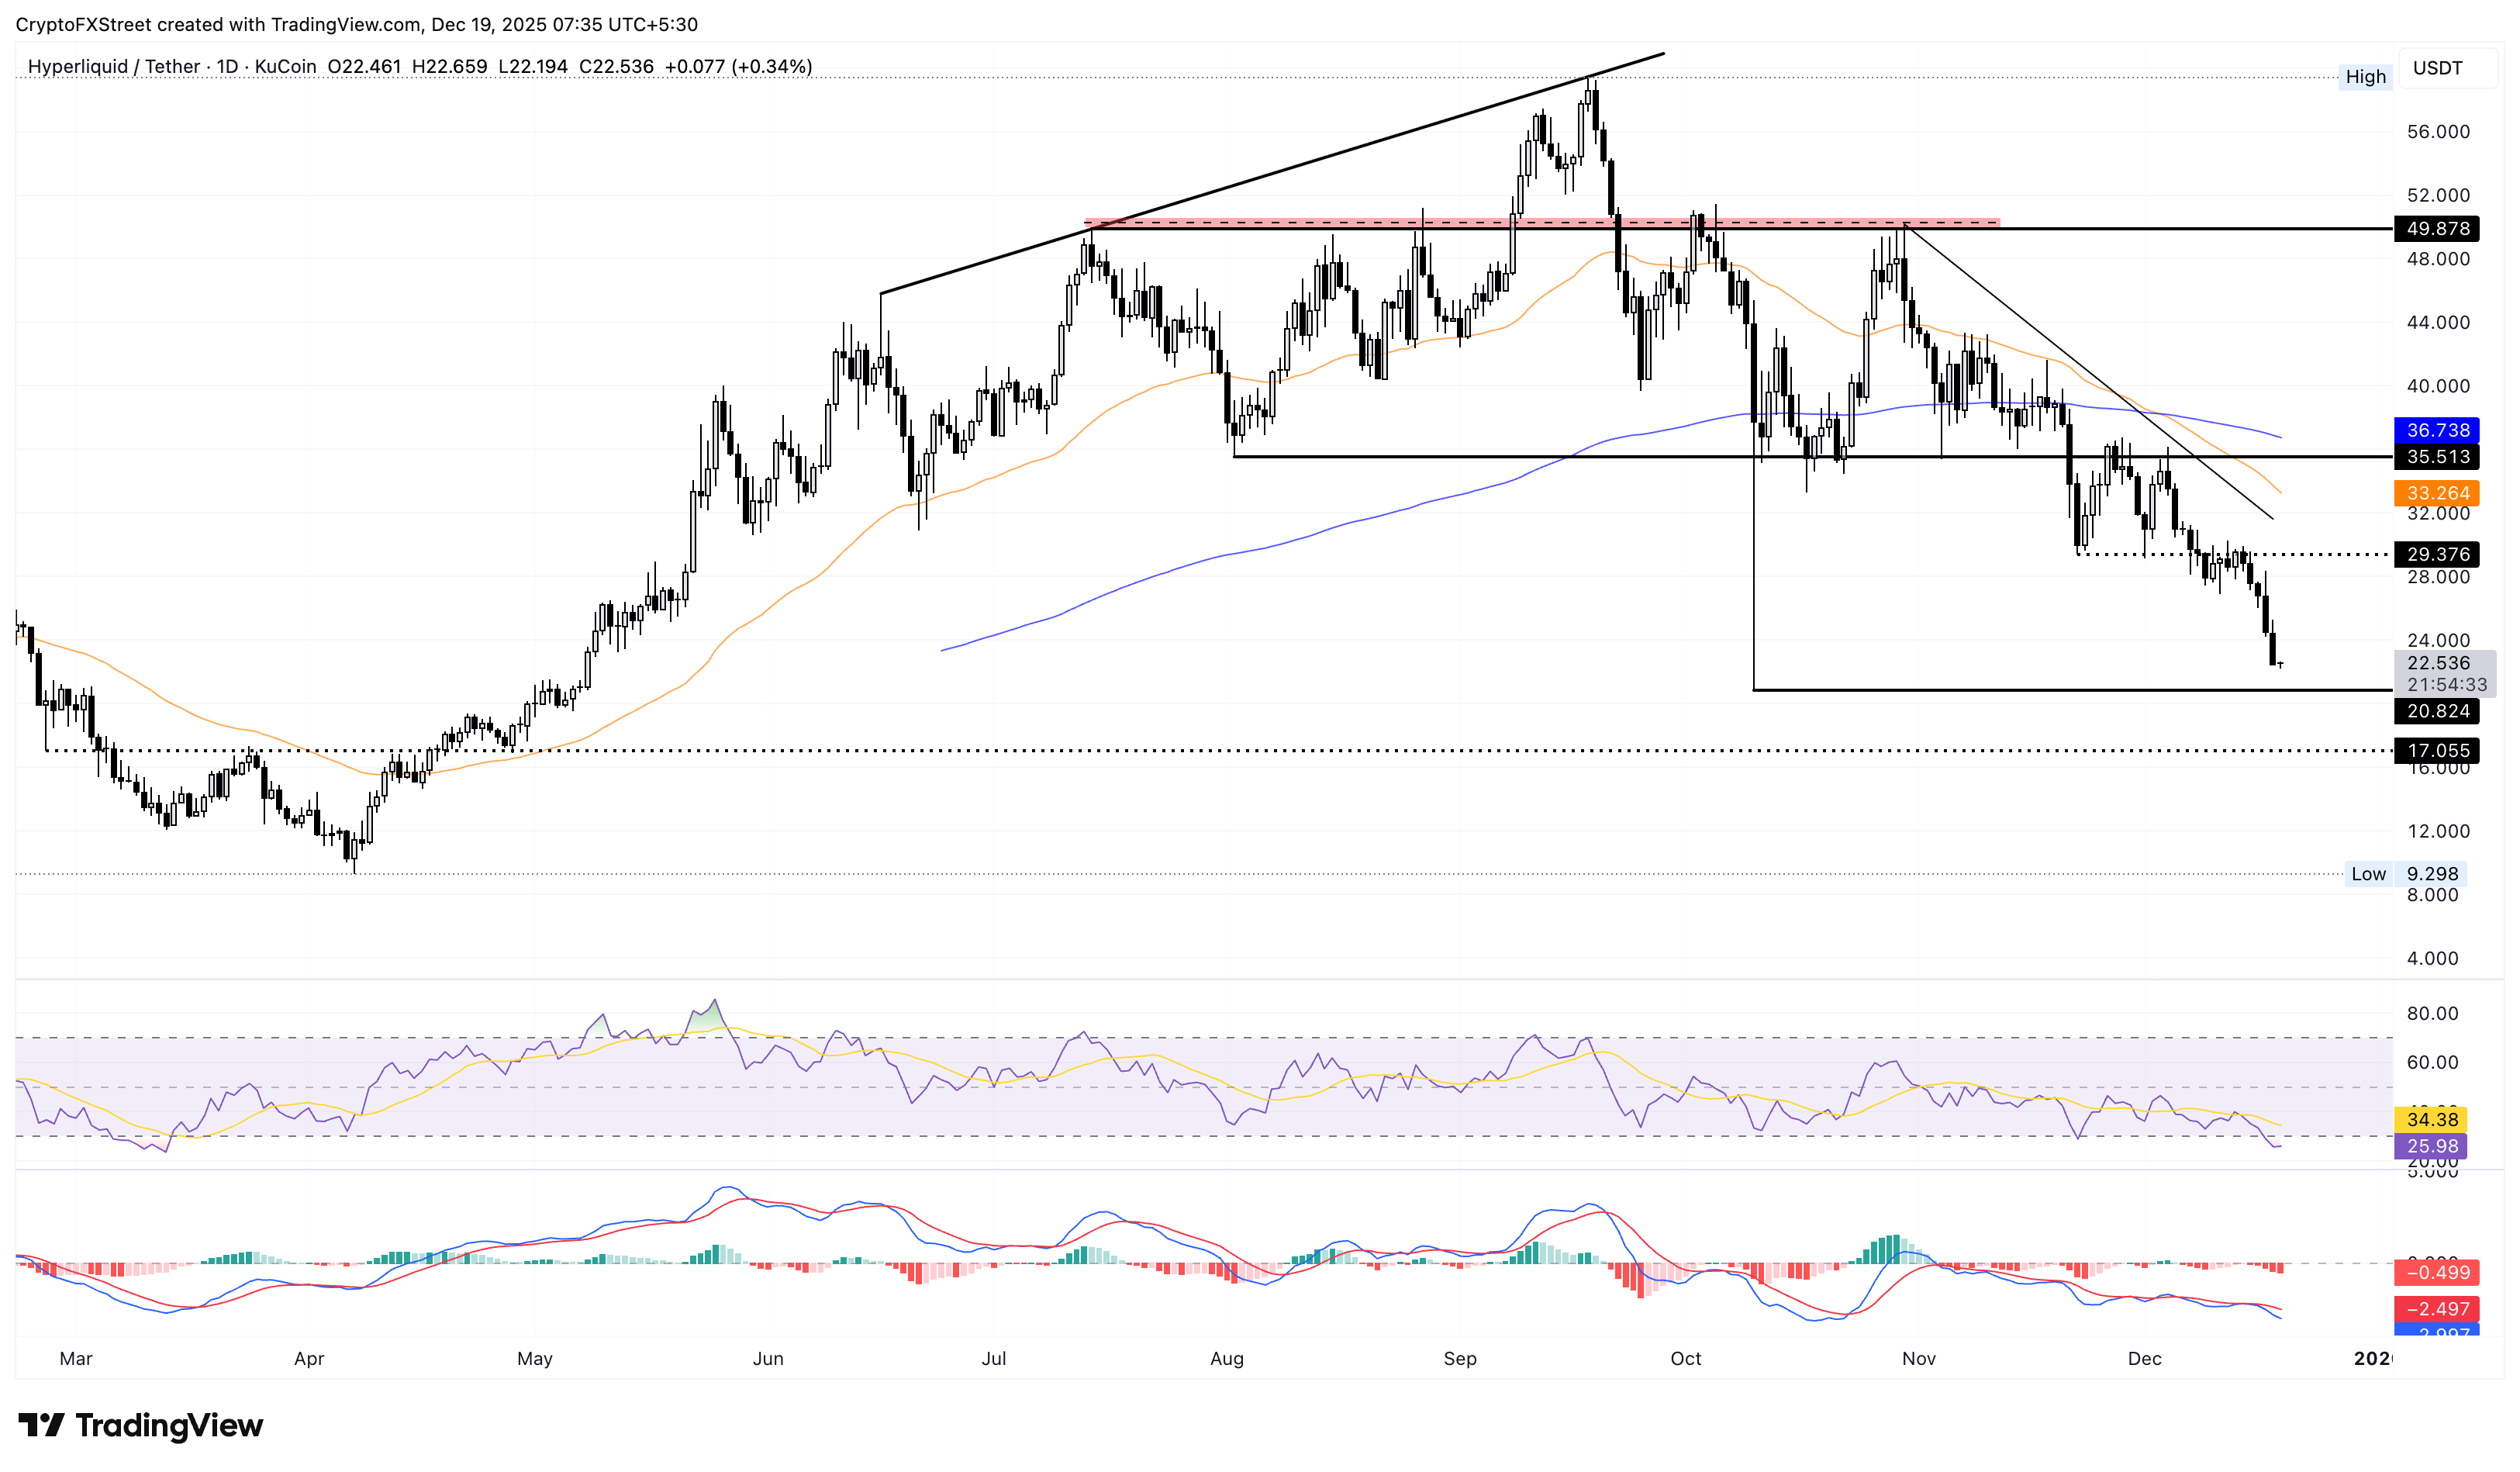
On the upside, a potential rebound in HYPE could target the November 22 low at $29.37 as the primary resistance.

Hơn một triệu người dùng dựa vào FXStreet để có dữ liệu thị trường thời gian thực, công cụ biểu đồ, góc nhìn chuyên gia và tin tức Forex. Lịch kinh tế toàn diện và các hội thảo web giáo dục giúp nhà giao dịch luôn cập nhật và đưa ra quyết định có tính toán. FXStreet có khoảng 60 nhân sự, chia giữa trụ sở Barcelona và nhiều khu vực toàn cầu.
Đọc thêm


